Changes in the miRNA-mRNA Regulatory
Network Precede Motor Symptoms in a
Mouse Model of Multiple System Atrophy:
Clinical Implications
Simon Schafferer1☯, Rimpi Khurana1☯, Violetta Refolo2, Serena Venezia2, Edith Sturm2,
Paolo Piatti3, Clara Hechenberger3, Hubert Hackl4, Roman Kessler1, Michaela Willi4, Ronald Gstir1, Anne Krogsdam4, Alexandra Lusser3, Werner Poewe5, Gregor K. Wenning2, Alexander Hüttenhofer1*, Nadia Stefanova2*
1Division of Genomics and RNomics, Biocenter, Medical University of Innsbruck, Innrain 80–82, 6020 Innsbruck, Austria,2Division of Neurobiology, Department of Neurology, Medical University of Innsbruck, Innrain 66/G2, 6020 Innsbruck, Austria,3Division of Molecular Biology, Biocenter, Medical University of Innsbruck, Innrain 80–82, 6020 Innsbruck, Austria,4Division of Bioinformatics, Biocenter, Medical University of Innsbruck, Innrain 80–82, 6020 Innsbruck, Austria,5Department of Neurology, Medical University of Innsbruck, Anichstr. 35, 6020 Innsbruck, Austria
☯These authors contributed equally to this work.
*[email protected](NS);[email protected](AH)
Abstract
Multiple system atrophy (MSA) is a fatal rapidly progressiveα-synucleinopathy,
character-ized byα-synuclein accumulation in oligodendrocytes. It is accepted that the pathologicalα
-synuclein accumulation in the brain of MSA patients plays a leading role in the disease pro-cess, but little is known about the events in the early stages of the disease. In this study we aimed to define potential roles of the miRNA-mRNA regulatory network in the early pre-motor stages of the disease, i.e., downstream ofα-synuclein accumulation in
oligodendrog-lia, as assessed in a transgenic mouse model of MSA. We investigated the expression pat-terns of miRNAs and their mRNA targets in substantia nigra (SN) and striatum, two brain regions that undergo neurodegeneration at a later stage in the MSA model, by microarray and RNA-seq analysis, respectively. Analysis was performed at a time point whenα
-synu-clein accumulation was already present in oligodendrocytes at neuropathological examina-tion, but no neuronal loss nor deficits of motor function had yet occurred. Our data provide a first evidence for the leading role of gene dysregulation associated with deficits in immune and inflammatory responses in the very early, non-symptomatic disease stages of MSA. While dysfunctional homeostasis and oxidative stress were prominent in SN in the early stages of MSA, in striatum differential gene expression in the non-symptomatic phase was linked to oligodendroglial dysfunction, disturbed protein handling, lipid metabolism, trans-membrane transport and altered cell death control, respectively. A large number of putative miRNA-mRNAs interaction partners were identified in relation to the control of these pro-cesses in the MSA model. Our results support the role of early changes in the miRNA-mRNA regulatory network in the pathogenesis of MSA preceding the clinical onset of the
OPEN ACCESS
Citation:Schafferer S, Khurana R, Refolo V, Venezia S, Sturm E, Piatti P, et al. (2016) Changes in the miRNA-mRNA Regulatory Network Precede Motor Symptoms in a Mouse Model of Multiple System Atrophy: Clinical Implications. PLoS ONE 11(3): e0150705. doi:10.1371/journal.pone.0150705
Editor:Stefan Maas, NIH, UNITED STATES
Received:October 29, 2015
Accepted:February 18, 2016
Published:March 10, 2016
Copyright:© 2016 Schafferer et al. This is an open access article distributed under the terms of the
Creative Commons Attribution License, which permits unrestricted use, distribution, and reproduction in any medium, provided the original author and source are credited.
Data Availability Statement:Array design and expression files have been deposited in ArrayExpress (MTAB-3985, MTAB-3986, E-MTAB-3993).
disease. The findings thus contribute to understanding the disease process and are likely to pave the way towards identifying disease biomarkers for early diagnosis of MSA.
Introduction
Multiple system atrophy (MSA) is a fatal, late onset, sporadic neurodegenerative disorder, which is characterized by a combination of non-motor and motor symptoms with rapid pro-gression resulting in disability and death shortly after clinical diagnosis [1]. The neuropathol-ogy encompasses degeneration of autonomic centers as well as striatonigral degeneration (SND) and olivopontocerebellar atrophy (OPCA) that underlie respectively the Parkinson syn-drome and the ataxia in MSA [2]. The major hallmark of the disease is the widespread occur-rence ofα-synuclein positive cytoplasmic inclusions in oligodendrocytes called glial
cytoplasmic inclusions (GCIs) [3–5]. It is currently accepted thatα-synuclein plays a major role in the pathogenesis of MSA [6]. Recent studies indicate that increased expression ofα -synuclein in MSA oligodendroglia [7;8] may trigger the pathological aggregation of the protein in these cells and the following neurodegenerative events that bring forward selective neuronal loss resulting in the clinical symptoms of MSA. Little is known, however, about the early events in the disease cascade before its clinical onset due to the difficulties to address this question in patients because early diagnostic markers for MSA are lacking at present.
Several transgenic models based on the targeted overexpression of humanα-synuclein in oligodendroglia have been developed by applying specific promoters, i. e. the 2,' 3'-cyclic nucle-otide 3'-phosphodiesterase (CNP), the myelin basic protein (MBP) promoter or the proteolipid protein (PLP) promoter (for detailed comparison of the different transgenic MSA models see [9]). The transgenic mouse model of MSA, based on targeted overexpression of humanα -synu-clein in oligodendrocytes under the PLP promoter [10] recapitulates many of the features observed in MSA-like oligodendroglialα-synucleinopathy. In this transgenic model oligoden-droglialα-synuclein pathology leads to slowly progressive motor deficits linked to delayed neu-ronal loss in the substantia nigra (SN) and striatum [11–13]. Therefore, the PLP-α-synuclein transgenic mouse is useful to address the early steps of MSA-like SND in its pre-motor phase.
Recent studies in MSA post-mortem brain tissue identified changes in the transcriptome expression profile [14]. Furthermore, possible dysregulation of microRNA (miRNA) expres-sion has been reported at the end-stage of the disease [15]. While mRNAs are translated into proteins, non-coding RNAs (ncRNAs), in particular miRNAs, have been shown to regulate the expression of mRNAs by targeting their 5’- or 3’-untranslated regions (UTRs), thereby regulat-ing their translation and/or mRNA stability. Hence, the interplay between miRNAs and mRNAs forms an intricate regulatory network and fine-tunes gene expression. MiRNAs are involved in numerous biological functions, including regulation of development and differenti-ation, apoptosis, or maintenance of cell integrity [16;17]. They have also been implicated in several CNS disorders, such as Alzheimer’s disease (AD), Parkinson’s disease (PD), or Hun-tington’s disease (HD), respectively [18–21]. In summary, the existing data suggest that miRNA-mRNA regulatory networks play a role in the pathogenesis of neurodegenerative dis-orders and we therefore hypothesize that they may have a role in MSA as well. In particular, early changes may be causal and may contribute to the pathogenesis of MSA, while late changes may represent a consequence of the already established neuronal and glial damage.
Hence, to get insights into the very early pathogenic mechanisms of neurodegeneration linked to oligodendroglialα-synuclein accumulation, in this study we investigated the miRNA-mRNA regulatory network in SN and striatum of MSA transgenic mice in a pre-motor stage of neurodegeneration.
Material and Methods
Animals
The generation and characterization of the PLP-α-synuclein mice in C57Bl/6 background was previously described [10]. Homozygous transgenic PLP-α-synuclein mice (further also termed MSA transgenic mice) obtained from Prof. Philipp Kahle (Tübingen, Germany) as well as background-matched control C57Bl/6 mice were bred and maintained in a temperature con-trolled SPF room under 12-hour light/dark cycle with free access to food and water at the Ani-mal Facility of the Medical University of Innsbruck. All mice were genotyped by ear punch using PCR for humanα-synuclein as previously described [22;23]. The oligodendroglialα -synuclein overexpression has been determined by 2', 3'-cyclic nucleotide 3'-phosphodiesterase (CNPase)/αSYN double immunofluorescence as previously shown [10;22;23]. All experiments were performed according to the EU and the Austrian legislation and with permission of the Ethics Board at the Federal Ministry of Science and Research, Austria (Permit No. BMWF-66.011/0034-II/10b/2010; BMWF-66.011/0128-II/3b/2011). All efforts were made to minimize the number of animals used and their suffering. Male mice in the third postnatal month (PM3) were used for the experiments.
Motor behavior
Behavioral tests were performed blindly to the genotype according to validated procedures. Spontaneous open field locomotor activity: The horizontal and vertical (rearing) open field activity was recorded for a period of 15 minutes applying the FlexField activity system (San Diego Instruments, CA). The test session was performed in the evening (6 p.m to 8 p.m.) in dark noise-isolated room [24]. The number of counts over a 15 min test period in the horizon-tal and vertical plane was taken for the statistical analysis.
Beam walking test: Motor coordination, balance and bradykinesia were assessed with the method adapted from Fernagut et al. [25] by measuring the ability of the mice to traverse a nar-row beam. The beams consist of two different strips of wood (each measuring 50 cm long, one was 1.6 cm and the other 0.9 cm square cross-section) placed horizontally 20 and 50 cm above the floor, respectively. During training, three daily sessions of three trials (nine crossings) were performed using the 1.6 cm square large beam. Mice were then tested using the 0.9 cm square beam. Mice were allowed to perform three consecutive trials. The time for traversing the beam as well as the number of sideslip errors was recorded on each trial and the mean traverse dura-tion and mean number of sideslip errors during a three-trial session was kept as the variable.
Pole test: The pole test was performed according to established protocols [26]. Each mouse was habituated to the test the day before. A wooden vertical pole with rough surface, 1 cm wide and 50 cm high was applied. The mouse was placed with the head up at the top of the pole and the time for turning downwards (Tturn) as well as the total time for climbing down the pole
until the mouse reaches the floor with the four paws (Ttotal) was taken in 5 trials. The best
per-formance of all the five trials was kept for the statistical analysis.
Grip strength: Grip strength was defined in gram by testing the ability of each mouse to keep holding to a grid while slowly increasing the load.
Neuropathological analysis
Mice were transcardially perfused with ice-cold 4% paraformaldehyde in PBS under deep thio-pental anesthesia. Brains were postfixed in the same fixative overnight at 4°C, cryoprotected in 30% sucrose and slowly frozen in 2-methylbutan and kept at -80°C until further processing. Serial 40μm sections were cut on a cryotome (Leica, Nussloch, Germany). Immunohistochem-istry was performed according to previously reported protocols [28]. The following primary antibodies were applied: monoclonal anti-tyrosine hydroxylase (TH, Sigma, St. Louis, U.S.A.), monoclonal anti-DARPP-32 (BD Transduction Laboratories), monoclonal anti-glial fibrillary acidic protein (GFAP, Millipore, Tamecula, CA), monoclonal anti-Iba1 (Abcam, UK) and monoclonal anti-α-synuclein (human) (15G7, Enzo Life Sciences, Lörrach, Germany). Stereo-logical analysis was performed applying a computer-assisted image analysis system (Nikon E-800 microscope, digital camera DXM 1200; Stereo Investigator Software, MicroBrightField Europe e.K., Magdeburg, Germany). The optical fractionator stereological method was used to estimate cell numbers including the number of TH-positive dopaminergic neurons in SN, the DARPP-32-positive neurons in striatum, as well as the number of type A, B, C and D of Iba1--positive microglia in both SN and striatum [29]. GFAP relative optical density (ROD) in SN and striatum was determined as previously described [30]. To assess cell death TUNEL staining was performed with the In Situ Cell Detection Kit, POD (Roche) according to the manufac-ture’s protocol. Brain sections from 12 months old MSA mice were used as a positive control. Samples were coverslipped with IS mounting medium (Dianova, Hamburg, Germany) and TUNEL positive nuclei were detected in the range of 515–565 nm (green) with a Leica fluores-cence microscope DMI 4000B provided with Digital Fire Wire Color Camera DFC300 FX and Application Suite V3.1 by Leica.
Statistical analysis of behavioral and neuropathological data to compare control and trans-genic MSA mice was done by t-test analysis with GraphPad Prism 5.03 software. Statistical sig-nificance was set at p<0.05. Data were presented as mean ± S.E.M.
RNA preparation and processing
Mice were sacrificed by cervical dislocation, brains were quickly extracted and SN and striatum were dissected on ice. Three pools of SN and striatum, respectively, from 5 mice each were pre-pared and frozen in liquid nitrogen. Total RNA was isolated using Tri-Reagent (Sigma-Aldrich, St. Louis, Missouri, USA) according to the manufacturer's instructions and dissolved in DEPC-water. Quantity and quality of RNA preparations was determined by 2100 Bioanalyzer (Agilent Technologies, Palo Alto, CA) measurement.
RNA-seq analysis of mRNA expression: For RNA-seq analysis, RNA was further purified using the RNA Clean&Concentrator Kit-25 (Zymo Research, Irvine, CA). RNA was then sub-mitted to polyA-enrichment (Dynabeads1mRNA Purification Kit, Life technologies) using 6μg of total RNA from each pooled sample. With the polyA-enriched RNA as input, libraries were generated with the Ion Total RNA-Seq Kit v2 (Ion torrent, Life Technologies) and bar-coded following the manufacturer’s instructions, except that the final bead-based size selection was adjusted to favor longer fragments (average read lengths>150 bp). The libraries were
sequenced on the Ion Proton Sequencer (Ion Torrent, Life Technologies), generating on aver-age 90 million reads per sample.
(Affymetrix), fluorescence signals were recorded by an Affymetrix scanner 3000 and image analysis was performed with the GCOS software (Affymetrix). Robust-multiarray average (RMA) [31] was applied for normalization. Intensities were log2-transformed and filtered for
probe set with interquartile range>0.35. Data preprocessing was done using R and the
Biocon-ductor package oligo [32].
Microarray analysis of miRNA expression: Labeling was performed by the Mercury LNA microRNA Hi-Power Labeling Kit from Exiqon. The standard protocol from Exiqon was employed with minor modifications. Briefly, 1μg of total RNA per sample was dephosphory-lated, split into two aliquots, which were subsequently fluorescently labeled with either Cy3 or Cy5 dyes to be used in dye swap experiments. Labeled samples were hybridized to miRCURY LNA miRNA Array 7thgeneration microarray (Exiqon Inc., Woburn Massachusetts, USA) using the Tecan HS400 Pro device (Tecan Group Ltd., Männedorf, Switzerland). Experiments were performed in dye swap pairs with three biological replicates from transgenic MSA mice and age- and sex-matched control mice, for both SN and striatum. The hybridization and washing of microarray slides was performed according to the manufacturer’s protocol. Upon washing, slides were dried by nitrogen gas at 23°C for 5 min. Scanning was performed immedi-ately following hybridization at a resolution of 5μm using the Tecan Powerscanner device (Tecan Group Ltd., Männedorf, Switzerland). Microarray scans were quantified using the data analysis software ArrayPro 6.3.
Differential expression analysis of RNA-seq and mRNA microarray data
RNA-seq raw reads were trimmed for residual adapter sequences and low quality sequences were removed using cutadapt [33] and FASTX-Toolkit (http://hannonlab.cshl.edu/fastx_ toolkit/index.html). Reads were then mapped to theMus musculusgenome (ENSEMBL release 38.78) using the STAR mapper for RNA sequences [34] and bowtie2 [35] in local mode for the unmapped reads. Mapped sequencing reads were analyzed by the HTSeq framework with the predefined parameter set [36]. Differential expression analysis of control versus transgenic MSA mice of both, striatum and SN samples, was performed by employing the DESeq2 pack-age with predefined parameters [37]. Genes with an adjusted p-value below 0.1 after multiple testing corrections were considered statistically significant [38].
For microarray data differential gene expression was tested by a moderated t-test using the limmapackage [39]. For both methods genes with an adjusted p-value<0.1 after multiple
test-ing corrections were considered statistically significant [38]. In order to obtain a single list of regulated mRNA candidates in SN, differentially expressed mRNAs from microarray and RNA-seq experiments were combined for the following miRNA-mRNA correlation analysis.
Differential expression analysis of miRNA microarray data
(version 1.48) for filtering by variance. In addition, all candidates that were missing an annota-tion in mouse were removed. Following, differential expression analysis was performed by cal-culating a linear model for each miRNA according to the guidelines for simple dye swap experiments [39]. Duplicated spots were considered in the linear model fit. This model was then employed to obtain test statistics by the empirical Bayes method providing stable estima-tions for the sample variance of a small number of arrays [44]. All differentially expressed miR-NAs with an adjusted p-value<0.1 after multiple testing corrections as proposed by
Benjamini and Hochberg were considered statistically significant [38].
Quantitative RT-PCR analysis
For mRNA analysis total RNA was reverse transcribed and used for real time PCR as described before [45]. PCR primer sequences are stated inS1 Table. Data were normalized againstGapdh and differences between control and MSA samples were calculated fromΔΔCTvalues. The
assay was performed in three biological replicates. For miRNA analysis total RNA was retro-transcribed using the miScript II RT Kit (Qiagen) following the manufacturer´s instructions. 2μg of total RNA was used as input per RT reaction. RT-PCR was performed in a ViiA7 real-time PCR sytem (Applied Biosystems) with the miScript SYBR Green PCR Kit (Qiagen) using specific forward primers corresponding to the mature miRNAs and the miScript universal primer provided with the kit (S1 Table). Ct values were normalized to that of U6 snRNA and differential expression between MSA and control samples was calculated using theΔΔCt method. The assays were performed in technical triplicates.
Two-way ANOVA with-Bonferroni correction for multiple testing was applied to identify significant differences in the expression of miRNAs or mRNAs between control and MSA mice. Results were considered significant at p<0.05.
Enrichment analyses
Gene ontology (GO) enrichment analysis of differentially expressed mRNAs was performed sep-arately for down- and up-regulated genes. Data from the RNA-seq analysis in striatum were uti-lized as input gene list and all annotated genes resulting from the RNA-seq analysis were employed as background gene list. For SN, data from both RNA-seq and microarray analysis were combined to generate the differentially expressed gene list and also the background gene list. GO enrichment analysis was performed by employing the R package GOStats (version 2.32.0) with predefined parameter set [46] on the available ontologies, i.e. biological process (BP), molecular function (MF) and cellular compartment (CC). The resulting significantly represented enriched GO-Terms (p<0.05) were filtered by allowing only the inclusion of GO-terms that
con-tain at least two differentially expressed genes. Next, GO-terms were further processed by utiliz-ing REVIGO [47], a program that clusters GO-terms by their relationship and p-values. The reference database for mouse was chosen for calculating GO-term sizes and 0.5 was chosen as threshold for the similarity of GO-terms as parameter set for REVIGO. KEGG pathway enrich-ment analysis was performed on differentially expressed mRNAs in striatum and SN by employ-ing the R package clusterProfiler (version 2.3.3) with q-value cutoff of 0.1 [48].
MiRNA family information was obtained from mirBase [49]. Enrichment analysis of differ-entially expressed miRNAs from both striatum and SN was performed separately by utilizing the R package gage (2.16.0) with predefined parameters [50].
miRNA-mRNA correlation analysis
p-value cutoff of 0.1. In addition, predicted target genes of other prediction programs i.e. RNA22 [52], miRanda [53] and TargetScan [54] were obtained from the mirWalk 2.0 website. Vali-dated miRNA target genes for all differentially expressed miRNAs were downloaded from mir-Walk 2.0 and from miRTarBase[55]. The calculation of the correlation coefficient between mRNAs and miRNAs was conducted by employing the Pearson correlation analysis in each region (SN and striatum). Thereby, the expression values of differentially expressed miRNAs and mRNAs were utilized. Since there were only two MSA samples (pools of 5 brains each) present in RNA-seq analysis, the existing third control sample was ignored. For each miRNA, the correlation of all differentially expressed mRNAs was calculated and complemented with predicted and validated target information. In SN, correlation values were calculated separately for data obtained by RNA-seq and mRNA microarray analyses, respectively. These analyses resulted in a list of miRNAs containing information about their predicted target genes and cor-relation values. This list was filtered for miRNA-target interactions, which (i) were predicted by mirWalk 2.0 with a p-value<0.1, or (ii) were predicted by at least two prediction programs,
or (iii) feature a validated target gene. In all cases, a minimum correlation value of -0.3 was required. The filtered list can be found inS10 Table.
Array design and raw expression files have been deposited in ArrayExpress (E-MTAB-3985, E-MTAB-3986, E-MTAB-3993).
Results
Neuropathological and functional characterization of the MSA transgenic
mouse model in the pre-motor stage of disease
In the MSA transgenic mouse model used in this study, neurodegeneration in SN and striatum accompanied by GCI-like pathology, similar to the human disease, has been detected at an older age (over 4 months) [13]. When we analysed PM3 transgenicα-synuclein expression, we found accumulation of humanα-synuclein in oligodendrocytes mimicking the GCI pathology of human MSA (Fig 1A). Furthermore, RNA expression analysis revealed a 260-fold increase ofSNCAexpression in SN and a 163-fold increase in striatum (seeS2andS3Tables). Despite the presence of GCIs, no neuronal loss was identified in SN or striatum, respectively, at this stage (Fig 1B and 1C). Gliosis has been described in the degenerating brain areas in both symp-tomatic human MSA [56;57] and after four months of age in the MSA mouse model [11]. How-ever, no changes in the morphological microglia activation profile between control and MSA mice in PM3 were identified in the striatum and SN (Fig 1D) as well as no astroglial activation was detected (Fig 1E). To identify whether cell damage resulting with cell death was detectable at this stage TUNEL staining was performed. No indication of cell death in MSA mice in the pre-motor stage of disease was detected neither in the SN, nor in the striatum (Fig 1F). The absence of neuronal loss was reflected by the preserved motor performance of MSA transgenic mice as compared to control animals at this age (Table 1). In summary, the motor and neuropathological analysis of the MSA transgenic mouse showed that, at the young age (PM3), the model replicates an early pre-motor phase of MSA-like pathology with presence ofα-synuclein accumulation in oligodendrocytes but lack of neuronal loss in SN and striatum (two brain regions that are later affected by neurodegeneration) and respectively absence of motor deficits.
Significant alterations in mRNA profiles in striatum and SN of early stage
MSA mice
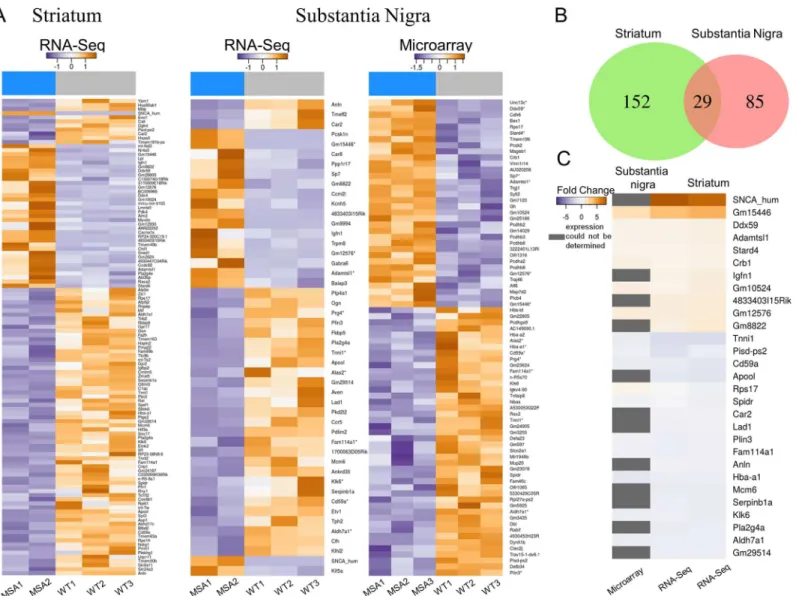
To examine the expression pattern of mRNAs from MSA transgenic mice in a pre-motor phase of the disease, we performed RNA-seq for striatum samples as well as RNA-seq and microarray analysis for SN of MSA mice and healthy age-, sex- and background-matched con-trols. These experiments revealed 181 differentially expressed mRNAs in striatum, 119 of which were down-regulated while the expression of 62 mRNAs was up-regulated in MSA mice (Fig 2AandS2 Table). In SN, of the 48 differentially expressed mRNAs identified by RNA-seq analysis, 30 mRNAs were down-regulated while expression of 18 genes was up-regulated (Fig 2A). By microarray analysis, we detected 44 down-regulated and 34 up-regulated mRNAs (Fig 2A). Significant differential expression of 12 mRNAs was found by both methods, while the remaining de-regulated mRNAs showed significant changes detected by either one of both methods (S1B Fig). To verify the accuracy of the techniques we performed: i) correlation analy-sis of mRNA expression acquired by RNA-seq and microarray by Bland-Altman plot ([58],
S1C Fig), and ii) RT-PCR analysis of representative mRNAs (S4 Fig). Upon closer investiga-tion, we noted that the non-overlapping mRNAs, which were found to be differentially expressed by employing either RNA-Seq or microarray, exhibited similar expression fold-changes in the respective alternative method but were not detected as differentially expressed in the analysis because they missed the threshold for statistical significance (p<0.1) (S1D Fig).
Since even small changes in mRNA expression might be significant at the early stage of the disease, done by t-test analysis with GraphPad Prism 5.03 software. Statistical significance was set at p<0.05. Data
are presented as mean±SEM. (F) TUNEL staining detected no cell death in SN and striatum of PM3 MSA
mice. As a positive control we applied aged PM12 MSA mice (an age when detectable neuronal loss is recorded) that demonstrated positive TUNEL staining.
doi:10.1371/journal.pone.0150705.g001
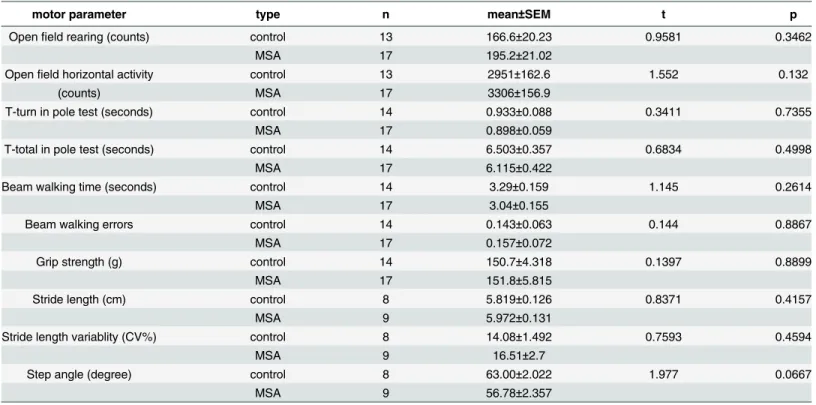
Table 1. Motor analysis of MSA versus age-matched control mice.
motor parameter type n mean±SEM t p
Openfield rearing (counts) control 13 166.6±20.23 0.9581 0.3462
MSA 17 195.2±21.02
Openfield horizontal activity control 13 2951±162.6 1.552 0.132
(counts) MSA 17 3306±156.9
T-turn in pole test (seconds) control 14 0.933±0.088 0.3411 0.7355
MSA 17 0.898±0.059
T-total in pole test (seconds) control 14 6.503±0.357 0.6834 0.4998
MSA 17 6.115±0.422
Beam walking time (seconds) control 14 3.29±0.159 1.145 0.2614
MSA 17 3.04±0.155
Beam walking errors control 14 0.143±0.063 0.144 0.8867
MSA 17 0.157±0.072
Grip strength (g) control 14 150.7±4.318 0.1397 0.8899
MSA 17 151.8±5.815
Stride length (cm) control 8 5.819±0.126 0.8371 0.4157
MSA 9 5.972±0.131
Stride length variablity (CV%) control 8 14.08±1.492 0.7593 0.4594
MSA 9 16.51±2.7
Step angle (degree) control 8 63.00±2.022 1.977 0.0667
MSA 9 56.78±2.357
Motor behavior was analyzed by several behavioral tests. Comparison between MSA and control mice by t-test detected no functional differences.
but might differently be identified by two fundamentally different analysis methods, such as RNA-seq and microarray, we decided to combine the results from both analyses giving at total of 114 de-regulated genes in SN (S3 Table), thereby accepting potentially lower stringency standards.
When comparing mRNA expression profiles of striatum and SN in pre-motor MSA mice, we identified 29 mRNAs, which showed differential expression in both tissues (Fig 2B). Thereby, only one gene, i. e. ribosomal protein S17 (Rps17), showed an opposite expression Fig 2. Differential expression of mRNAs in a mouse model of pre-motor stage MSA.(A) Heatmaps represent significantly differentially expressed genes of RNA-seq (striatum, SN) and microarray (SN) analyses. For each gene (row), the log2-transformed change of the expression value in each sample to the average expression value over all samples is shown. Columns represent individual replicates grouped into MSA and control (WT) samples indicated by the blue (MSA) and grey (WT) bars at the top of the heatmaps. The color gradient indicates the expression change from negative to positive. The asterisks following gene names indicate overlapping genes between microarray and RNA-seq analyses in SN. (B) Venn diagram illustrating the number of overlapping differentially expressed mRNAs between SN and striatum tissue in MSA mice. (C) Heatmap highlights log2-transformed fold changes of mRNAs overlapping between striatum und SN. Down-regulated mRNAs are indicated by a blue color gradient, whereas up-regulated miRNAs are indicated by an orange color gradient. mRNA with expression signals below background in the microarray experiment are highlighted in gray. From left to right, microarray and RNA-seq analysis results of SN and RNA-seq analysis of striatum are shown. Differential expression analysis of control versus transgenic MSA mice of both, striatum and SN samples, was performed by employing the DESeq2 package with predefined parameters [37]. Genes with an adjusted p-value below 0.1 after multiple testing corrections were considered statistically significant [38]. For microarray data differential gene expression was tested by a moderated t-test using thelimmapackage [39]. For both methods genes with an adjusted p-value<0.1 after multiple testing corrections were considered statistically significant [38].
pattern in striatum and SN tissue (Fig 2C). Furthermore, 152 genes were differentially
expressed in the striatum but not in SN, while another 85 genes were differentially expressed in SN, but not in the striatum of pre-motor MSA mice. These results point towards region-spe-cific differences in transcriptome de-regulation in SN and striatum, which may be linked to dif-ferences in their vulnerability.
Functional enrichment analysis of differentially expressed genes in the
mouse model of pre-motor MSA
In order to get deeper functional insights into the role of the differentially expressed mRNAs, we examined the potential enrichment of GO terms for biological processes for up- and down-regulated genes, respectively, using R package GOStats (version 2.32.0).
For the striatum of MSA mice we identified 191 enriched functional categories (p<0.05;S4 Table). Several GO terms were highly relevant to suggested human MSA disease pathways [59–63]. To provide further objective and unbiased analysis of the data, REVIGO clustering based on gene relationships and p values in the striatum was performed (http://revigo.irb.hr/). This analysis revealed clusters of dysregulated genes related to 6 major modules and categories (S5 Table) including:
1. oligodendroglial dysfunction;
2. protein handling;
3. dysfunctional metabolism (including monocarboxylic acid biosynthetic process, cellular lipid metabolic process and lipid biosynthetic process);
4. disrupted transmembrane transport;
5. altered inflammatory and immune responses.
6. cell death.
In addition, KEGG pathway enrichment analysis for striatum revealed differentially expressed genes which are involved in related neurological disorders such as AD, PD or Prion disease and genes linked to disturbed protein processing in endoplasmic reticulum, lipid metabolism, immune response/antigen presentation, ribosomal function and oxidative phosphorylation (S1E Fig).
Functional enrichment analysis for de-regulated genes in SN of MSA mice in a pre-motor stage of the disease identified 28 significantly enriched categories (p<0.05) (S6 Table).
REVIGO analysis (http://revigo.irb.hr/) of the GO-terms linked to differentially expressed genes in the SN of MSA mice identified two major clusters (S7 Table) linked to the modules:
1. altered immune and inflammatory responses;
2. disrupted ion (including oxygen) homeostasis and oxidative stress.
KEGG pathway analysis in SN of pre-motor MSA mice (S1F Fig) indicated differentially regulated enriched pathways linked to parasitic diseases like African trypanosomiasis and Malaria with strong involvement of the immune system, to nitrogen metabolism, which may be associated with neurotoxicity [64], and to long-term depression possibly related to changes in synaptic transmission [65].
Differential expression profile of miRNAs in striatum and SN of pre-motor
MSA transgenic mice
mRNA expression in striatum and SN of young MSA mice. To this end, we employed the Exi-qon miRCURY LNA miRNA array to investigate global miRNA expression patterns in the same MSA- and control mouse samples that were used for mRNA profiling. These experiments revealed 33 miRNAs whose expression was de-regulated in striatum (S8 Table). Among the dif-ferentially expressed miRNAs, four showed up-regulation in their expression, while the expres-sion of 29 miRNAs was down-regulated (Fig 3AandS8 Table).
The analysis of miRNA expression patterns in SN revealed a higher number of deregulated miRNAs in SN than in striatum. Thereby, a total of 59 differentially expressed miRNAs was observed with 29 being up-regulated and 30 down-regulated (Fig 3AandS9 Table). Analysis of differentially expressed miRNAs showed significant enrichment (p<0.001) of the miRNA
fam-ily mir-467 among the up-regulated miRNAs (Fig 3B). Furthermore, comparison of striatum and SN tissues revealed 13 miRNAs, whose expression was down-regulated in both brain areas in MSA mice compared to controls (Fig 3C).
Predicted regulatory networks of miRNA-mRNA interactions in the
pre-motor MSA mouse model
Next, to identify potential regulatory miRNA-mRNA interactions, we performed correlation analyses of de-regulated mRNAs and miRNAs in striatum and SN. We identified 56 candidate mRNA interaction partners of 54 miRNAs in SN and 81 candidate mRNA interaction partners of 32 miRNAs in striatum of the early stage MSA mouse model. The candidate mRNA partners showed a predicted or validated 3’-UTR miRNA binding site and a negative correlation with at least one differentially expressed miRNA from our screen as well as associated to at least one significantly enriched functional category of the respective brain region (Fig 4). To verify the results, representative miRNA-mRNA predicted pairs were analyzed additionally by RT-PCR analysis (S5 Fig).
To assess the biological implications of the miRNA-mRNA regulatory network, we inspected these candidate interactions more closely with respect to the significantly enriched GO-categories reported above (S2andS3Figs). Several candidate interactions of up-regulated miRNAs and down-regulated target genes were assigned to the category“immune system pro-cess”, which was found as one of the major enriched GO terms in our mRNA profiling data both in striatum and SN (Fig 5). Among those genes are, for instance,Anln,or CD59a, which we found to be down-regulated in both SN and striatum. Thereby, Anillin (Anln) was predicted to be regulated by the highly enriched mir-467 cluster.Anlnencodes an actin-binding protein involved in dynamic reorganization of the actin cytoskeleton that may link to the control of TLR4 mediated phagocytosis [66] and to the regulation of epithelial junctions [67].CD59a encodes a protein that is involved in the regulation of the complement cascade and recent stud-ies in knock-out mice have suggested its involvement in pathological tau accumulation [68]. By contrast, some predicted de-regulated miRNA-mRNA pairs of this category were only found in one of the two brain areas. The upregulation ofAim2in the striatum but not the SN of MSA mice was predicted to be linked to the concomitant down-regulation of several miRNAs (Fig 5). AIM2 is an interferon-inducible protein which may induce increased release of inflamma-tory cytokines and inflammasome-mediated cell death [69]. Alternatively,Ccr5was down-reg-ulated only in the SN of MSA mice and predicted to be controlled by several concomitantly up-regulated miRNAs.Ccr5that encodes a chemokine receptor and its dysfunction has been pro-posed to associate with disruption of the phagocytic activity of macrophages [70].
Fig 3. Differential expression of miRNAs in a mouse model of pre-motor stage MSA.(A) Heatmap shows expression changes of miRNAs of striatum (left) and SN (right). miRNAs with statistically significant (adjusted p<0.1) changes are indicated by a red line on the side. Gray boxes designate miRNAs with expression signals below background. The color gradient shows positive and negative log2-transformed fold changes in orange and blue color, respectively. (B) Fold change and adjusted p-value of the miRNAs of the mir-467 family. (C) Venn diagram illustrates the overlap of differentially expressed miRNAs between SN and striatum in MSA mice. Differential expression analysis was performed by calculating a linear model for each miRNA according to the guidelines for simple dye swap experiments [39]. Duplicated spots were considered in the linear model fit. This model was then employed to obtain test statistics by the empirical Bayes method providing stable estimations for the sample variance of a small number of arrays [44]. All differentially expressed miRNAs with an adjusted p-value<0.1 after multiple testing corrections as proposed by Benjamini and Hochberg were considered statistically significant
[38].
doi:10.1371/journal.pone.0150705.g003
Fig 4. De-regulated miRNAs and their correlation to putative target de-regulated mRNAsin substantia nigra (A) and striatum (B) of MSA mice in a pre-motor stage of disease. Shortlisted miRNA-targets are based on 3 factors: (i) predicted in miRwalk with p-value<0.1 (ii) experimentally validated and (iii)
present in at least two prediction programs.
cluster (e.g.Ccr5, Chemokine (C-C Motif) Receptor 5;Car2, carbonic anhydrase 2;Hba-a and, Hba-a2, hemoglobin alpha, adult chain 1 and 2) are putative targets of up-regulated miRNAs in the region suggesting a possible miRNA-mRNA network in the SN associated with the mediation of oxidative stress in the early disease stages (Fig 6). Interestingly, some of the differ-entially expressed genes (e.g.Ccr5) were assigned to the both REVIGO cluster categories
“immune and inflammatory response”and“disrupted ion homeostasis and oxidative stress”
reflecting the interconnected nature of these processes. In the striatum, REVIGO clustering did not provide strong evidence for a leading role of disrupted homeostasis and oxidative stress in striatum in the early pre-motor stages of disease in the MSA mouse model (S5 Table), however differentially expressed genes associated with GO-terms like“response to oxidative stress”,
“response to decreased oxygen levels”and“cellular response to nitrogen compound”(e.g. Pdk4, Pyruvate Dehydrogenase Kinase, Isozyme 4;Ryr2, Ryanodine receptor 2;Melk, Maternal Embryonic Leucine Zipper Kinase;Txnip, Thioredoxin Interacting Protein) (seeS4 Table) pro-vide putative targets of de-regulated miRNAs in the region (Fig 4B). These data may indicate that—unlike in the SN—in striatum, miRNA-mRNA interactions to regulate the oxidative stress status of cells may be less significant in the early disease stages but may gain in impor-tance during disease progression (see alsoDiscussion).
Fig 5. Deregulated miRNA-mRNA regulatory network to“Immune system process”in MSA mice in disease pre-motor stage.Differentially expressed miRNAs with predicted negatively correlated differentially expressed mRNA targets are visualized by employing Cytoscape (version 3.2.1). Round nodes show mRNA and triangle nodes miRNA. Node size is proportional to its degree. Fold change (log2transformed) for each node is ranging from red (negative) to green (positive). Interaction arrow thickness is proportional to the number of algorithms predicting the miRNA-mRNA target 3’UTR interaction, ranging from one to four. Differential expression of genes, in striatum and SN, such asAnln,Car2,Cd59a,Hba-a1andRps17, is visualized by color corresponding to the mean fold change (exact values can be found inS2andS3Tables).
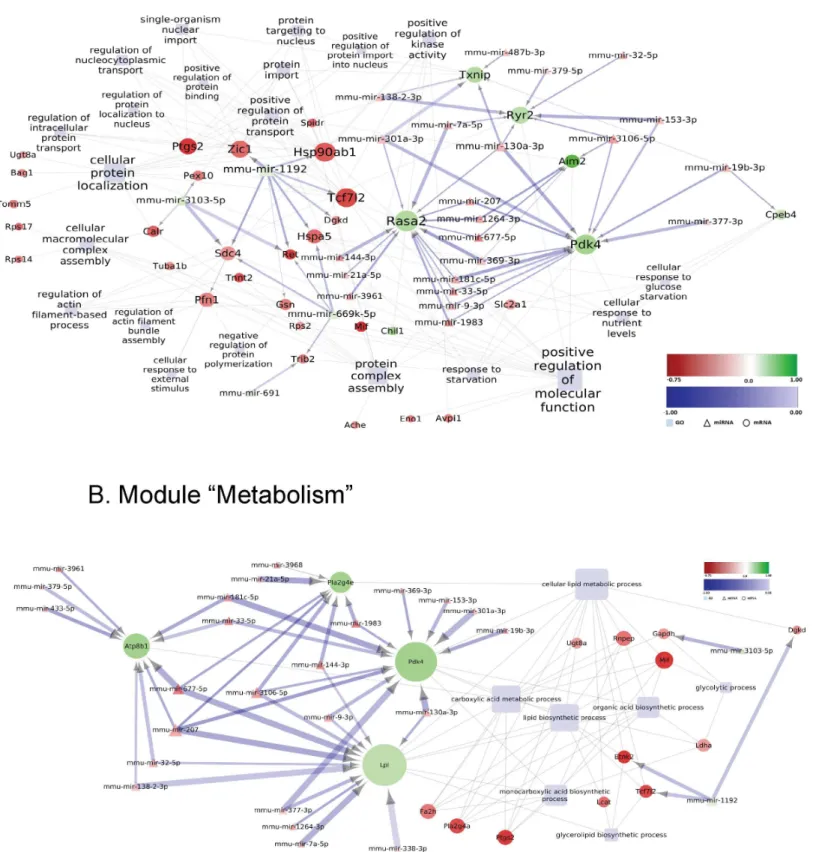
In the striatum of MSA mice in the pre-motor stage of disease, further dysfunctional biolog-ical modules were identified with variable involvement of the miRNA network in the predicted control of mRNA expression. With the current stringency of the screening, we did not find a link between miRNA modulation and oligodendroglial dysfunction/myelination (S3 Fig). Sev-eral down-regulated genes involved in the module“protein handling”(among thoseRasa2, RAS P21 Protein Activator 2 andPdk4, Pyruvate Dehydrogenase Kinase, Isozyme 4) were pre-dicted to be controlled by several shared up-regulated miRNAs (Fig 7A). Alternatively, mmu-mir-1192 down-regulation was predicted to promote the up-regulation of genes such as Hsp90ab1, Heat Shock Protein 90kDa Alpha (Cytosolic), Class B Member 1;Hspa5, Heat Shock 70kDa Protein 5;Tcf7l2, Transcription factor 7-like 2;Ret, RET Receptor Tyrosine Kinase;Dgkd, Diglyceride Kinase Delta;Sdc4, Syndecan 4;Zic1, Zinc Finger Protein ZIC 1 (Fig 7A). The module“Metabolism”also harbors several genes de-regulated in the striatum of pre-motor MSA mice which represent putative targets of a considerable number of deregulated miRNAs (Fig 7B). Of note, genes with links to lipid metabolism, such asPdk4(Pyruvate Dehy-drogenase Kinase, Isozyme 4),Lpl(Lipoprotein Lipase) orPla2g4e(Phospholipase A2, Group Fig 6. Deregulated miRNA-mRNA regulatory network to“Homeostasis/oxidative stress”in SN of MSA mice in a pre-motor stage.Differentially expressed miRNAs with predicted negatively mRNA targets assigned to the indicated GO-terms (light blue rectangles) are visualized by employing
Cytoscape (version 3.2.1). Round nodes designate mRNA and triangle nodes miRNA. Node size is proportional to its degree. Fold change (log2transformed) for each node is ranging from -0.75 (red) to 1 (green). The shade of blue color of the interaction arrows indicates the degree (range -1.00–0.00) of negative correlation between miRNA-mRNA target 3’UTR interaction. Interaction arrow thickness is proportional to the number of algorithms predicting the miRNA-mRNA target 3’UTR interaction, ranging from one to four.
Fig 7. Deregulated miRNA-mRNA regulatory network in the striatum of MSA mice in pre-motor stage of disease:Modules“Protein handling”(A) and
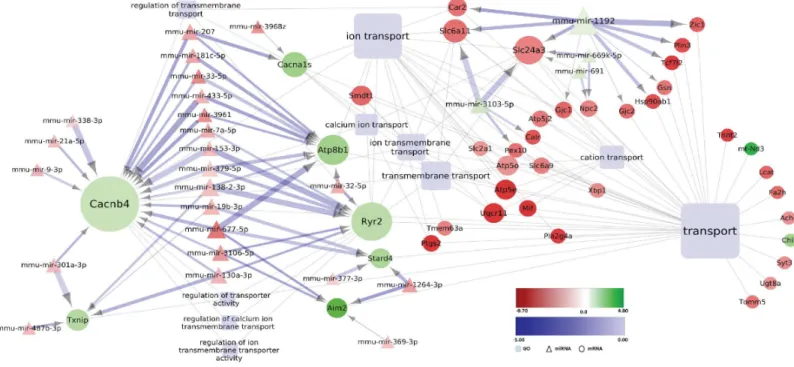
IVE) were strongly represented in this group (Fig 7B). Changes in lipid metabolism have been shown to be relevant to the human disease [62], and it is therefore intriguing to see that early alterations in this process might be caused by miRNA-mRNA network interactions. The mod-ule“Transmembrane transport”was a further category with prominent predicted interaction between dysregulated miRNAs and mRNAs. The genesCacnb4(calcium channel ß4 subunit), andRyr2(ryanodine receptor 2), both related to calcium transport as well asAtp8b1(ATPase, aminophospholipid transporter, class I, type 8B, member 1) associated with lipid transmem-brane transport, were predicted to be controlled by several deregulated miRNAs (Fig 8A). Finally, some predicted miRNA-mRNA interactions grouped into the category“Cell death”in the striatum of pre-motor stage MSA mice (Fig 8B).
Discussion
The current study represents the first evaluation of transcriptome-wide changes in mRNA and miRNA expression patterns in the SN and striatum of an MSA mouse model in a pre-motor stage of the disease and provides evidence for a dysregulation of the miRNA-mRNA regulatory network, preceding the onset of motor symptoms. This stage is characterized by very high lev-els of expression of the humanα-synuclein transgeneSNCAin both SN (260 fold change) and striatum (163 fold change), respectively, which corresponds to a 10-fold increased protein expression ofα-synuclein (unpublished observation, NS). The accumulation of humanα -synu-clein in oligodendrocytes triggers a yet undefined cascade of events that leads to neuronal loss in SN and later on in striatum, which finally results in motor deterioration [12]. Therefore, the (PLP)-α-synuclein transgenic mouse replicates features of a progressive Parkinson variant of MSA with underlying SND and provides an excellent tool to address scientific questions focused on the early pre-symptomatic stages of MSA-like disease pathways [9;13].
Transcriptome expression analysis
–
a window to the molecular events
underlying the pathogenesis of MSA
Through transcriptome expression analysis in striatum and SN in MSA transgenic mice in a pre-motor stage of the disease we identified several major biological processes and modules with strong relevance to human MSA that appear dysfunctional in response to earlyα -synu-clein accumulation in oligodendrocytes. Our findings indicate the role of GCI-like pathology to induce early alterations in oxygen homeostasis and oxidative stress and changes in the inflammatory/immune responses in both SN and striatum relevant to candidate pathogenic mechanisms involved in human MSA [56]. Although these mechanisms are dysfunctional in both brain structures, they appear to be predominant in the SN at this stage of the MSA disease process and appear to be associated with the earlier nigral dopaminergic neuronal loss in the MSA transgenic model, supporting the notion of higher susceptibility of SN toα -synuclein-triggered oxidative stress and inflammatory dysfunction (discussed later). Furthermore, indica-tions of dysregulated oligodendroglial function, protein handling, transmembrane transport and metabolism, as well as switch in cell death mechanisms downstream ofα-synuclein accu-mulation in oligodendroglia were evident in the striatum. All these processes and pathways have previously been implicated in MSA pathogenesis based on either neuropathological find-ings or experimental studies in later symptomatic stages of the disease [1;2;59;60;62;63;71–73]. arrows indicates the degree (range -1.00–0.00) of negative correlation between miRNA-mRNA target 3’UTR interaction. Interaction arrow thickness is proportional to the number of algorithms predicting the miRNA-mRNA target 3’UTR interaction, ranging from one to four.
Fig 8. Deregulated miRNA-mRNA regulatory network in the striatum of MSA mice in pre-motor stage of disease:Modules“Transmembrane transport”(A) and“Cell death”(B). Differentially expressed miRNAs with predicted negatively correlated differentially expressed mRNA targets assigned to the indicated GO-terms (light blue rectangles) are visualized by employing Cytoscape (version 3.2.1). Round nodes designate mRNA and triangle nodes miRNA. Node size is proportional to its degree. Fold change (log2transformed) for each node is ranging from -0.75 (red) to 1 (green). The shade of blue color of the interaction arrows indicates the degree (range -1.00–0.00) of negative correlation between miRNA-mRNA target 3’UTR interaction. Interaction arrow thickness is proportional to the number of algorithms predicting the miRNA-mRNA target 3’UTR interaction, ranging from one to four.
How relevant is the transcriptome of the MSA transgenic mouse to the transcriptome in human MSA? A recent study by Mills et al. reported RNA-seq data from the grey and white matter of the frontal cortex of six MSA cases [14]. This study identified changed expression of genes related to the immune response (HLA-A,HLA-B,HLA-C,IL1RL1) and to intraneuronal oxygen homeostasis (hemoglobin complex genesHBA1,HBA2andHBB) consistent with find-ings of the current study in the transgenic MSA mouse model. The specific set of differentially expressed genes linked to altered immune response differs between both studies. This is not surprising in light of the different source of the analysed material (i.e. frontal cortex versus SN and striatum) and the stage of the disease (i.e. end-stage disease versus early onset MSA). It is encouraging, however, that both studies confirm and strengthen the role of dysfunctional immune responses in the pathogenesis of MSA even in the earlier stages of the disease. Most interestingly, both human MSA cases and the transgenic mouse model of MSA show changed gene expression of the hemoglobin protein complex. Previous studies have demonstrated the presence of hemoglobinα- andβ-chain in neurons of the rodent and human brain [74–76]. It is assumed that hemoglobin may play a role in intraneuronal oxygen homeostasis, oxidative phosphorylation, iron metabolism and nitric oxide synthesis [76]. Therefore, changes in its expression may emphasize the role of oxidative stress in neurodegeneration. In support of this hypothesis and our current findings, it was shown by Ferrer et al. that neuronal hemoglobin reduction is detected in neurons with or without inclusion pathology of AD, PD and DLB brains [77].
How similar are the pathogenic events in neuronal versus
oligodendroglial
α
-synucleinopathy: comparison of PD and MSA
pathogenesis
It is intriguing to compare the biological processes and modules involved in the pathogenesis of MSA versus PD while comparing the transcriptome analysis of striatum in MSA mice with oligodendroglial overexpression ofα-synuclein to the transcriptome analysis of striatum in PD transgenic mice with neuronal overexpression ofα-synuclein, both in a pre-manifestation phase of the disease [78]. While in the PD striatum strong gene dysregulation was associated with changes in signaling, synaptic function and post-synaptic signaling, we found MSA stria-tum to be characterized by oligodendroglial dysfunction and altered inflammatory responses. In both PD and MSA models, genes related to the regulation of lipid metabolism were affected uponSNCAoverexpression. These data support the role ofα-synuclein (of either neuronal or oligodendroglial origin) in the modulation of brain lipid turn-over as shown in human PD [79;80] and MSA [62]. Finally, regulation of apoptosis (GO:0042981) was significantly associ-ated with the disease processes in the striatum of both PD and MSA mice. However, while in PD mice the common signature was rather in the direction of pro-survival changes consistent with the absence of neuronal cell death in the striatum in PD patients, in MSA mice the pro-apoptotic patterns (up-regulation of pro-pro-apoptotic genes and down-regulation of survival genes) were dominant, thereby potentially laying the foundation for the later striatal neuronal loss characteristic for MSA.
Insights into the selective vulnerability of substantia nigra and striatum
analysis of SN and striatum of MSA transgenic mice, we identified a proportion of genes that had identical direction of changes in both brain structures, a large proportion of genes that had altered expression in one but not in the other region, and only one gene,Rps17, that showed opposite expression changes in SN versus striatum. These findings suggest that each brain region has different reactivity to a specific injury that may relate to differences in the type of neurons as well as the neuronal milieu and region-specific microenvironment in the affected areas. As proposed recently, unique combinations of subcellular components including protein translational machinery and ribosomal function may contribute to the selective vulnerability in prion-like disorders including synucleinopathies [81]. In support of this hypothesis the levels ofRps17, a ribosomal protein which is part of the protein translation machinery, was differen-tially altered in two structures with different vulnerability to oligodendroglialα -synucleinopa-thy and may define or contribute to the early loss of nigral neurons and delayed striatal neurodegeneration. Furthermore,Rps17has been associated with modulation of autophagy [82] and cell death mechanisms [83] which in turn may determine the differences in disease events in striatum versus SN. Further detailed studies will be required to precisely identify the role ofRps17related to the findings of the current study and their relevance to the different vul-nerability to oligodendroglialα-synucleinopathy in striatum and SN.
miRNAs in MSA
–
pathogenic and diagnostic role
Several reports have suggested the involvement of altered miRNA expression in the epigenetic landscape of MSA [84]. However, to this end only analysis of end-stage disease post-mortem tis-sue and of clinically manifested cases has been possible [15;85;86], while it is difficult to assess the participation of miRNA de-regulation in early human MSA. Here, using an MSA transgenic mouse model, we show that such early dysregulation indeed takes place. We identified 59 differ-entially expressed miRNAs in SN and 33 differdiffer-entially expressed miRNAs in striatum of MSA mice in a pre-motor disease stage. Among those, miR-433 showed down-regulation in the stria-tum in the early pre-motor stages of the MSA transgenic model. Interestingly, the expression of miR-433 has been previously reported to be downregulated in the cerebellum of post-mortem MSA cases [85]. Additionally, down-regulation of miR-433 expression has been observed in chil-dren with autism [87]. Considering the putative role of miR-433 in striatal neurogenesis [88], the current findings in the transgenic MSA model and its relevance to the findings in the human dis-ease strengthen the possible role of this specific candidate in the early stages of MSA neurodegen-eration. Furthermore, miR-433 is involved in the regulation of HDAC6 expression [89;90] that has been shown to co-localize withα-synuclein in GCIs in the MSA brain [91;92]. The current gene expression analysis showed unchangedHDAC6gene expression in MSA mice in the early pre-motor stage of disease. Taken together these data suggest that miR-433 expression changes in the early pre-motor stages of MSA may precede alterations ofHDAC6expression that may play an important role in the pathogenesis of the disease in its later stages.
MicroRNA dysregulation has been previously assessed in a transgenic MSA model with full onset of the pathology and in human post-mortem MSA brains [15]. Thereby, expression of miR-96 was found to be up-regulated in the later stages of disease in both the mouse model and human MSA, respectively, but our screening did not confirm significant dysregulation of miR-96 expression in striatum and SN in the early pre-symptomatic MSA model. This discrep-ancy may be related to changes in the miRNA profile with the progression of the disease that may reflect different events in the early and late stages of MSA.
strong support of our finding comes from a recent study by Fernandez-Santiago and co-work-ers [93] who identified for the first time that miR-19b down-regulation occurs in prodromal (preceding motor or cognitive symptomatology) stages of synucleinopathies. Conversely, the MSA model of established pathology described by Ubhi et al. showed significant up-regulation of miR-19b similar to end-stage MSA [15]. Taken together, these findings show that miRNA expression is variable throughout the course of the disease and that downregulation of miR-19b is a strong candidate for an early MSA marker as proposed already in a clinical trial for PD and DLB [93], while its upregulation appears to be associated with advanced disease
progression.
General miRNA-mRNA regulatory network in MSA: towards new targets
for disease modification
Direct overexpression of theα-synuclein gene in oligodendroglia of the MSA transgenic mice has been shown to trigger early oligodendroglial dysfunction related to disrupted myelination and changes in oligodendroglial differentiation relevant to the human disease [62;63]. It is interesting to note, however, that with the stringent correlation analysis of putative miRNA-mRNA interactions, we did not obtain evidence for a significant involvement of miRNAs on the modulation of genes linked to oligodendroglial dysfunction. However, at this stage and with the applied methodology it is not possible to exclude that cell-specific (i.e. neuronal versus glial) alterations associated with miRNA-mRNA interactions occur in the MSA brain.
By contrast, our data strongly suggest an involvement of a miRNA-mRNA regulatory net-work in the control of early inflammatory responses mainly linked to dysregulated phagocytic activity of macrophages that may be associated with an early deficit in the clearance ofα -synu-clein as previously suggested [23;94]. Previous neuropathological, imaging and experimental studies have confirmed the contribution of microglial activation to the MSA disease process [56;57;95], but the understanding of its progression and participation in the various stages of the disease is yet unclear. Due to the lacking insights into the mechanisms of neuroinflamma-tory control in MSA, most of the therapeutic strategies targeting neuroinflammation in MSA (similar to other neurodegenerative disorders) to date fail to exert functional benefit in spite of the successful suppression of microglial activation [96;97]. It will be interesting to see in the future, if the predicted involvement of miRNA regulation can be confirmed, which would open the field to pursue new candidate treatment targets to support the clearance ofα-synuclein in MSA through microglia.
Further putative miRNA-mRNA networks were predicted by our data set in relation to pro-cesses such as protein handling, transmembrane transport and cell death. Some of these propro-cesses have previously been linked to human MSA thus encouraging further elucidation. For instance, involvement of HSP70 and HSP90 in the formation of GCIs was suggested by earlier neuropatho-logical studies [98;99], and it will be relevant to identify to what extent putative miRNA-mRNA interactions linked to the expression ofHspa5andHsp90ab1, respectively, may direct the disease process andα-synuclein processing in MSA. We also identified several miRNA-mRNA candidate networks that may contribute to the neurodegeneration in the MSA mouse brain but have not been linked to this process before (e.g. controlling calcium transport in the striatum (Cacnb4, Ryr2)). These might be interesting targets for future neuropathological studies.
Limitations, clinical relevance and conclusions
MSA (MSA-P). The etiopathogenesis of human MSA is poorly understood to date, and it is unclear what triggersα-synuclein accumulation in oligodendrocytes of human MSA or how long before the clinical onset this process occurs. One apparent limitation of the currently used mouse model of MSA is the fact that the transgenic MSA mouse replicates GCI pathology by forced overexpression ofSNCAin oligodendroglia. Current prion-like propagation studies of
α-synuclein claim MSA to be the next prion disease [100;101]. However, none of these propa-gation studies has been able to generate wide-spread GCI pathology, suggesting that the mech-anism of prion-like spreading may be relavent to MSA pathogenesis/progression at a later stage of the disease, but needs a specific yet unknown trigger forα-synuclein accumulation in oligodendroglia. Changed expression ofSNCAin MSA oligodendrocytes as recently suggested [7] may provide such a trigger. Therefore, even though the trigger for GCI formation is obvi-ously different between the human disease and the mouse model, the downstream events may very well be similar rendering our findings relevant to the understanding of the human disease mechanism. A limitation of our analysis is the fact that the identified changes in mRNA and miRNA expression in SN and striatum cannot be attributed to a specific cell type in the affected regions with the current methodological approach, but may give directions for further studies. The current experiments give directions towards the major biological processes and functions that may be under miRNA-mRNA network conrol in the early MSA pathogenesis, however further in-depth functional studies will need to address selected miRNA/mRNA candidates to specifically define their role in the disease process. Based on the current screening we confirm the role of changes in the immunological/inflammatory responses as well as oxidative stress even in the very early pre-motor stages of MSA. Other mechanisms related to human MSA like oligodendroglial dysfunction, lipid metabolism, and protein handling were confimed in the PLP-α-synuclein mouse model and point towards early transcriptome de-regulation that may trigger MSA deficits and pathology in the early stages of the disease. Unravelling the early events in the pathogenic cascade of MSA may provide an important step toward identifying early disease markers in at risk cohorts of patients and candidate therapeutic targets for this devastating disease.
Supporting Information
S1 Fig. (A) Overview of the experimental set-up. (B) Overlap of differentially expressed mRNAs resulting from microarray and RNA-seq analysis in SN. (C) To provide verification of the expression analysis defined by the two different methods we performed correlation analysis as demonstrated in a bladaltmanplot of the differences plotted against the averages of the two measurements (mRNA measured with RNA-seq (DESeqFC) and mRNA measured with microarray (ChipFC)). Horizontal lines are drawn at the mean difference, and at the limits of agreement, which are defined as the mean difference plus and minus 1.2 times the standard deviation of the differences, indicating that on an average the agreement between the two tech-niques is quite good. X-axis: mean of the both techtech-niques; Y-axis: difference between the 2 val-ues. (D) Heatmap shows mean fold changes (log2transformed) of differentially expressed
mRNAs in SN as identified by microarray and RNA-seq analysis. The color gradient shows positive and negative log2transformed fold changes in orange and blue color, respectively. (E)
KEGG pathway analysis of deregulated mRNAs in striatum of MSA mice in a pre-motor stage of the disease. (F) KEGG pathway analysis of deregulated mRNAs in SN of MSA mice in a pre-motor stage of the disease. Color code represents the significance (p-value) of the KEGG path-way enrichment. Length of the bars corresponds to the number of differentially expressed genes linked to each pathway.
S2 Fig. Up-regulated miRNAs (right) and down-regulated miRNAs (left) in SN of MSA mice with the number of their predicted deregulated targets (expressed by blue color gradi-ent).Predicted targets were assigned to enriched GO-terms (indicated at the bottom).
(JPG)
S3 Fig. Up-regulated miRNAs (right) and down-regulated miRNAs (left) in striatum of MSA mice with the number of their predicted deregulated targets (expressed by blue color gradient).Predicted targets were assigned to enriched GO-terms.
(JPG)
S4 Fig. Real-time PCR verification of RNA-seq and microarray data for representative mRNAs in striatum and substantia nigra (SN).
(JPG)
S5 Fig. Real-time PCR validation of the data for representative mRNA-miRNA predicted pairs in the striatum.
(JPG)
S1 Table. List of primers used for RT-PCR analysis.
(DOCX)
S2 Table. List of differentially expressed mRNAs in the striatum of MSA mice in a pre-motor stage of the disease.
(XLSX)
S3 Table. List of differentially expressed mRNAs in the SN of MSA mice in a pre-motor stage of the disease.
(XLSX)
S4 Table. List of enriched GO terms linked to differentially expressed mRNAs in the stria-tum of MSA mice in a pre-motor stage of the disease.
(XLSX)
S5 Table. Clusters of GO biological processes and corresponding deregulated mRNAs in striatum relevant to human MSA defined by REVIGO analysis.
(XLSX)
S6 Table. List of enriched GO terms linked to differentially expressed mRNAs in the SN of MSA mice in a pre-motor stage of the disease.
(XLSX)
S7 Table. Clusters of GO biological processes and corresponding deregulated mRNAs in substantia nigra relevant to human MSA defined by REVIGO analysis.
(XLSX)
S8 Table. List of differentially expressed miRNAs in the striatum of MSA mice in a pre-motor stage of the disease.
(XLSX)
S9 Table. List of differentially expressed miRNAs in the SN of MSA mice in a pre-motor stage of the disease.
(XLSX)
programs, or (iii) feature a validated target gene. In all cases, a minimum correlation value of -0.3 was required.
(XLSX)
Acknowledgments
The authors are grateful to Martina Hölzl and Karin Spiss for the excellent technical assistence.
Author Contributions
Conceived and designed the experiments: NS GKW AL AH PP RG. Performed the experi-ments: SS RK VR SV ES PP CH RG RK NS. Analyzed the data: SS RK VR SV ES CH HH RK MW AK AL WP GKW AH NS. Contributed reagents/materials/analysis tools: NS GKW AL AH. Wrote the paper: SS RK VR SV ES PP CH HH RK RG MW AK AL WP GKW AH NS.
References
1. Fanciulli A, Wenning GK. Multiple-system atrophy. N Engl J Med 2015; 372:249–263. doi:10.1056/ NEJMra1311488PMID:25587949
2. Stefanova N, Bucke P, Duerr S, Wenning GK. Multiple system atrophy: an update. Lancet Neurol 2009; 8:1172–1178. doi:10.1016/S1474-4422(09)70288-1PMID:19909915
3. Papp MI, Kahn JE, Lantos PL. Glial cytoplasmic inclusions in the CNS of patients with multiple system atrophy (striatonigral degeneration, olivopontocerebellar atrophy and Shy-Drager syndrome). J Neu-rol Sci 1989; 94:79–100. PMID:2559165
4. Wakabayashi K, Yoshimoto M, Tsuji S, Takahashi H. Alpha-synuclein immunoreactivity in glial cyto-plasmic inclusions in multiple system atrophy. Neurosci Lett 1998; 249:180–182. PMID:9682846
5. Spillantini MG, Crowther RA, Jakes R, Cairns NJ, Lantos PL, Goedert M. Filamentous alpha-synuclein inclusions link multiple system atrophy with Parkinson's disease and dementia with Lewy bodies. Neurosci Lett 1998; 251:205–208. PMID:9726379
6. Wenning GK, Stefanova N, Jellinger KA, Poewe W, Schlossmacher MG. Multiple system atrophy: a primary oligodendrogliopathy. Ann Neurol 2008; 64:239–246. doi:10.1002/ana.21465PMID: 18825660
7. Asi YT, Simpson JE, Heath PR, Wharton SB, Lees AJ, Revesz T et al. Alpha-synuclein mRNA expres-sion in oligodendrocytes in MSA. Glia 2014; 62:964–970. doi:10.1002/glia.22653PMID:24590631
8. Djelloul M, Holmqvist S, Boza-Serrano A, Azevedo C, Yeung MS, Goldwurm S et al. Alpha-Synuclein Expression in the Oligodendrocyte Lineage: an In Vitro and In Vivo Study Using Rodent and Human Models. Stem Cell Reports 2015; 5:174–184. doi:10.1016/j.stemcr.2015.07.002PMID:26235891
9. Stefanova N, Wenning GK. Animal models of multiple system atrophy. Clin Auton Res 2015; 25:9–17. doi:10.1007/s10286-014-0266-6PMID:25585910
10. Kahle PJ, Neumann M, Ozmen L, Muller V, Jacobsen H, Spooren W et al. Hyperphosphorylation and insolubility of alpha-synuclein in transgenic mouse oligodendrocytes. EMBO Rep 2002; 3:583–588. PMID:12034752
11. Stefanova N, Reindl M, Neumann M, Kahle PJ, Poewe W, Wenning GK. Microglial activation medi-ates neurodegeneration related to oligodendroglial alpha-synucleinopathy: Implications for multiple system atrophy. Mov Disord 2007; 22:2196–2203. PMID:17853477
12. Stefanova N, Kuen J, Borm C, Poewe W, Wenning GK. Progressive MSA-like motor deficits in the PLP-ha-synuclein transgenic mouse model; 2013, p S359.
13. Stefanova N, Kuen J, Borm C, Poewe W, Wenning GK. Age-related analysis of striatonigral degenera-tion and olivopontocerebellar atrophy in the PLP-a-synuclein transgenic mouse model of MSA; 2014, p S32.
14. Mills JD, Kim WS, Halliday GM, Janitz M. Transcriptome analysis of grey and white matter cortical tis-sue in multiple system atrophy. Neurogenetics 2015; 16:107–122. doi:10.1007/s10048-014-0430-0 PMID:25370810
16. Mattick JS. Challenging the dogma: the hidden layer of non-protein-coding RNAs in complex organ-isms. Bioessays 2003; 25:930–939. PMID:14505360
17. Rother S, Meister G. Small RNAs derived from longer non-coding RNAs. Biochimie 2011; 93:1905–
1915. doi:10.1016/j.biochi.2011.07.032PMID:21843590
18. Sala FC, Lau P, Salta E, Tournoy J, Bossers K, Vandenberghe R et al. Reduced expression of hsa-miR-27a-3p in CSF of patients with Alzheimer disease. Neurology 2013; 81:2103–2106. doi:10.1212/ 01.wnl.0000437306.37850.22PMID:24212398
19. Santa-Maria I, Alaniz ME, Renwick N, Cela C, Fulga TA, Van VD et al. Dysregulation of microRNA-219 promotes neurodegeneration through post-transcriptional regulation of tau. J Clin Invest 2015; 125:681–686. doi:10.1172/JCI78421PMID:25574843
20. Kocerha J, Xu Y, Prucha MS, Zhao D, Chan AW. microRNA-128a dysregulation in transgenic Hun-tington's disease monkeys. Mol Brain 2014; 7:46. doi:10.1186/1756-6606-7-46PMID:24929669
21. Serafin A, Foco L, Zanigni S, Blankenburg H, Picard A, Zanon A et al. Overexpression of blood micro-RNAs 103a, 30b, and 29a in L-dopa-treated patients with PD. Neurology 2015; 84:645–653. doi:10. 1212/WNL.0000000000001258PMID:25596505
22. Stemberger S, Poewe W, Wenning GK, Stefanova N. Targeted overexpression of human alpha-synu-clein in oligodendroglia induces lesions linked to MSA -like progressive autonomic failure. Exp Neurol 2010; 224:459–464. doi:10.1016/j.expneurol.2010.05.008PMID:20493840
23. Stefanova N, Fellner L, Reindl M, Masliah E, Poewe W, Wenning GK. Toll-like receptor 4 promotes alpha-synuclein clearance and survival of nigral dopaminergic neurons. Am J Pathol 2011; 179:954–
963. doi:10.1016/j.ajpath.2011.04.013PMID:21801874
24. Stefanova N, Reindl M, Neumann M, Haass C, Poewe W, Kahle PJ et al. Oxidative stress in trans-genic mice with oligodendroglial alpha-synuclein overexpression replicates the characteristic neuro-pathology of multiple system atrophy. Am J Pathol 2005; 166:869–876. PMID:15743798
25. Fernagut PO, Diguet E, Bioulac B, Tison F. MPTP potentiates 3-nitropropionic acid-induced striatal damage in mice: reference to striatonigral degeneration. Exp Neurol 2004; 185:47–62. PMID: 14697318
26. Ghorayeb I, Fernagut PO, Aubert I, Bezard E, Poewe W, Wenning GK et al. Toward a primate model of L-dopa-unresponsive parkinsonism mimicking striatonigral degeneration. Mov Disord 2000; 15:531–536. PMID:10830420
27. Amende I, Kale A, McCue S, Glazier S, Morgan JP, Hampton TG. Gait dynamics in mouse models of Parkinson's disease and Huntington's disease. J Neuroeng Rehabil 2005; 2:20. PMID:16042805
28. Stefanova N, Kaufmann WA, Humpel C, Poewe W, Wenning GK. Systemic proteasome inhibition trig-gers neurodegeneration in a transgenic mouse model expressing human alpha-synuclein under oligo-dendrocyte promoter: implications for multiple system atrophy. Acta Neuropathol 2012; 124:51–65. doi:10.1007/s00401-012-0977-5PMID:22491959
29. Sanchez-Guajardo V, Febbraro F, Kirik D, Romero-Ramos M. Microglia acquire distinct activation pro-files depending on the degree of alpha-synuclein neuropathology in a rAAV based model of Parkin-son's disease. PLoS One 2010; 5:e8784. doi:10.1371/journal.pone.0008784PMID:20098715
30. Stefanova N, Georgievska B, Eriksson H, Poewe W, Wenning GK. Myeloperoxidase inhibition amelio-rates multiple system atrophy-like degeneration in a transgenic mouse model. Neurotox Res 2012; 21:393–404. doi:10.1007/s12640-011-9294-3PMID:22161470
31. Bolstad BM, Irizarry RA, Astrand M, Speed TP. A comparison of normalization methods for high den-sity oligonucleotide array data based on variance and bias. Bioinformatics 2003; 19:185–193. PMID: 12538238
32. Carvalho BS, Irizarry RA. A framework for oligonucleotide microarray preprocessing. Bioinformatics 2010; 26:2363–2367. doi:10.1093/bioinformatics/btq431PMID:20688976
33. Martin M. Cutadapt removes adapter sequences from high-throughput sequencing reads. EMBnet Journal 2011;17.
34. Dobin A, Davis CA, Schlesinger F, Drenkow J, Zaleski C, Jha S et al. STAR: ultrafast universal RNA-seq aligner. Bioinformatics 2013; 29:15–21. doi:10.1093/bioinformatics/bts635PMID:23104886
35. Langmead B, Salzberg SL. Fast gapped-read alignment with Bowtie 2. Nat Methods 2012; 9:357–
359. doi:10.1038/nmeth.1923PMID:22388286
36. Anders S, Pyl PT, Huber W. HTSeq—a Python framework to work with high-throughput sequencing data. Bioinformatics 2015; 31:166–169. doi:10.1093/bioinformatics/btu638PMID:25260700