In silico
evaluation of the
Eucalyptus
transcriptome
Renato Vicentini
1, Flávio T. Sassaki
3, Marcos A. Gimenes
3, Ivan G. Maia
3and Marcelo Menossi
1,21
Universidade Estadual de Campinas, Centro de Biologia Molecular e Engenharia Genética,
Campinas, SP, Brazil.
2Universidade Estadual de Campinas, Instituto de Biologia, Departamento de Genética e Evolução,
Campinas, SP, Brazil.
3
Universidade Estadual Paulista ‘Júlio de Mesquita Filho’, Instituto de Biociências,
Departamento de Genética, Botucatu, SP, Brazil.
Abstract
The expressed sequence tags (ESTs) produced in the Forests project provide an invaluable opportunity to assess theEucalyptus transcriptome. Besides providing information on the different proteins produced by this plant, it is possible to infer gene expression profiles because non-normalized cDNA libraries were used. The EST frequency from any gene is correlated to the transcript levels in the tissues from which the cDNA libraries were constructed. The goal of this work was to identify Eucalyptus genes that showed either differential expression pattern or were ubiquitously expressed in the tissues sampled in the Forests project. Six robust statistical tests and very restrictive rules were applied to gain confidence in the in silico data aiming to avoid false positives. Several genes with interesting expression profiles were identified and some of them were validated by RT-PCR.
Key words:transcriptome,Eucalyptus, tissue-specific, statistics, differential expression.
Received: May 28, 2004; Accepted: November 29, 2004.
Introduction
Expressed sequence tags (ESTs) projects are a pow-erful strategy to discover genes and also to assess their ex-pression profiles. The abundance of ESTs in a cDNA library reflects the expression levels in the tissues used to extract the RNA (Okuboet al., 1992). The estimation of gene expression levels using the frequency of gene tran-scripts in non-normalized cDNA libraries has been done in several species, such as rice (Ewing et al., 1999), Medicago truncatula (Journet et al, 2002), sugarcane (Falcoet al., 2001) andSchistosoma mansoni(Francoet al., 1997).
As in any genomic approach, gene expression profil-ing usprofil-ing EST countprofil-ing produces a large amount of data. The use of robust statistical tests is essential in the identifi-cation of differentially expressed genes in EST projects. In the past few years several statistical approaches have been described (Audic and Claverie, 1997; Stekelet al., 2000; Greller and Tobin, 1999; Romualdiet al., 2001).
The extensive representation of the Eucalyptus transcriptome in the Forests database is a rich resource
for several studies, including the discovery of genes ex-hibiting tissue-specific or ubiquitous expression. This is, for example, a first step towards the cloning of promoters that can be used for biotechnological purposes. Most transgenic plants obtained so far use the 35S promoter, which is expressed in most cell types. In the majority of cases, the use of promoters with specific expression pat-terns is desirable either to avoid the waste of energy pro-ducing proteins of interest in cells that are not relevant or to avoid metabolic dysfunctions. A good example of this approach is the expression of a transcription factor under the control of a stress-inducible promoter in transgenic tomato plants (Leeet al., 2003) which resulted in normal plants with increased tolerance to drought. In contrast, plants expressing the same gene under the control of the contitutive 35S promoter were also drought tolerant, but had a dwarf phenotype and reduced fruit set (Hsiehet al., 2002).
In this work, we used anin silicoapproach to identify genes fromEucalyptuspresenting differential expression in the tissues sampled in the Forests project. A set of six statis-tical tests was applied and several candidate genes were found. Thein silicoapproach was validated by RT-PCR for selected genes and a searchable database containing all the results was built.
www.sbg.org.br
Send correspondence to Marcelo Menossi. Universidade Estadual de Campinas, Instituto de Biologia, Departamento de Genética e Evolução, Caixa Postal 6010, 13083-875 Campinas, SP, Brazil. E-mail: [email protected].
Materials and Methods
cDNA libraries and pools
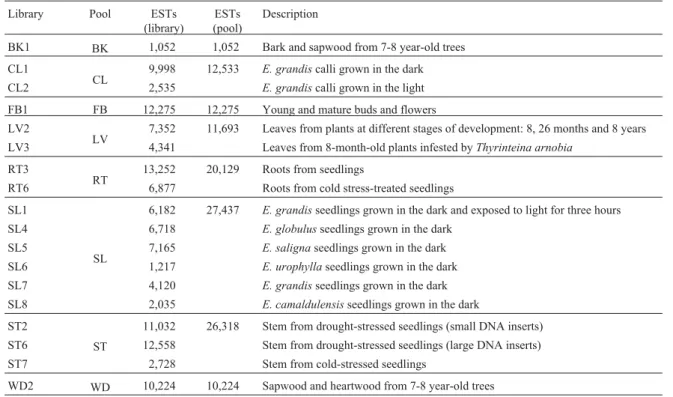
EST data generated by the Forests consortium (https://forests.esalq.usp.br/) were taken from 18 libraries: BK1, CL1, CL2, FB1, LV2, LV3, RT3, RT6, SL1, SL4, SL5, SL6, SL7, SL8, ST2, ST6, ST7 and WD2 (see Table 1). Libraries representing the same organs or plant parts were grouped in eight pools: BK (only BK1), CL (CL1 and CL2), FB (FB1), LV (LV2 and LV3), RT (RT3, RT6), SL (SL1, SL4, SL5, SL6, SL7 and SL8), ST (ST2, ST6 and ST7) and WD (only WD2).
Identification of gene expression patterns
To compare the expression level in different libraries, the data were normalized by the number of reads in each li-brary. The IDEG.6 software (Romualdiet al., 2001) was used to calculate the values of six different statistical tests aiming to identify differentially expressed genes in multi-ple tag sampling experiments. The AC, R and GT statistics (Audic and Claverie, 1997; Stekelet al., 2000; Greller and Tobin, 1999), the Fisher’s 2X2 exact test, the 2X2c2test and generalc2test were applied on the Forests data. Three of these statistical tests (Fisher 2X2, 2X2c2and AC) are pair wise tests and the estimated gene expression levels are compared between two libraries or pools. The other three are multicomparison statistical tests and allow the simulta-neous comparison of all libraries or pools. The analyses were performed with scripts developed in the Perl program-ming language. A web-based searchable database is avail-able at https://ipe.cbmeg.unicamp.br.
The identification of library- and pool-specific genes was based upon two rules: A) the cluster must have reads from only one library or pool; B) all statistical tests must have a significance threshold of at least 0.05. Preferentially expressed genes were considered as those having reads from more than one library or pool. The library or pool with the highest number of reads must have statistically different results from all others, considering a 0.05 threshold. To identify ubiquitously expressed genes we considered only those clusters with at least one read from every library. In this case, all statistical tests must have non-significant re-sults.
Gene expression validation
Thein silicoexpression pattern of selected ESTs was validated by reverse transcription-PCR (RT-PCR). Total RNA was extracted from leaf, stem, flower, fruit and root tissues ofEucalyptus grandisas described by Korimbocus et al., (2002) with minor modifications. RNA was treated with DNase I at 37 °C for 15 min prior to use. Tenmg of to-tal RNA was reverse transcribed using oligo (dT)20and Su-perscript II (Invitrogen, USA) according to the manufacturer’s instructions. An aliquot of twomL from the
first-strand cDNA synthesis reaction was used for PCR am-plification using gene-specific primers: 5’ ACCACGAGC TCAAGGTCAAG 3’ and 5’ CTTCTCGTTCACACCCAC AA 3’ (cluster EGEQFB1001C06.g), 5’ TTTGGGGAA CAACTGGAGAG 3’ and 5’ CCATCAGAAACAGCAAAG CA 3’ (EGEQRT3002E03.g), 5’ TCTCTCGCCTTGTTG GTCTT 3’ and 5’ CTGGCCCTGGAACAGAGTTA 3’ (EGACFB1015B10.g), 5’ GGCATGTTCTGTGCATCA TC 3’ and 5’ ACCACCAGCACCTTTCCTTC 3’ (EGA GLV2214H10.g), 5’ CGTCTCAATTCAACGCACAC 3’ and 5’ CCTCCAGAACGAAGCATACC 3’ (EGABST22 22G06.g), 5’ AAGGGCTCGATAGGGATCAT 3’ and 5’ GCGTAGGACCCGATGAAGAT 3’ (EGEPRT3362H 10.g), 5’ GAACCCTCCCCAGTAAATGC 3’ and 5’ GC CACACAGAGAGCCAAAGT 3’ (EGABSL1082B12.g). Samples were heated to 94 °C for 3 min and the amplifica-tion was done for 30 and 35 cycles at 94 °C for 30 s, 65 °C for 45 s and 72 °C for 1 min, followed by a final extension at 72 °C for 10 min. Primers based on an EST encoding a glyceraldehyde-3-phosphate dehydrogenase (GAPDH) were used as an internal control for RNA integrity and equal loading. PCR products were electrophoresed on 1% agarose gels containing ethidium bromide and visualized under UV radiation.
Results and Discussion
In silicoanalyses
A total of 112,857 ESTs from the Forests project were used to infer gene expression patterns in several tissues fromEucalyptus. Expression profiles were evaluated con-sidering either each library individually or eight pools where libraries from similar tissues/organs were grouped (Table 1).
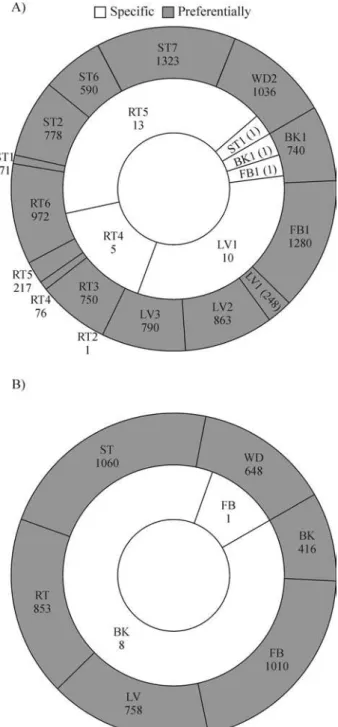
We were interested in the identification of genes that were specifically or preferentially expressed in a particular library or pool, or in those expressed all over theEucalyptus tissues sampled in the Forests project. A simple approach to identify such genes is to search for clusters containing reads that are exclusive or mainly present in a particular library. However, this approach does not have a statistical valida-tion and will produce a high number of false positives.
To avoid false positives three statistical methods were used in pair wise comparison and another three to compare all samples at the same time. Only the genes that presented significant threshold (p < 0.05) in all statistical tests were considered.
the same tissues/organs taken from different species or grown in slightly different conditions. On the other hand, the small number of genes specific to a library or pool indi-cates that most genes are expressed in more than one cell type. It is worth noting that the four genes considered spe-cific to the SL1 library were not considered spespe-cific to the
SL pool (Figure 1). This can be understood if we take into account that pools are made from libraries, and conse-quently the number of elements in each pool is much higher than the number found in each library. So the frequency of ESTs in any particular cluster might drop to a level closer to values expected by chance. As a consequence, the number Table 1- Description of the FOREST libraries andin silicopools.
Library Pool ESTs
(library)
ESTs (pool)
Description
BK1 BK 1,052 1,052 Bark and sapwood from 7-8 year-old trees
CL1
CL 9,998 12,533 E. grandiscalli grown in the dark
CL2 2,535 E. grandiscalli grown in the light
FB1 FB 12,275 12,275 Young and mature buds and flowers
LV2
LV 7,352 11,693 Leaves from plants at different stages of development: 8, 26 months and 8 years
LV3 4,341 Leaves from 8-month-old plants infested byThyrinteina arnobia
RT3
RT 13,252 20,129 Roots from seedlings
RT6 6,877 Roots from cold stress-treated seedlings
SL1
SL
6,182 27,437 E. grandisseedlings grown in the dark and exposed to light for three hours
SL4 6,718 E. globulusseedlings grown in the dark
SL5 7,165 E. salignaseedlings grown in the dark
SL6 1,217 E. urophyllaseedlings grown in the dark
SL7 4,120 E. grandisseedlings grown in the dark
SL8 2,035 E. camaldulensisseedlings grown in the dark
ST2
ST
11,032 26,318 Stem from drought-stressed seedlings (small DNA inserts)
ST6 12,558 Stem from drought-stressed seedlings (large DNA inserts)
ST7 2,728 Stem from cold-stressed seedlings
WD2 WD 10,224 10,224 Sapwood and heartwood from 7-8 year-old trees
of genes with significant statistical differences in the analy-sis of pools is smaller compared with the analyanaly-sis of librar-ies.
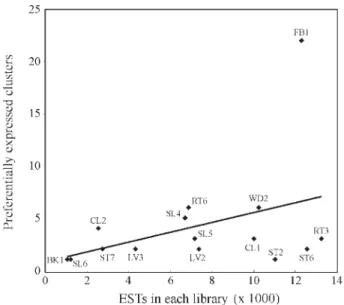
The number of reads in each library ranged from 1052 (BK1) to 13,252 (RT3) and had no clear correlation with the number of genes with differential expression pattern (Figure 2). This result prompted us to speculate that above a certain threshold of ESTs per library, no significant change in the number of differentially expressed genes is observed. A striking difference was observed for FB1 library, corre-sponding to flowers, flower buds and fruits, which had the highest number of differentially expressed genes. The
pres-ence of a high number of genes preferentially expressed in flower tissues was also observed in silico in sugarcane (Figueiredoet al., 2001), indicating that this organ has spe-cial features that require a wide range of protein functions.
The library- and/or pool-specific genes are shown in Table 2. No predominance of any particular protein class could be observed, except for two cytochrome P450. It is interesting to note that five genes encode proteins with un-known function. The normalized expression levels of most clusters (considering the number of ESTs at 10,000) were around 19 and a few clusters had 6-8 ESTs per 10,000 ESTs. The highest value was observed for cluster EGEQ FB1201B08.g, with a normalized expression of 43. This gene encodes a protein with high similarity to two cytochrome P450-dependent enzymes that were induced by wounding in peas (Franket al., 1996) and by elicitors in soybeans (Schopfer and Ebel, 1998), making the gene an attractive target for further studies. Moreover, the expres-sion value based in EST counting can be used to infer the strength of the corresponding promoters. However, it is worth noting that some genes may be subject to posttranscriptional regulation, altering mRNA stability, for example, which would mask the results. In the case of genes with low expression levels, a strategy to increase the transcriptional activity without losing the expression pat-tern is to use multiple copies of the promoter, as observed in the stress inducible HAV22 promoter from barley (Leeet al., 2003).
Due to the high number of genes that had preferential expression in libraries or pools, only the most expressed ones (per library or pool) are shown (Table 3). The range of normalized expression varied from 5 to 31 (mean of 11) in libraries and from 1.8 to 31 (mean 4.24) in pools. No pre-dominance of any type of protein could be observed. Sur-Figure 2- Distribution ofEucalyptusgenes with preferential expression.
Each point represents the number of genes with preferential expression in each cDNA library. Libraries are indicated by a three-character code, as described in Table 1. The line represents the regression of the data.
Table 2- Library- and pool-specific clusters. The number of ESTs in each cluster and the normalized expression (corrected for 10,000 ESTs per library)
are indicated. The best hit protein was identified by Blast using a threshold E-values of£e-5(Altshulet al., 1997). The p-value indicates the highest
threshold observed in the different statistical tests.
Cluster Library or pool ESTs Normalized expression Best hit protein p-value
EGEQBK1114A01.g BK 3 28.52 unknown 0.001
EGEQBK1002H06.g 2 19.01 cytochrome P450 0.01
EGEQBK1086G10.g 2 19.01 no hit 0.01
EGEQBK1088F04.g 2 19.01 tonB-dependent receptor 0.01
EGEQBK1500C09.g 2 19.01 transglutaminase-like enzymes 0.01
EGJMBK1144B02.g 2 19.01 glutaredoxin family protein 0.01
EGUTBK1007E12.g 2 19.01 putative p23 co-chaperone 0.01
EGUTBK1011F06.g 2 19.01 putative sugar transporter 0.01
EGEQFB1201B08.g FB1 53 43.18 cytochrome P450 0.00001
EGBMSL1091A09.g SL1 5 8.09 putative protein kinase 0.01
EGEQSL1055F04.g 5 8.09 no hit 0.01
EGABSL1068F03.g 4 6.47 putative protein 0.05
prisingly, one cluster encoding a putative ubiquitin (EGC CRT6008F08.g) preferentially expressed in roots was found.
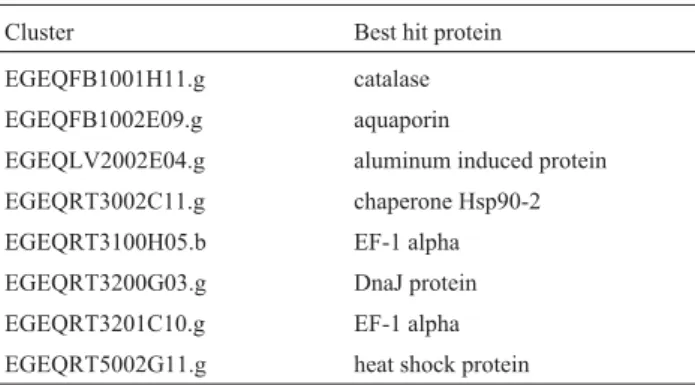
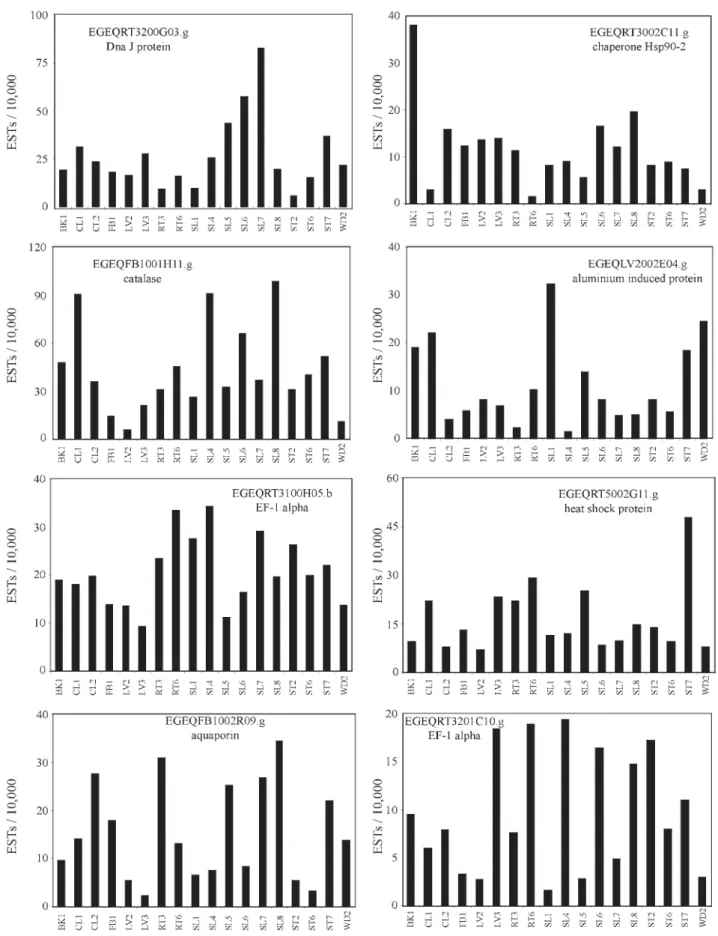
Genes that are expressed in most tissues are good tar-gets to clone ubiquitous promoters that can be useful in some applications. The selection of ubiquitous candidates was based in two assumptions: the cluster must have reads in every library and no significant statistical difference should be detected among any comparison. Eight clusters were in agreement with these conditions (Table 4). Thein silicoexpression pattern of these genes is shown in Fig-ure 3. Two of them, EGEQRT3100H05.b and EGEQRT 3201C10.g, encode proteins with similarity to the alpha subunit of the translation elongation factor 1, which is en-coded by well-known ubiquitously expressed genes.
In these in silico analyses, multiple statistical tests and very restrictive rules were applied to avoid false positives. We are aware that many false negatives will be present, leaving open the possibility that several other genes represented in the Forests database probably have in-teresting expression patterns when less restrictive parame-ters are applied. That was the case when libraries CL (callus) and SL (seedlings) were not considered in the anal-yses and the same rules as described above were applied. Since both libraries are a mixture of tissues, they are redun-dant to other cDNA libraries. The consequence is that sev-eral genes specific or preferentially expressed in a library made from a particular tissue or organ would not be consid-ered in the analyses if they were also found in CL or SL li-braries.
The effects of ignoring these two libraries were clear: the number of genes specifically or preferentially expressed in one library increased from 5 to 31 and from 63 to 9,735, respectively (Figure 4). The genes specific to a particular pool were unchanged, whereas the total number of genes preferentially expressed in a particular pool increased to 4,745. The description of these genes can be found in the supplementary material web page at http://ipe.cbmeg. unicamp.br/pub/sup/. These findings indicate that for any particular goal, it is important to carefully set the parame-ters to assess the genes with useful expression patterns. Considering that all the data from this work is stored in a searchable, web-based database, any particular task can be easily done.
Table 3- Clusters preferentially expressed in libraries or pools. The number of ESTs in each cluster and the normalized expression (corrected for 10,000 ESTs per library) are indicated. The best hit protein was identified by Blast using a threshold E-values of£e-5(Altshulet al., 1997). The p-value indicates
the highest threshold observed in the different statistical tests.
Cluster Library or
pool
ESTs Normalized
expression
Best hit protein p-value
EGBMCL1290G11.g CL 14 11.17 transferase family protein 0.0001
EGBMCL1290E03.g CL1 7 7.00 seven transmembrane MLO family protein 0.0001
EGJMCL2028D04.g CL2 4 15.78 lysine and histidine specific transporter 0.0001
EGCEFB1021A04.g FB1 and FB 38 30.96 No hit 0.00001
EGEQLV2201B04.g LV 10 8.55 auxin-binding protein 0.00001
EGCCLV2224H06.g LV2 7 9.52 early light-inducible protein 0.0001
EGSBLV3292G03.g LV3 6 13.82 catechol O-methyltransferase 0.001
EGEQRT3301H05.g RT3 and RT 12 9.06 oxidoreductase 0.00001
EGCCRT6008F08.g RT6 6 8.72 ubiquitin 0.01
EGEPSL4227F09.g SL4 and SL 9 13.40 alkaline alpha galactosidaseII 0.0001
EGCBSL5004B06.g SL5 5 6.98 acetyltransferase 0.05
EGUTSL6223C07.g SL6 3 24.65 putative cinnamyl-alcohol dehydrogenase 0.00001
EGCEST2257B10.g ST2 6 5.44 putative arm repeat protein 0.01
EGJMST6256E09.g ST6 and ST 7 5.57 putative trypanothione-dependent peroxidase 0.01
EGRFST7254A06.g ST7 4 14.66 sulfate transporter 0.00001
EGEQWD2247D05.g WD2 and WD 17 16.63 dioxygenase-related 0.00001
Table 4 - Ubiquitously expressed clusters. The best hit protein was
identified by Blast using a threshold E-values of£e-5 (Altshulet al.,
1997).
Cluster Best hit protein
EGEQFB1001H11.g catalase
EGEQFB1002E09.g aquaporin
EGEQLV2002E04.g aluminum induced protein
EGEQRT3002C11.g chaperone Hsp90-2
EGEQRT3100H05.b EF-1 alpha
EGEQRT3200G03.g DnaJ protein
EGEQRT3201C10.g EF-1 alpha
Validation of thein silicoexpression pattern
The expression profile of selected genes was evalu-ated by semi-quantitative RT-PCR using total RNA ex-tracted from leaf (organ used in LV libraries), stem (ST libraries), flower and fruit (both in the FB1 library, that also
had flower buds) and root tissues (RT libraries) of Eucalyp-tus grandis.
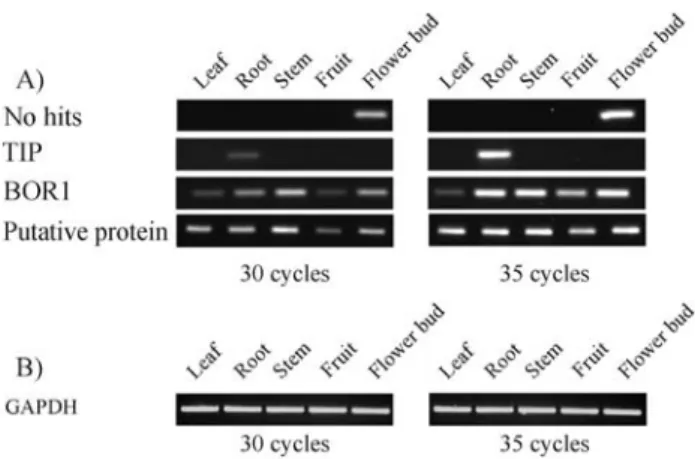
According to thein silicotests, the cluster EGACFB 1015B10.g had preferential expression in the FB library and the FB pool. The expression profile found by RT-PCR confirmed the in silicodata, and the corresponding tran-scripts were detected only in flower buds (Figure 5A). Curi-ously, this gene was not expressed in fruits, an organ that was also sampled in the FB library. This gene encodes a pu-tative protein that probably represents a novelEucalyptus gene since it presented no similarity to database entries.
Cluster EGEPRT3362H10.g encodes a polypeptide with high similarity to TIPs (tonoplast intrinsic proteins) and had reads both in RT and SL pools. Although in these two pools an identical estimated expression level of the Eu-calyptus TIPgene was observed, a homologous gene from maize presents a root-specific expression (Lopez et al., 2004). Based on this finding, we decided to check whether theTIPgene corresponded to a false negative in thein silico analyses. The RT-PCR evaluation showed thatTIP tran-scripts were detected only in roots, confirming our suspi-cion (Figure 5A). As stated above, since the in silico approach was designed to prevent false positives, a large number of false negatives should be expected. This high-lights the hypothesis that several genes not considered as specific or preferential in this study may have interesting expression patterns.
The deduced protein from cluster EGEQRT3002 E03.g had significant similarity to BOR1, an efflux-type boron transporter for xylem loading in Arabidopsis thaliana(Takanoet al., 2002). TheEucalyptus BOR1gene presented four reads from the RT pool and one read from the CL pool (data not shown). By simple EST counting, this cluster might be considered as preferentially expressed in roots although our statistical tests did not support this infer-ence. In agreement with the statistical test, the RT-PCR as-say supported the hypothesis that this gene was not preferentially expressed in roots. Although expressed in roots, similar levels of transcripts were also observed in other organs (Figure 5A) as reported for the A. thaliana BOR1gene, which is expressed in roots and shoots (Takano et al., 2002). The possible expression of the Eucalyptus BOR-1in undifferentiated tissues could therefore explain the observed expression pattern.
Cluster EGABSL1082B12.g also displayed no spe-cific or preferential expression in the RT-PCR assay (Fig-ure 5A). This cluster, encoding a putative protein, was enriched in reads from pool SL but was not granted by the statistical tests. This was also the case for the other two clusters, EGAGLV2214H10.g, enriched in reads from pool LV and encoding an homologue of the pea Cytochrome B6-F complex iron-sulfur subunit (Salteret al., 1992), and EGABST2222G06.g, enriched in reads from pool BK and encoding a protein with high identity to beta-carotene hydroxylases fromCitrus unshiu(Kimet al., 2001) (data Figure 4- Distribution of genes with specific or preferential expression in
not shown). These results reinforce our view that the use of multiple statistical tests is a good strategy to prevent false positives.
The EGEQFB1001C06.g cluster encodes a glyceral-dehyde-3-phosphate dehydrogenase (GAPDH). Genes en-coding these proteins are widely used as control in gene expression studies because they are ubiquitously and con-stitutively expressed. However, the Eucalyptus GAPDH gene did not pass in thein silicotests because it has no reads in the BK pool. When this pool was not included in the analyses, this cluster was considered ubiquitous. The ex-pression pattern deduced from the RT-PCR assay con-firmed the expression in all organs at similar levels (Figure 5B), indicating that theEucalyptus GAPDHgene is indeed ubiquitously expressed.
Outlook for the Future
The in silico analysis presented here constitutes a valuable tool for predicting expression patterns for a large number of ESTs. We hope this bioinformatics tool will be of great help to many studies, especially those targeting promoter identification and cloning.
Acknowledgements
IGM and MM received a Research Fellowship from Conselho Nacional de Desenvolvimento Científico e Tec-nológico (CNPq). This work was supported by Fundação de Amparo à Pesquisa do Estado de São Paulo (FAPESP), with grant 03/00724-7 to I.G.M.
References
Altschul SF, Madden TL, Schäffer AA, Zhang J, Zhang Z, Miller W and Lipman DJ (1997) Gapped BLAST and PSI-BLAST: A new generation of protein database search programs. Nu-cleic Acids Res 25:3389-3402.
Audic S and Claverie JM (1997) The significance of digital gene expression profiles. Genome Res 7:986-995.
Ewing RM, Ben Kahla A, Poirot O, Lopez F, Audic S and Claverie JM (1999) Large-scale statistical analyses of rice ESTs reveal correlated patterns of gene expression. Genome Res 9:950-959.
Falco MC, Marbach PAS, Pompermayer P, Lopes FCC and Silva-Filho MC (2001) Mechanisms of sugarcane response to herbivory. Genet Mol Biol 24:113-122.
Figueiredo RC, Brito MS, Figueiredo LHM, Quiapin AC, Vito-relli PM, Silva LR, Santos RV, Molfetta JB, Goldman GH and Goldman MHS (2001) Dissecting the sugarcane ex-pressed sequence tag (SUCEST) database: Unraveling flower-specific genes. Genet Mol Biol 24:77-84.
Franco GR, Rabelo EM, Azevedo V, Pena HB, Ortega JM, Santos TM, Meira WS, Rodrigues NA, Dias CM, Harrop R, Wilson A, Saber M, Abdel-Hamid H, Faria MS, Margutti ME, Parra JC and Pena SD (1997) Evaluation of cDNA libraries from different developmental stages ofSchistosoma mansonifor production of expressed sequence tags (ESTs). DNA Res 4:231-40.
Frank MR, Deyneka JM and Schuler MA (1996) Cloning of phenylpropanoid pathway P450 monooxygenases expressed inPisum sativum. Plant Physiol 110:1035-1046
Greller LD and Tobin FL (1999) Detecting selective expression of genes and proteins. Genome Res 9:282-296.
Hsieh TH, Lee JT, Charng YY and Chan MT (2002) Tomato plants ectopically expressingArabidopsisCBF1 show en-hanced resistance to water deficit stress. Plant Physiology 130:618-626.
Journet EP, van Tuinen D, Gouzy J, Crespeau H, Carreau V, Farmer M-J, Niebel A, Schiex T, Jaillon O, Chatagnier O, Godiard L, Micheli F, Kahn D, Gianinazzi-Pearson V and Gamas P (2002) Exploring root symbiotic programs in the model legume Medicago truncatula using EST analysis. Nucleic Acids Res 30:5579-5592.
Kim IJ, Ko KC, Kim CS and Chung WI (2001) Isolation and char-acterization of cDNAs encoding beta-carotene hydroxylase in Citrus. Plant Sci 161:1005-1010.
Korimbocus J, Coates D, Barker I and Boonham N (2002) Im-proved detection of Sugarcane yellow leaf virus using a real-time fluorescent (TaqMan) RT-PCR assay. J Vir Methods 103:109-120.
Lee JT, Prasad V, Yang PT, Wu JF, David Ho, TH, Charng YY and Chan MT (2003) Expression ofArabidopsisCBF1 regu-lated by an ABA/stress inducible promoter in transgenic to-mato confers stress tolerance without affecting yield. Plant Cell Environ 26:1181-1190.
Lopez F, Bousser A, Sissoeff I, Hoarau J and Mahe A (2004) Characterization in maize of ZmTIP2-3, a root-specific tonoplast intrinsic protein exhibiting aquaporin activity. J Exp Bot 55:539-541.
Okubo K, Hori N, Matoba R, Niiyama T, Fukushima A, Kojima Y and Matsubara K (1992) Large scale cDNA sequencing for analysis of quantitative and qualitative aspects of gene ex-pression. Nat Genet 2:173-179.
Figure 5- RT-PCR validation of candidate clusters. RT-PCR was per-formed with specific primers using RNA from the organs indicated above each lane and the products were separated in an 1% agarose gel containing ethidium bromide. A) Candidate genes with possible organ-specific or -preferential expression, encoding the following proteins. The deduced protein was named according to the best Blast hit: No hits, without
homology in the database (cluster EGACFB1015B10.g); TIP
Romualdi C, Bortoluzzi S and Danieli GA (2001) Detecting dif-ferentially expressed genes in multiple tag sampling experi-ments: Comparative evaluation of statistical tests. Human Mol Genet 10:2133-2141.
Salter AH, Newman BJ, Napier JA and Gray JC (1992) Import of the precursor of the chloroplast Rieske iron-sulphur protein by pea chloroplasts. Plant Mol Biol 20:569-574.
Schopfer CR and Ebel J (1998) Identification of elicitor-induced cytochrome P450s of soybean (Glycine maxL.) using differ-ential display of mRNA. Mol Gen Genet 258:315-322.
Stekel DJ, Git Y and Falciani F (2000) The comparison of gene expression from multiple cDNA libraries. Genome Res 10:2055-2061.
Takano J, Noguchi K, Yasumori M, Kobayashi M, Gajdos Z, Miwa K, Hayashi H, Yoneyama T and Fujiwara T (2002) Arabidopsis boron transporter for xylem loading. Nature 420:337-340.