E
NERGY AND
E
NVIRONMENT
Volume 3, Issue 3, 2012 pp.383-398
Journal homepage: www.IJEE.IEEFoundation.org
A greenhouse type solar dryer for small-scale dried food
industries: Development and dissemination
Serm Janjai
Solar Energy Research Laboratory, Department of Physics, Faculty of Science, Silpakorn University, Nakhon Pathom 73000, Thailand.
Abstract
In this study, a greenhouse type solar dryer for small-scale dried food industries was developed and disseminated. The dryer consists of a parabolic roof structure covered with polycarbonate sheets on a concrete floor. The system is 8.0m in width, 20.0m in length and 3.5m in height, with a loading capacity about 1,000kg of fruits or vegetables. To ensure continuous drying operation, a 100kW-LPG gas burner was incorporated to supply hot air to the dryer during cloudy or rainy days. Nine 15-W DC fans powered by three 50-W PV modules were used to ventilate the dryer. This dryer was installed for a small-scale food industry at Nakhon Pathom in Thailand to produce osmotically dehydrated tomato. To investigate its performance, the dryer was used to dry 3 batches of osmotically dehydrated tomato. Results obtained from these experiments showed that drying air temperatures in the dryer varied from 35°C to 65°C. In addition, the drying time for these products was 2-3 days shorter than that of the natural sun drying and good quality dried products were obtained. A system of differential equations describing heat and moisture transfers during drying of osmotically dehydrated tomato was also developed. The simulated results agreed well with the experimental data. For dissemination purpose, other two units of this type of dryer were constructed and tested at two locations in Thailand and satisfactory results were obtained.
Copyright © 2012 International Energy and Environment Foundation - All rights reserved.
Keywords: Solar energy; Solar drying; Osmotically dehydrated tomato; Dried food industries; Greenhouse solar dryer.
1. Introduction
Small-scale dried food industries are growing very fast in Southeast Asia, especially in Thailand. Situated in favorable climate conditions, Southeast Asian countries produce annually huge amounts of tropical fruits and vegetables. Drying is a major post-harvest processing of these food products. To respond to the demand of dried food from both domestic and international markets, a number of small-scaled dried food industries have been developed in Southeast Asia. In Thailand, some of these industries are established as community enterprises which are operated by villagers. To dry their products in commercial scale, most community enterprises use cabinet tray dryers heated by using liquefied petroleum gas (LPG) burners. In some cases, the drying starts with the open-sun drying and continues with a cabinet tray dryer using an LPG burner.
In the last 40 years many types of solar dryers have been developed in various countries [3-24]. Many studies on natural convection solar drying of agricultural products have been reported [3-6]. However, the success achieved by natural convection solar dryers has been limited due to low buoyancy induced air flow. This has prompted researchers to develop forced convection solar dryer. Also many studies have been reported on forced convection solar dryers [7-14]. The intensive literature reviews on solar dryers can be found in [25, 26]. From this reviews, it is noticed that most solar dryers have as small loading capacity and cannot function properly during cloudy or raining periods. Consequently, it is not appropriate to use such dryers for the small-scale food industries in Thailand.
In general, small-scale food industries in Thailand require a solar dryer which could be used to dry 1,000-2,000 kg of fruits or vegetables per batch. As Thailand is situated in the tropics, the rainy season lasts approximately six months. Apart from high loading capacity, the dryer has to be equipped with an auxiliary heater to ensure continuous drying operation during the rainy season. To meet this requirement, we have developed a greenhouse type solar dryer for drying fruits and vegetables in small-scale food industries in Thailand. The dryer has a loading capacity of 1000 kg for fruits or vegetables. To ensure the continuous drying operation during cloudy or rainy periods, an auxiliary heater using LPG burner as heat source was equipped. The technical and economic performance of this dryer for drying osmotically dehydrated tomato in a commercial scale were presented in this paper.
2. Materials and methods
2.1 Experimental study 2.1.1 Experimental set up
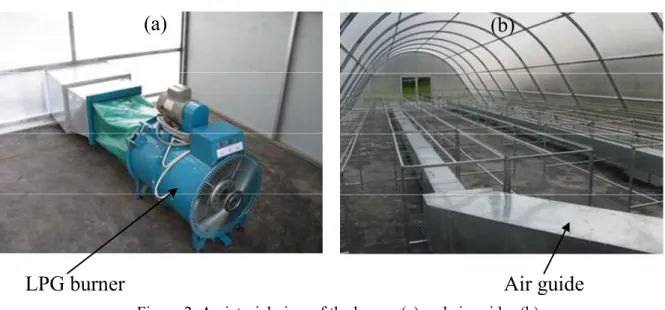
The greenhouse type solar dryer was installed at a small-scale food industry in Nakhon Pathom (13.96°N, 100.10°E), Thailand. The dryer consists of a parabolic roof structure made from polycarbonate sheets on a concrete floor. The system has a width of 8.0 m, length of 20.0 m and height 3.5 m with a loading capacity of about 1,000 kg of fruits or vegetables. Nine DC fans operated by three 50-Watt solar cell modules were installed in the wall opposite to the air inlet to ventilate the dryer. An 100 kW LPG-burner was installed in a housing at the rear side of the dryer to heat drying air which was guided through the air ducts inside the dryer. The burner was equipped with a thermostat to control the drying air temperature. This type of burner is widely used in longan dryer in northern Thailand. A pictorial view of the dryer developed in this study is shown in Figure 1.
Solar radiation passing through the polycarbonate roof heats the air and the products inside the dryer as well as the concrete floor. Ambient air is drawn in through a small opening at the bottom of the front side of the dryer and is heated by the floor and the products exposed to solar radiation. The heated air, while passing through and over the products absorbs moisture from the products. Direct exposure to solar radiation of the products and the heated drying air enhance the drying rate of the products. Most air is sucked from the dryer by nine PV-fans at the top of the rear side of the dryer. In case of rain and cloudy day, LPG burner is manually started and the AC fan of the burner blow hot air from the burner through the air guide in to the dryer. A pictorial view of the burner and air guides is shown in Figure 2.
(a)
(b)
LPG burner
Air guide
Figure 2. A pictorial view of the burner (a) and air guides (b)
2.1.2 Experimental procedure
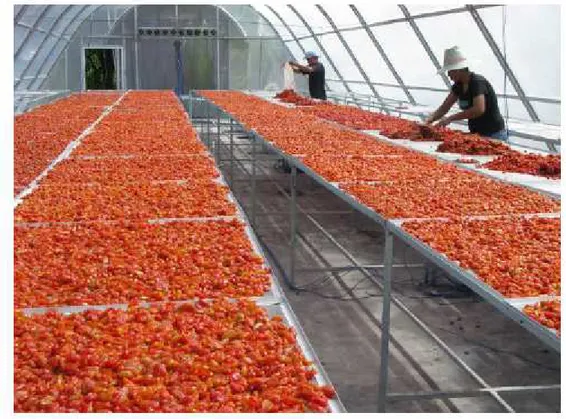
The dryer installed for a small-scale food industry in Nakhon Pathom was used to produce osmotically dehydrated tomato. For the production of osmotically dehydrated tomato, small tomato (diameter of 1.5 cm) was used in this study and these were collected from local farmers. Fresh whole tomato was blanched in boiling water for about 5 minutes. After blanching, the tomato were soaked in sugar solution (40% of sugar) for 72 hours and next these products were dried in the greenhouse dryer. In this study 1,000 kg of osmotically dehydrated tomato was dried in the solar greenhouse dryer to demonstrate its potentials for drying. A total of three full scale experimental runs were conducted during the period of October-December, 2009.
Solar radiation was measured by a pyranometer (Kipp & Zonen model CM 11, accuracy ± 0.5%) placed on the roof of the dryer. Thermocouples (type K) used to measure air temperatures in the dryer were tested by measuring the boiling and freezing temperatures of water to determine the accuracy (± 2%). Thermocouple positions for temperature measurement are shown in Figure 3. A hot wire anemometer
(Airflow, model TA5, accuracy ± 2%) was used to monitor the air velocity inside the dryer. The
anemometer was also used to monitor the ambient wind speed. The relative humidity of ambient air and
drying air were periodically measured by hygrometers (Electronik, model EE23, accuracy ± 2%).
Voltage signals from the pyranometer, hygrometers and thermocouples were recorded every 10 minutes by a multi-channel data logger (Yokogawa, model DC100). The air speed at the inlet and outlet of the dryer were recorded during the drying experiments. Before the installations, the pyranometer was calibrated against a pyranometer recently calibrated by the manufacturer. The hygrometers were calibrated using standard saturated salt solutions.
The moisture content during drying was estimated from the weight of the product samples and the estimated dried solid mass of the samples. At the end of the experimental drying run, the exact dry solid mass of the product samples was determined by the oven method (103°C for 24 hours, accuracy ± 0.5%).
T41
T43
20 m
T4
8 m
40 T40 T9
T32
T42 T39
M6 T26
T28 T22
T21T27
T31
T29 T30
T25
M5
T14
T17
T24 T23
T18 M3
rh1
T19 T16 T15
T20 T38 T37
M4 T6
T11 T10
T36 M1
rh2
T8 T7 T12
M2 T3
T13
T1
T2
T5
T_outlet rh_outlet
Polycarbonate cover
Air inlet Door
Air inlet
Air guide
Concrete floor Fans (Air outlet)
Solar cell module
LPG burner
LPG tank Housing of LPG burner
It
Figure 3. The dimension and the positions of the thermocouples (T), hygrometers (rh), product samples for weights (M) and solar radiation (It)
2.2 Mathematical modeling
The assumptions in developing the mathematical model for the solar greenhouse dryer are i) no stratification of the air inside the dryer, ii) drying computation is based on a thin layer drying model, and iii) specific heat of air, cover and product are constant.
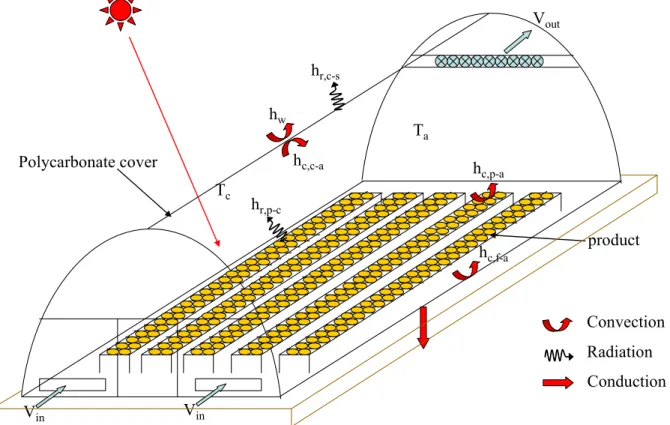
Schematic diagram of energy transfers inside the solar greenhouse dryer is shown in Figure 5 and the following heat and mass balances are formulated:
Vin Vin
Vout
Polycarbonate cover
hw
hc,c-a
hc,f-a Ta
Tc
hc,p-a
hr,p-c
hr,c-s
Convection
Radiation
Conduction product
Figure 5. Schematic diagram of energy transfers inside the solar greenhouse dryer
2.2.1 Energy balance of the cover
The balance of energy on the cover is considered as follows: Rate of accumulation of thermal energy in the cover = Rate of thermal energy transfer between the air inside the dryer and the cover due to convection + Rate of thermal energy transfer between the sky and the cover due to radiation + Rate of thermal energy transfer between the cover and ambient air due to convection + Rate of thermal energy transfer between the product and the cover due to radiation + Rate of solar radiation absorbed by the cover.
The energy balance of the polycarbonate cover gives:
t c c c p c p , r p c am w c c s s c , r c c a a c , c c c pc
c
A
h
(
T
T
)
A
h
(
T
T
)
A
h
(
T
T
)
A
h
(
T
T
)
A
I
dt
dT
C
m
=
−−
+
−−
+
−
+
−−
+
α
(1)2.2.2 Energy balance of the air inside the dryer
This energy balance can be written as: Rate of accumulation of thermal energy in the air inside the dryer = Rate of thermal energy transfer between the product and the air due to convection + Rate of thermal energy transfer between the floor and the air due to convection + Rate of thermal energy gain of the air from the product due to sensible heat transfer from the product to the air + Rate of thermal energy gained in the air chamber due to inflow and outflow of the air in the chamber + Rate of over all heat loss from the air in the dryer to the ambient air + Rate of energy absorbed by the air inside dryer from solar radiation.
c c t p p f p a am c c in pa in a out pa out a p a p p pv p p a f a f , c f a p a p , c p a pa a A I ] F ) 1 ( ) 1 )( F 1 [( ) T T ( A U ) T C V T C V ( dt dM ) T T ( C A D ) T T ( h A ) T T ( h A dt dT C m τ α − + α − − + − + ρ − ρ + − ρ + − + − = − − (2)
2.2.3 Energy balance of the product
Rate of accumulation of thermal energy in the product = Rate of thermal energy transfer between air and product due to convection + Rate of thermal energy transfer between cover and product due to radiation + Rate of thermal energy lost from the product due to sensible and latent heat loss from the product + Rate of solar energy absorbed by the product.
The energy balance on the product gives:
c c t p p p p a pv p p p p p c c p , r p p a a p , c p p p pl pg p
A
I
F
dt
dM
)]
T
T
(
C
L
[
A
D
)
T
T
(
h
A
)
T
T
(
h
A
dt
dT
)
M
C
C
(
m
τ
α
+
−
+
ρ
+
−
+
−
=
+
− − (3)2.2.4 Energy balances on the concrete floor
Rate of accumulation of thermal energy in the floor = Rate of convection heat transfer between air in the dryer and the floor + Rate of conduction heat transfer between the floor and the ground + Rate of solar radiation absorption on the floor.
c f t f p f g g f , D f f a a f , c f f pf
f
A
h
(
T
T
)
A
h
(
T
T
)
(
1
F
)
I
A
dt
dT
C
m
=
−−
+
−−
+
−
α
τ
(4)2.2.5 Mass balance equation
The accumulation rate of moisture in the air inside dryer = Rate of moisture inflow into the dryer due to entry of ambient air – Rate of moisture outflow from the dryer due to exit of air from the dryer + Rate of moisture removed from the product inside the dryer. The mass balance inside dryer chamber gives:
dt
dM
A
D
v
H
A
v
H
A
dt
dH
V
in a in in out a out out p p d pa
=
ρ
−
ρ
+
ρ
ρ
(5)2.2.6 Heat transfer and heat loss coefficients
Radiative heat transfer coefficient from the cover to the sky
(
h
r,c−s)
is calculated as [27]:) T T )( T T (
h c s
2 s 2 c c s c ,
r − = ε σ + + (6)
Radiative heat transfer coefficient between the product and the cover
(
h
r,p−c)
is computed as [27]:) T T )( T T (
h p c
2 c 2 p p c p ,
r − = ε σ + + (7)
Convective heat transfer coefficient from the cover to ambient due to wind (
h
w) is computed as [28]:w w 2.8 3.0V
h = + (8)
Convective heat transfer coefficient inside the solar greenhouse dryer for either the cover or product and floor (
h
c) is computed from the following relationship:h c a p , c a c , c a f , c D k Nu h h h
Nusselt number, (Nu) is computed from the Reynolds number (Re) by using the following relationship [29]:
8 . 0
Re 0158 . 0
Nu= (10)
The overall heat loss coefficient from the greenhouse cover (
U
c) is computed from the following relation:c c c
k
U
δ
=
(11)2.2.7 Thin layer drying equation
We conducted thin layer experiments in a laboratory dryer under controlled conditions of temperature and relative humidity and the following thin layer drying equation was developed for thin layer drying of osmotic treated tomato:
)
At
exp(
M
M
M
M
Be o
e
=
−
−
−
(12)
where M (decimal, db) is the product moisture content at time t (hour),
M
0(decimal, db) is initial moisture content,M
e(decimal, db) is the equilibrium moisture content. The drying parametersA
andB
are given as:A=-0.276079+0.00723T+0.001594rh-0.000099Trh+0.000041rh2 (13)
B=1.511073-0.042305T+0.134277rh-0.0020655Trh+0.000533T2-0.001355rh2 (14)
where T is temperature (°C) and rh is relative humidity (%)
We also conducted experiments to determine the equilibrium moisture content of the osmotically dehydrated tomato under controlled conditions of temperature and relative humidity. The result is written as:
74215 . 1
e w
M
T 41666 . 0 50883 . 51 1
1 a
⎥ ⎦ ⎤ ⎢
⎣
⎡ −
+
= (15)
where T is temperature (°C) and
a
w is water activity (decimal). The water activity is equal to the relative humidity in percent divided by 100.2.2.8 Solution procedure
The system of Eqs. (1–5) are solved numerically using the finite difference technique. The time interval should be small enough for the air conditions to be constant, but for the economy of computing, a compromise between the computing time and accuracy must be considered. On the basis of the drying air temperature and relative humidity inside the drying chamber, the drying parameters A and B and the equilibrium moisture content (Me) of the product are computed. Using the A, B and Me values, the
4 3 2 1 f p a c 44 43 42 41 34 33 32 31 24 23 22 21 14 13 12 11 b b b b T T T T a a a a a a a a a a a a a a a a = ⎥ ⎥ ⎥ ⎥ ⎦ ⎤ ⎢ ⎢ ⎢ ⎢ ⎣ ⎡ (16)
This system of equations is a set of implicit calculations for the time interval ∆t. These are solved by the Gauss–Jordan elimination method using the recorded values for the drying air temperature and relative humidity, the change in moisture content of the product (∆M) for the given time interval. The process is repeated until the final time is reached. The numerical solution was programmed in Compaq Visual FORTRAN version 6.5.
2.3 Colour measurement of dried tomato
The colour of dried osmotically dehydrated tomato samples was measured by a chromometer (CR-400, Minolta Co., Ltd., Japan) in Commission Internationale l’Eclairage (CIE) chromaticity coordinates. L*, a* and b* represent black to white (0–100), green to red (−60 to +60) and from blue to yellow (−60 to +60) colours, respectively. Out of five available colour systems, the L*a*b* [30, 31] and L*C*h [32] systems were selected because these are the most-used systems for evaluation of the colour of dried food materials. The instrument was standardised each time with a white ceramic plate. Three readings were taken at each place on the surface of samples and then the mean values of L*, a* and b* were averaged. The different colour parameters were calculated using the following equations [33].
Hue angle (h) indicating colour combination (i.e. browning) is defined as:
⎪⎩
⎪
⎨
⎧
<
+
°
>
=
0)
a*
(when
/a*)
*
(b
tan
180
0)
a*
(when
/a*)
*
(b
tan
h
1 --1 (17)Chroma (C*) indicating colour intensity or saturation is defined as:
C*=(a*2+b*2)1/2 (18)
and the total colour change (∆E) is defined as:
2 * ref * 2 * ref * 2 * ref *
)
b
b
(
)
a
a
(
)
L
L
(
E
=
−
+
−
+
−
∆
(19)2.4 Economic analysis
The total capital cost for the solar dryer (C ) is given by the following equation: T
l m
T C C
C = + (20)
where Cm is the material cost of the dryer and C1is the labor cost for the construction. The annual cost calculation method proposed by Audsley and Wheeler [34] yields:
⎥
⎦
⎤
⎢
⎣
⎡
−
ω
ω
−
ω
⎥
⎦
⎤
⎢
⎣
⎡
ω
+
+
=
∑
=
(
1
)
1
)
C
C
(
C
C
N N 1 i i i , op i int, ma Tannual (21)
where
C
annual is the annual cost of the system.C
maint,iandC
op,iare the maintenance cost and the operating cost at the year i respectively.ω is expressed aswhere iin and if are the interest rate and the inflation rate in percent, respectively.
The operating cost consists Cop of the gas consumption cost, electricity consumption cost and the labour cost for operating the dryer. This cost can be written as follows;
op , labour electric
gas
op
C
C
C
C
=
+
+
(23)The maintenance cost of the first year was assumed to be 1% of the capital cost. Where Cgas is the cost
of LPG gas, Celectric is the cost of electricity required by the LPG burner,
C
labour,opis labour cost for operating the dryer.The annual cost per unit of dried product is called the drying cost (Z, USD/kg). It can be written as
Z=
dry annual
M C
(24)
where
M
dryis the dried product obtained from this dryer per year.Z M P M P M
C period
Payback
dry f
f d dry
T − −
= (25)
where
M
dryis annual production of dry product (kg), Mf is the amount of fresh product per year (kg), Pdis the price of the dry product (USD/kg) and Pf is the price of the fresh product (USD/kg).
3. Results and discussion
3.1 Experimental results
Figure 6 shows the variations of solar radiation during the typical experimental runs of solar drying of osmotically dehydrated tomato in the solar greenhouse dryer. During the drying of osmotically dehydrated tomato, solar radiation increased sharply from 8 am to noon but it considerably decreased in the afternoon. There was also a slight random fluctuation in solar radiation. However, the overall cyclic patterns of the solar radiation were similar except the forth day of solar drying of osmotically dehydrated tomato due to rain and the LPG burner was used.
0 200 400 600 800 1000 1200
8 10 12 14 16 18 8 10 12 14 16 18 8 10 12 14 16 18 8 10 12 14 16 18 Time (hr)
S
o
la
r ra
d
ia
tio
n
(W
/m
2 )
31/10/2009 1/11/2009
3/11/2009
2/11/2009
Figure 6. Variations of solar radiation with time of the day for a typical experimental run during drying of osmotically dehydrated tomato
Temperatures in different positions at these three locations vary within a narrow band. In addition, temperatures at each of the locations differed significantly from the ambient air temperature.
0 10 20 30 40 50 60 70
8 10 12 14 16 18 8 10 12 14 16 18 8 10 12 14 16 18 8 10 12 14 16 18
Time (hr)
T
em
p
er
at
ur
e(
o C)
T6 T10 T18 T22 T30 Ambient
3/11/2009 2/11/2009
1/11/2009 31/10/2009
Figure 7. Variations of ambient temperature and the temperatures at different positions inside the greenhouse solar dryer for a typical experimental run during drying of osmotically dehydrated tomato
Figure 8 shows relative humidity inside the dryers for typical experimental runs during solar drying of osmotically dehydrated tomato. Relative humidity decreases with time inside the dryer during the first half of the day. This is caused by decreasing relative humidity of the ambient air and increased water holding capacity of the drying air due to temperature increase, whereas the opposite is true for the latter half of the day. The relative humidity of the air inside the dryers is always lower than that of the ambient air and the lowest relative humidity is in the middle of the day which persists for about 5 hours. Thus, the time of day with the most potential for solar dying is between 8:00 and 16:00. Furthermore, the air leaving the dryer has lower relative humidity than that of the ambient air, which indicates the exhaust air from the dryer, still has drying potential.
0 20 40 60 80 100
8 10 12 14 16 18 8 10 12 14 16 18 8 10 12 14 16 18 8 10 12 14 16 18
Time (hr)
R
el
at
iv
e hu
m
idi
ty
(
% Inside
Outlet
Ambient
31/10/2009
1/11/2009 2/11/2009 3/11/2009
Figure 8. Variations of ambient relative humidity and relative humidity inside the greenhouse dryer with time of the day for a typical experimental run during drying of osmotically dehydrated tomato
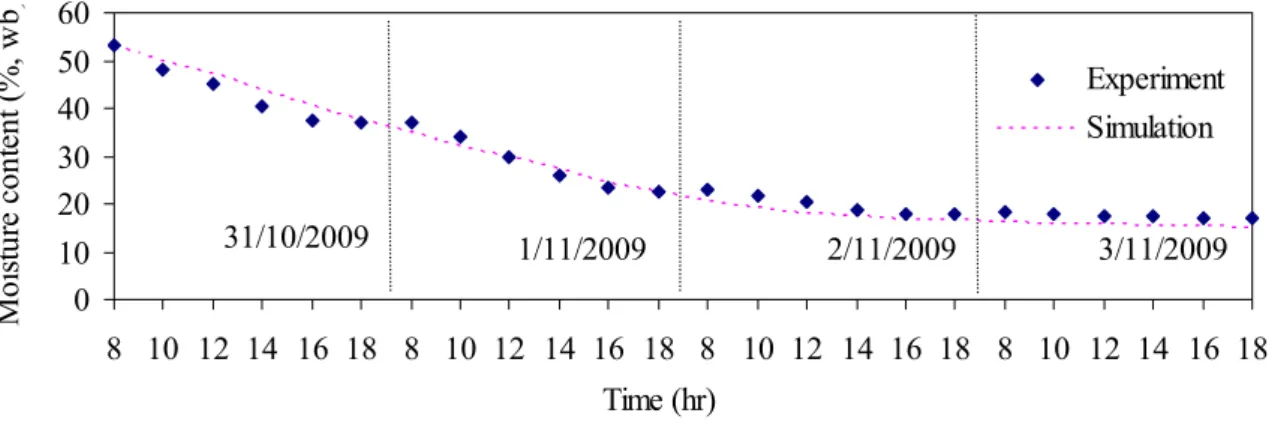
Figure 9 shows the variations in moisture content of osmotically dehydrated tomato samples at different positions in the dryer for typical experimental runs compared to the control samples dried in the open-air sun drying. The moisture content of osmotically dehydrated tomato in the solar dryer was reduced from an initial value of 54 % (wb) to a final value of 17 % (wb) within 4 days whereas the moisture content of the sun-dried samples was reduced to 29 % (wb) within the same period. Thus, drying in the solar greenhouse dryer results in a reduced drying time.
During the experiments when there was a rain, the LPG burner was used. The consumption of LPG during the experiments is shown in Table 1.
0 10 20 30 40 50 60 70
8 10 12 14 16 18 8 10 12 14 16 18 8 10 12 14 16 18 8 10 12 14 16 18 Time (hr)
M
o
is
tu
re
c
o
n
te
n
t (
%
,
w
b
)
M1 M2
M3 M4
M5 M6
Open-air sun drying
31/10/2009 1/11/2009 2/11/2009 3/11/2009
Figure 9. Comparison of the moisture contents of osmotically dehydrated tomato at different positions inside the greenhouse dryer with those obtained by the open-air sun drying method
Table 1. LPG and electricity consumption for the burner
No. of experiment
Period LPG consumption
(kg)
Electricity consumption (kWh)
1 2 3
12 October – 15 October, 2009 19 October – 22 October, 2009 31 October – 3 November, 2009
13 30 25
6.0 8.5 7.0
3.2 Simulated results
Figure 10 shows typical comparisons between the predicted and experimental temperature values for solar drying of osmotically dehydrated tomato. Predicted temperature shows plausible behaviour and the agreement between the predicted and observed values is good.
0 10 20 30 40 50 60 70
8 10 12 14 16 18 8 10 12 14 16 18 8 10 12 14 16 18 8 10 12 14 16 18
Time (hr)
T
em
p
er
at
u
re
(
o C)
Experiment Simulation
3/11/2009 2/11/2009
1/11/2009 31/10/2009
Figure 10. Comparison of the simulated and observed temperatures inside the greenhouse dryer during drying of osmotically dehydrated tomato for a typical experimental run
0 10 20 30 40 50 60
8 10 12 14 16 18 8 10 12 14 16 18 8 10 12 14 16 18 8 10 12 14 16 18 Time (hr)
M
o
is
tu
re
c
o
n
te
n
t (
%
, w
b
)
Experiment Simulation
3/11/2009 2/11/2009
1/11/2009 31/10/2009
Figure 11. Comparison of the simulated and observed moisture content during drying of osmotically dehydrated tomato for a typical experimental run
3.3 Colour change
The colour of fresh and dried osmotically dehydrated tomato was measured using chromometer (CR-400, Minolta Co. Ltd, Japan) and results are shown in Table 2. The colour of fresh osmotically dehydrated tomato changes from light reddish brown to bright reddish brown after drying. The values of the colour indices indicate that the colour of solar dried osmotically dehydrated tomato is bright reddish brown while that of sun dried osmotically dehydrated tomato is light yellow brown. The total colour change of solar dried osmotically dehydrated tomato was 11.3 which indicates a large difference in color while the total change of sun dried osmotically dehydrated tomato was 5.8 which indicates an appreciable color difference. The colour change is more in case of solar dried osmotically dehydrated tomato and this color is the acceptable color in the dried osmotically dehydrated tomato markets and to the consumers of dried osmotically dehydrated tomato.
Table 2. Colour variations of dried osmotically dehydrated tomato
Colour Value Status
L* a* b* C* h
Fresh osmotically dehydrated tomato 20.378 13.371 24.214 27.660 61.124
Solar dried osmotically dehydrated tomato 24.847 16.643 14.344 21.969 40.783
Natural sun dried osmotically dehydrated tomato 20.758 13.488 17.371 21.993 52.198
3.4 Application of simulation model and economic evaluation
In order to carry out the economic evaluation of these tomatoes, the simulation model was used to simulate the performance of the dryer for one year. The typical meteorological data set for Nakhon Pathom was used for the simulation [36]. The additional thermal energy required during the cloudy and rain period was estimated from the simulation with this thermal energy requirement and heating value of LPG, the quantity of LPG required was calculated. Also, the quality of dried product was estimated by using the simulation.
Based on the estimated production and the capital and operating costs of the drying system for drying of osmotically dehydrated tomato (Table 3), the payback period of the greenhouse solar drying system for this product is estimated and this is found to be about 0.65 years.
3.5 Dissemination
(Figure 12). Satisfactory results were obtained from all units. Apart from the improvement of the dried product quality, this type of dryer help to reduce LPG consumption in small-scale dried food industries. This is because the dryer uses solar energy as a main heat source. As a result of this success, the Department of Alternative Energy Development and Efficiency of Thailand has set up a dissemination program to promote the wide spread use of this type of dryer in small-scale food industries and several units of this type of the dryer are being used in a number of these industries across the country.
Table 3. Details of the computation of payback period
Items Costs and economic parameters
Materials of constructions of the greenhouse dryer 10,860 USD*
Polycarbonate plates 4,000 USD
Solar modules and fans 1,140 USD
Labour costs for constructions 2,285 USD
Auxiliary heater system 2,000 USD
Repair and maintenance cost 1% of capital cost per year
Gas consumption:
- Amount of LPG for operating - Price of LPG for LPG burner
666 kg per year 0.43 USD per kg Electricity consumption:
- Amount of electricity - Price of electricity
252 kWh per year 0.114 USD per kWh Labor cost for operating the dryer:
- Labour cost
- Number of labour per batch
5.7 USD per person per batch 2 person
Price of dried osmotically dehydrated tomato 4.57 USD
Expected life of the dryer 15 years
Interest rate 7%
Inflation rate 3.5%
๕ ( 1USD = 35 Baht)
4. Conclusion
A large-scale greenhouse solar dryer with LPG burner has been developed and its performance for drying osmotically dehydrated tomato have been investigated. Solar drying of osmotically dehydrated tomato in solar greenhouse dryer resulted in considerable reductions in drying time as compared with the open-air sun drying and the products dried in the solar greenhouse dryer are high quality dried products. The problem of drying interruption by rain and cloudy period has been solved.
A system of partial differential equations for heat and moisture transfer has been developed for solar drying of osmotically dehydrated tomato in the solar greenhouse dryer. The simulated air temperatures inside the dryer agreed well with the observed temperature data. Good agreement was found between the experimental and simulated moisture contents of osmotically dehydrated tomato during drying and the accuracy was within the acceptable range. The model has been used to provide gas quantity consumption and amount of dried products for economic evaluation. The estimated payback periods of the greenhouse type solar dryer for tomato are about 0.65 years. Due to its technical and economic effectiveness, this type of solar dryer has been officially included into the dissemination program by the Department of Alternative Energy Development and Efficiency of Thailand.
Acknowledgements
The author would like to thank the Department of Alternative Energy Development and Efficiency for inviting Silpakorn University to carry out this project. The author also thanks Mr. Yuttasak Boonrod, Mr. Sarawut Nabnean and Mr. Niroot Lamlert for their assistance in carrying out the drying experiments.
References
[1] Mühlbauer W. Present status of solar crop drying. Energy in Agriculture 1986, 5, 121-137.
[2] Bala B.K. Solar drying systems: simulation and optimization. Udaipur, Agrotech Publishing
Academy, India, 1998.
[3] Exell R.H.B., Kornsakoo S. A low-cost solar rice dryer. Appropriate Technology 1978, 5, 23-24. [4] Zaman M.A., Bala B.K. Thin layer solar drying of rough rice. Solar Energy 1989, 42(2), 167-171. [5] Sharma V.K., Colangelo A., Spagna G. Experimental investigation of different solar driers suitable
for fruits and vegetable drying. Renewable Energy 1995, 6, 413-424.
[6] Oosthuizen P.H. The design of indirect solar rice dryers. Journal of Engineering for International Development 1995, 2, 20-27.
[7] Esper A., Mühlbauer W. Solar tunnel dryer for fruits. Plant Research and Development 1996, 44, 61-80.
[8] Janjai S., Hirunlabh J. Experimental study of a solar fruit dryer. Proceedings of ISES Solar World Congress, Biomass, Agriculture, Wind 1993, 8, 123-128.
[9] Schirmer P., Janjai S., Esper A., Smitabhindu R., Muhlbauer W. Experimental investigation of the performance of the solar tunnel dryer for drying bananas. Renewable Energy 1996, 7, 119-129.
[10] Janjai S., Wongpromchai A., Esper A. Study of the performance of Silpakorn-Hohenheim type
solar dryer. Proceedings of ASEAN Seminar on Drying Technology 1998, 5, 5-14.
[11] Bala B.K., Mondol M.R.A. Experimental investigation on solar drying of fish using solar tunnel drier. Drying Technology 2001, 19, 1-10.
[12] Bala B.K., Mondol M.R.A., Biswas B.K., Das Choudhury B.L., Janjai S. Solar drying of pineapple using solar tunnel drier. Renewable Energy 2003, 28, 183-190.
[13] Janjai S., Keawprasert T. Design and performance evaluation of a solar tunnel dryer with
polycarbonate cover, International Energy Journal 2006, 7, 187-194.
[14] M.A. Hossain, B.K. Bala, Drying of hot chilli using solar tunnel drier, Solar Energy 81 (2007) 85-92.
[15] M. Condori, L. Saravia, The performance of forced convection greenhouse driers. Renewable
Energy 1998, 13, 453-469.
[16] Garg H.M., Kumar R. Studies on semi-cylindrical solar tunnel dryers: Thermal performance of
collector. Applied Thermal Engineering 2000, 20, 115-131.
[17] Jain D., Tiwari G.N. Effect of greenhouse on crop drying under natural forced convection II.
Thermal modeling and experimental validation, Energy Conversion and Management 2004, 45, 2777-2793.
[19]
Nayak S.
, Tiwari G.N. Energy metrics of photovoltaic/thermal and earth air heat exchanger integrated greenhouse for different climatic conditions of India, Applied Energy 2010, 87, 2984-2993.[20] Rathore N.S., Panwar N.L. Experimental studies on hemi cylindrical walk-in type solar tunnel
dryer for grape drying. Applied Energy 2010, 87, 2764-2767.
[21] Barnwal P., Tiwari G.N. Grape drying by using hybrid photovoltaic-thermal (PV/T) greenhouse
dryer: An experimental study. Solar Energy 2008, 82, 1131-1144.
[22] Janjai S., Lamlert N., Intawee P., Mahayothee B., Boonrod Y., Haewsungcharern M., Bala B.K.,
Nagle M., Muller J. Solar drying of peeled longan using a side loading type solar tunnel dryer:
Experimental and simulated performance.Drying Technology 2009, 27, 595–605.
[23] Amer B.M.A., Hossain M.A., Gottschalk K. Design and performance evaluation of a new hybrid
solar dryer for banana. Energy Conversion and Management 2010, 51, 813-820.
[24] Montero I., Blanco J., Miranda T., Rojas S., Celma A.R. Design, construction and performance
testing of a solar dryer for agroindustrial by-products. Energy Conversion and Management 2010, 51, 1510-1521.
[25] Sharma A., Chen C.R., Lan N.V. Solar-energy drying system: A review. Renewable and
Sustainable Energy Reviews 2009, 13, 1185-1210.
[26] Murthy M.V.R.
A review of new technologies, models and experimental investigations of
solar driers
. Renewable and Sustainable Energy Reviews 2009, 13, 835-844.[27] Duffie J.A., Beckman W.A. Solar Engineering of Thermal Processes. John Wiley and Sons, New
York, 1991.
[28] Watmuff J.H., Charters W.W.S., Proctor D. Solar and wind induced external coefficients for solar collectors. COMPLES 1977, 2, 56.
[29] Kays W.M., Crawford M.E. Convective Heat and Mass Transfer. McGraw Hill, New York, 1980.
[30] Krokida M.K., Tsami E., Maroulis Z.B., Kinetics on color changes during drying of some fruits and vegetables. Drying Technology 1998, 16(3-5), 667-685.
[31] Maskan M. Kinetics of colour change of kiwifruits during hot air and microwave drying. Journal of Food Engineering 2001, 48(2), 169-175.
[32] Zhang M., De Baerdenaeker J., Schrevens E. Effects of different varieties and shelf storage
conditions of chicory on deteriorative color changes using digital image processing and analysis. Food Research International 2003, 36(7), 669-676.
[33] Lopez Camelo A.F., Gomez P.A. Comparison of colour indexes for tomato ripening, Horticultural Brassica 2004, 22(2), 534-537.
[34] Audsley E., Wheeler J. The annual cost of machinery calculated actual cash flows. Journal of
Agricultural Engineering Research 1978, 23, 189-201.
[35] O’Callaghan J.R., Menzies D.J., Bailey P.H. Digital simulation of agricultural drier performance, Journal of Agricultural Engineering Research 1971, 16, 223-244.
[36] Janjai S., Deeyai P. Comparison of methods for generating typical meteorological year using
meteorological data from a tropical environment. Applied Energy 2009, 86, 528–537.
Serm Janjai He is an Associate Professor at the Department of Physics, Silpakorn University, Thailand. He received his B.Sc. and M.Sc. in Physics from Chulalongkorn University, Thailand in 1975 and 1978, respectively and docteur de troisieme cycle in energy technology from the University of Perpignan, France in 1985. He also obtained Marie Curie postdoctoral fellowship from the European Commission to carry out a research on a solar thermal system at Hohenheim University, Germany in 1995. He has carried out more than 30 research projects on solar radiation and solar thermal technology funded by national and international organizations. As a result, he has published more than 50 original research papers in international journals and 3 book chapters and obtained one patent. He has been recognized for successful development and implementation of solar dryers in Thailand and the development of solar radiation maps from satellite data for this country. He was also appointed to be a member of the Scientific Advisory Group for solar ultraviolet radiation measurement (GAW/UV SAG) of the World Meteorological Organization (WMO). His research interests are solar radiation and solar drying technology. Dr. Janjai has intensively engaged in research in these fields for more than 30 years.