www.clim-past.net/10/955/2014/ doi:10.5194/cp-10-955-2014
© Author(s) 2014. CC Attribution 3.0 License.
Orbitally tuned timescale and astronomical forcing in the middle
Eocene to early Oligocene
T. Westerhold1, U. Röhl1, H. Pälike1, R. Wilkens2, P. A. Wilson3, and G. Acton4
1MARUM – Center for Marine Environmental Sciences, University of Bremen, Leobener Strasse, 28359 Bremen, Germany 2Institute of Geophysics and Planetology, University of Hawaii, Honolulu, HI 96822, USA
3National Oceanography Centre Southampton, University of Southampton, Waterfront Campus, European Way, Southampton, SO14 3ZH, UK
4Department of Geography and Geology, Sam Houston State University, Huntsville, TX 77431, USA
Correspondence to:T. Westerhold ([email protected])
Received: 12 November 2013 – Published in Clim. Past Discuss.: 18 December 2013 Revised: 18 February 2014 – Accepted: 22 March 2014 – Published: 16 May 2014
Abstract.Deciphering the driving mechanisms of Earth sys-tem processes, including the climate dynamics expressed as paleoceanographic events, requires a complete, continuous, and high-resolution stratigraphy that is very accurately dated. In this study, a robust astronomically calibrated age model was constructed for the middle Eocene to early Oligocene interval (31–43 Ma) in order to permit more detailed study of the exceptional climatic events that occurred during this time, including the middle Eocene climate optimum and the Eocene–Oligocene transition. A goal of this effort is to ac-curately date the middle Eocene to early Oligocene compos-ite section cored during the Pacific Equatorial Age Transect (PEAT, IODP Exp. 320/321). The stratigraphic framework for the new timescale is based on the identification of the stable long eccentricity cycle in published and new high-resolution records encompassing bulk and benthic stable isotope, calibrated XRF core scanning, and magnetostrati-graphic data from ODP Sites 171B-1052, 189-1172, 199-1218, and 207-1260 as well as IODP Sites 320-U1333, and 320-U1334 spanning magnetic polarity Chrons C12n to C20n. Subsequently orbital tuning of the records to the La2011 orbital solution was conducted. The resulting new timescale revises and refines the existing orbitally tuned age model and the geomagnetic polarity timescale from 31 to 43 Ma. The newly defined absolute age for the Eocene– Oligocene boundary validates the astronomical tuned age of 33.89 Ma identified at the Massignano, Italy, global stra-totype section and point. The compilation of geochemi-cal records of climate-controlled variability in
sedimenta-tion through the middle-to-late Eocene and early Oligocene demonstrates strong power in the eccentricity band that is readily tuned to the latest astronomical solution. Obliquity driven cyclicity is only apparent during 2.4 myr eccentricity cycle minima around 35.5, 38.3, and 40.1 Ma.
1 Introduction
and late Eocene remain uncertain (Prentice and Matthews, 1988; Ehrmann and Mackensen, 1992; Miller et al., 1991; Zachos et al., 1994, 1996; Edgar et al., 2007; Eldrett et al., 2007; Burgess et al., 2008). This interval in Earth’s history is critical to testing climatic and evolutionary hypotheses about the deterioration of earlier Eocene conditions (Zachos et al., 2001).
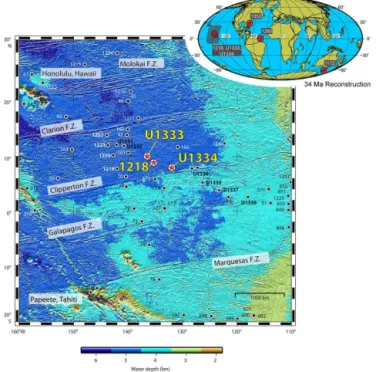
Key records leading to recent breakthroughs in recon-structing the late Eocene and Oligocene epochs were those recovered during ODP Leg 199 (Lyle et al., 2002), at Site 1218 in particular (Fig. 1). Data from ODP Site 1218 per-mitted the development of an astronomical calibration of the entire Oligocene (Coxall et al., 2005; Wade and Pälike, 2004; Pälike et al., 2006), but low-carbonate content in uppermost Eocene sediments at this site make detailed age control less certain than for the Oligocene. Although paleomagnetic age control for these time intervals is of high quality (Lanci et al., 2004, 2005), global stratigraphic correlation is hindered by low mass accumulation rates, the absence of a detailed isotope stratigraphy, and sparser biostratigraphic control in the carbonate-poor interval. To facilitate the development of an integrated magneto- and biostratigraphic framework with a stable isotope stratigraphy, IODP Expeditions 320/321 (Pa-cific Equatorial Age Transect – PEAT; Pälike et al., 2010) tar-geted the recovery of carbonate sections with a high quality magnetostratigraphy.
Decimeter-scale features in the sedimentary record as ex-pressed in physical properties data from Leg 199 and Exp. 320/321 sites can be correlated over hundreds of kilometers at orbital resolution (Pälike et al., 2005; Westerhold et al., 2012a; Wilkens et al., 2013). Moreover, higher sedimenta-tion rates and better preservasedimenta-tion of carbonate in the middle to late Eocene of Exp. 320/321 sites (hereafter referred to as PEAT records) allows tests and improvement of earlier efforts to astronomically calibrate this time interval (Pälike et al., 2006) and further extend these back into the early to middle Eocene (Westerhold et al., 2012a). High-quality shipboard paleomagnetic records (Pälike et al., 2010), re-vised composite records, and detailed site-to-site correlation for all PEAT sites (Westerhold et al., 2012a; Wilkens et al., 2013) are the prerequisite for further intercalibration of all major microfossil groups and refinement of magnetic polar-ity chrons, particularly for the Eocene.
The main focus of this study is to establish a strati-graphic framework based on the identification of the sta-ble long eccentricity cycle (405 kyr; Laskar et al., 2004; Hinnov and Hilgen, 2012) and subsequent detailed orbital tuning of the records. New geochemical records (CaCO3, SiO2, and Fe2O3wt% obtained from calibrated XRF core scanning data; bulk stable isotope data) were generated for Site 1218 and Sites U1333/U1334 spanning magnetic po-larity Chrons C12n–C20n (31–43 Ma). In combination with published data, the phase relationship of stable isotope data to XRF core scanning data is documented, a stratigraphic framework for the Bartonian, Priabonian and early Rupelian
Figure 1.Location map of sites used in this study on 34 Ma
pale-ogeographic reconstruction in Mollweide projection (ODSN, 2011; Hay et al., 1999) and detailed location map in the Pacific (big map, red stars) with additional IODP/ODP/DSDP sites. F.Z. = fracture zone (modified from Pälike et al., 2010).
Stages in the equatorial Pacific established and subsequently orbital tuning applied to the records. In this way, a fully inte-grated and astronomically calibrated bio-, chemo-, and mag-netostratigraphy for the equatorial Pacific from 31 to 43 Ma is now provided.
2 Material and methods
In addition to the new data from the PEAT records, published data from Site 1052 (ODP Leg 171B – Blake Nose, Atlantic margin of northern Florida; Pälike et al., 2001), Hole 1172A (ODP Leg 189 – East Tasman Plateau; Röhl et al., 2004), and Site 1260 (ODP Leg 207 – Demerara Rise; Westerhold and Röhl, 2013) were reinvestigated. With respect to the depth scale nomenclature “rmcd (revised CCSF-A)” is used for the revised composite core depth below seafloor at Site U1333 and U1334, and “rmcd” is used for revised meters composite depth at Site 1218 (for details on depth scale definitions see IODP, 2011 and Westerhold et al., 2012a).
2.1 XRF core scanner data
down-core over a 1.2 cm2 area with a down-core slit size of 10 mm using generator settings of 10 kV, a current of 0.12 mA, and a sampling time of 20 s at the split core sur-face of the archive half. The split core sursur-face was covered with a 4-micron-thin SPEXCerti Prep Ultralene1 foil to avoid contamination of the XRF measurement unit and desiccation of the sediment. Data have been acquired by a Canberra X-PIPS Detector (Model SXP 5C-200-1500 V2) with 200eV X-ray resolution, the Canberra Digital Spectrum Analyzer DAS 1000, and an Oxford Instruments 100W Neptune X-ray tube with rhodium (Rh) target material. Raw data spectra were processed by the Analysis of X-ray spectra by iterative least square software (WIN AXIL) package from Canberra Eurisys. For cores from the Site U1333 splice, a higher en-ergy run with 50 kV, a current of 1.0 mA, a Cu filter, and a sampling time of 30 s was added in order to also record Bar-ium (Ba) intensity variations at 2 cm resolution.
We scanned cores from the revised splice at each site (Westerhold et al., 2012a) with suitable overlaps to test the accuracy of the new composite section. Scanning was un-dertaken on archive halves from Site 1218 covering 201.68– 293.20 rmcd, from Site U1333 covering 102.39–200.43 rmcd (m revised CCSF-A), and from Site U1334 covering 205.05– 341.42 rmcd (m revised CCSF-A). Calcium (Ca) elemental intensity data have been transferred into carbonate wt% us-ing CaCO3values analyzed on discrete samples for calibra-tion purposes (Wilson et al., unpublished). Fe and Si elemen-tal intensity data have been quantified by calibrating normal-ized median scaled (NMS, Lyle et al., 2012) XRF core scan-ning intensity data with ED-XRF analyses (Westerhold et al., unpublished). Calibrated high-resolution XRF core scan-ning intensities are calculated and reported as oxides (SiO2, Fe2O3, CaCO3), but for simplification we use Si, Fe, and Ca in the text. Raw, NMS, and calibrated NMS XRF core scan-ning intensity data are reported in Supplement Tables S1–S4 (Site 1218, 5304 sample points), S5–S8 (U1333, 6835), and S9–S12 (U1334, 8102) (Westerhold et al., 2013).
2.2 Bulk stable isotope data
Stable isotope measurements on 1369 freeze-dried pow-dered bulk sediment samples from Sites U1333 and U1334 were performed on a Finnigan MAT 251 mass spectrome-ter equipped with an automated carbonate preparation line at MARUM, University Bremen. The carbonate was re-acted with orthophosphoric acid at 75◦C. Analytical
pre-cision based on replicate analyses of an in-house standard (Solnhofer Limestone) averages 0.05 ‰ (1σ) for δ13C. All data are reported against VPDB after calibration of the in-house standard with NBS-19. In detail, 461 sam-ples from Site U1333 were processed spanning the interval C15n–C17n.1n (138.71–152.14 rmcd – meter revised CCSF-A) and 908 samples from Site U1334 spanning the inter-val C16n.2n–C18n.1n (314.59–341.44 rmcd – meter revised CCSF-A). Bulk stable isotope data for U1333 and U1334
are reported in Supplement Tables S13 and S14, respec-tively, at http://doi.pangaea.de/10.1594/PANGAEA.821903 (Westerhold et al., 2013).
2.3 Paleomagnetic data Site U1333
The magnetostratigraphy for Site U1333 was originally con-structed from continuous paleomagnetic measurements made every 5 cm along the archive-half sections of all cores col-lected with the advanced piston corer (APC) during Expe-dition 320 (Pälike et al., 2010). Magnetic cleaning typically was limited to alternating field (AF) demagnetization in peak fields of 20 mT, which was shown to be sufficient to remove drilling-related magnetic overprints and to resolve a primary depositional remanence magnetization (Pälike et al., 2010).
To determine the paleomagnetic direction more accurately and the depths of magnetic reversal boundaries more pre-cisely, while also providing relative paleointensity estimates and environmental magnetic records, 169 U-channel samples (2 cm×2 cm×150 cm) were collected continuously along the spliced composite stratigraphic section from 0 to 190 rmcd. Paleomagnetic results from the lower 88 U-channel sam-ples (96–190 rmcd), which provide a magnetostratigraphy that spans from the middle of Chron C11r to within Chron C20n, are presented here. Results for the upper 81 U-channel samples (0–96 rmcd), spanning from the base of Chron C6n to the middle of Chron C11r, are presented in Guidry et al. (2013).
For the interval from 96 to 190 rmcd, each U-channel sam-ple was subjected to progressive AF demagnetization from 0 mT up to 80 or 100 mT typically in 8–11 steps and the magnetic remanence was measured every 1 cm following each step. Paleomagnetic directions were determined from principal component analysis (PCA) in which remanence measurements from at least five demagnetization steps for each interval were fit to lines (Kirschvink, 1980). Linear fits were well constrained, with average maximum angu-lar deviation (MAD) angles of 2.3◦for the 10 896 intervals used in the magnetostratigraphic interpretation (Supplement Fig. S13 and Tables S17–S19). The revised magnetostratig-raphy is derived from the distinct∼180◦alternations in
3 Results
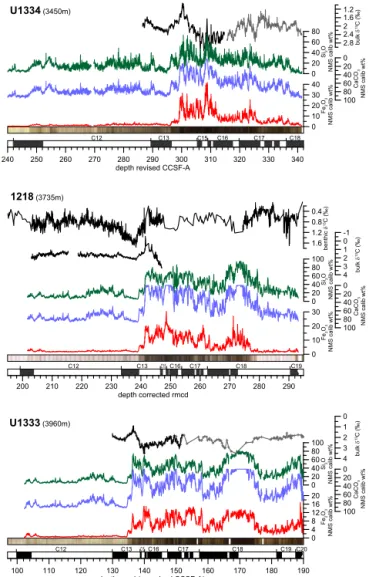
The sediments studied consist of nannofossil ooze or chalk, radiolarite, and claystone (Pälike et al., 2010) and therefore varying amounts of carbonate, opal, and terrigenous mate-rial. Calibrated high-resolution XRF core scanning intensi-ties show highly dynamic wt% values in late Eocene sed-iments and lower amplitude variations in middle Eocene (middle of Chron C18r–C19n) and very early Oligocene (younger than Chron C13r) nannofossil chalks and oozes with CaCO3contents averaging around 75–80 wt% (Fig. 2). The lower amplitude variations correspond to intervals when the CCD was relatively deep in the equatorial Pacific (Lyle et al., 2005; Pälike et al., 2012). Carbonate content drops to near zero at all sites across the C18r–C18n boundary during the peak of the middle Eocene climate optimum (MECO; Bo-haty and Zachos, 2003) and within Chron C15r. Variations in both XRF-derived Si and Fe are anti-correlated to the Ca con-tent except for the MECO interval across the C18n2n–C18r boundary at Site 1218. Fe mainly comes from terrigenous material, whereas the Si signal probably represents a mixture of radiolarian ooze with terrigenous clay. The shallowest Site U1334 contains the highest carbonate content of all PEAT records, but also contains more iron oxide than the other sites because of the relatively higher clay content (Pälike et al., 2010). In contrast, Sites 1218 and U1333 reveal a greater amount of Si averaging 40–45 wt% in the late Eocene, drop-ping to∼20 wt% during the Eocene–Oligocene Transition (EOT). The amplitude in sediment composition variations of all elements (or calculated oxides) increase simultaneously at all sites close to the Chron C17r/C18n boundary, are es-pecially pronounced at Site U1334 from the middle of Chron C16n through Chron C13r, and decrease dramatically in two steps across the EOT (Fig. 2) akin to behavior documented in the published record from Site 1218 (Coxall et al., 2005).
The bulk carbon stable isotope data (black curves in Fig. 2) show long-term increases from the top of Chron C18n.1n– C15n, a subsequent strong decrease up to the upper Chron C13r, and the well-known stepped increase across the EOT (Coxall et al., 2005). Pronounced higher frequency variations are related to short (100 kyr) and long (405 kyr) eccentricity cycles as also observed in a latest Eocene to Oligocene ben-thic isotope record from Site 1218 (Pälike et al., 2006).
The phase relation between bulk carbon isotopes and XRF data is not persistent over the studied interval (see next sec-tion) complicating the tuning process. Lower carbon isotope values correspond to higher carbonate, lower Si, and lower Fe contents from the middle of Chron C18r–C15n. For the interval younger than Chron C15n lighter carbon isotope data correspond to lower carbonate, higher Si, and higher Fe. This phase relation, although based on relatively lower resolu-tion stable isotope data, most likely is also present during the interval with high carbonate content from the middle of Chron C18r to the base of Chron C19n. To establish a cy-clostratigraphy, we assume that the phase relation between
C12 C13 C15 C16 C17 C18 C19 C20
100 110 120 130 140 150 160 170 180 190
depth rmcd (m revised CCSF-A) U1333 (3960m)
0 4 8 12 16 20 F e2 O3 N M S calib wt % 0 20 40 60 80 100 Si2 O N M S calib w t% 100 80 60 40 20 0 C a C O3 N M S calib wt % 4 3 2 1 0 b ul k δ 1 3C ( ‰ )
240 250 260 270 280 290 300 310 320 330 340
depth revised CCSF-A
C12 C13 C15 C16 C17 C18
1.2 1.6 2 2.4 2.8 bu
lk δ 1 3C ( ‰ ) 0 10 20 30 40 F e2 O3 N M S calib wt % 100 80 60 40 20 0 C a C O3 N M S calib wt % 0 20 40 60 80 Si 2 O N M S calib w t%
U1334 (3450m)
C12 C13 C15 C16 C17 C18 C19
200 210 220 230 240 250 260 270 280 290
depth corrected rmcd
0 10 20 30 F e2 O3 N M S calib wt % 100 80 60 40 20 0 C a C O3 N M S calib wt % 0 20 40 60 80 100 Si 2 O N M S calib w t% 4 3 2 1 0 -1 b ul k δ 1 3C ( ‰ ) 1.6 1.2 0.8 0.4 benth ic δ 13C (‰ )
1218 (3735m)
Figure 2.Overview of data from ODP Site 1218 and IODP Sites
U1333/U1334 in the depth domain (in brackets the water depth of each site at 34 Ma; Pälike et al., 2010). The plots show stable carbon isotope data (black, gray), normalized median scaled (NMS) wt% based on calibrated XRF core scanning data for Si (green), Ca (blue), and Fe (red) (for details see methods chapter), spliced core image, and magnetic polarity reversal pattern transferred to 1218 and U1334 by correlation to U1333 (Pälike et al., 2010; Westerhold et al., 2012a). Data sources: all XRF core scanning data from this
study; bulkδ13C U1334 from Wilson et al. (unpublished) (black)
and this study (gray), 1218 from Coxall et al. (2005) (black), U1333 from Wilson et al. (unpublished) (black), and Leon-Rodriguez and
Dickens (2013) (gray); benthic (Cibicidoidesspp.)δ13C of 1218
from Lear et al. (2004), Coxall et al. (2005), Tripati et al. (2005), and Coxall and Wilson (2011).
4 Cyclostratigraphic framework
Constructing a cyclostratigraphy in late Eocene sediments is quite challenging because relatively strong changes in the CCD and accumulation rates indicates a highly dy-namic environment between∼39 and∼33 Ma (Moore and Kamikuri, 2012; Pälike et al., 2010, 2012). Reworking of ra-diolarians at Sites 1218 and U1333 in the interval from Chron C17r to the EOT poses an additional problem (Moore Jr., 2013); however, Site U1334 provides a reliable record be-cause it is much less affected by reworking then the other two sites. The initial goal is to identify the long eccentricity cycle in the data series and undertake a basic orbital tun-ing to the La2011 eccentricity solution. To aid inspection of the proposed correlation to the La2011 solution long and short eccentricity cycles have been counted and a ing scheme applied (see Supplement Fig. S8). The number-ing scheme for the long eccentricity cycles (405 kyr) follows the approach of Wade and Pälike (2004), where eccentricity maxima are counted back in time (see Hinnov and Hilgen, 2012). The short eccentricity cycle (100 kyr) count numbers are defined as positive numbers in the Oligocene and negative numbers in the Eocene with the Eocene–Oligocene bound-ary defined as the starting point. Highly variable sedimenta-tion rates mean that it is not a straightforward task to assign the short eccentricity cycle across all sites and throughout the sections. However, the integrative approach of consider-ing three sites with multiple data records at least allows cor-relation of cyclostratigraphic interpretations between sites. Time-series analysis was applied as in Westerhold and Röhl (2009). Evolutionary wavelet power spectra (Wavelet soft-ware was provided by C. Torrence and G. Compo at http: //paos.colorado.edu/research/wavelets) were computed for the bulk stable δ13C data from Sites U1333 and U1334 (Supplement Fig. S1), and the calibrated Si, Fe, and Ca XRF core scanning data from Sites 1218, U1333, and U1334. All records are analyzed in the depth domain, and in the time domain only using magnetostratigraphy (Supplement Table S16). Because the correlation between sites can be done with high accuracy and precision (Westerhold et al., 2012a), magnetostratigraphy from U1333 is transferred or mapped to 1218 and U1334. This enables to identify the pe-riod of prominent cyclicity at all three PEAT records and evaluate the error in astronomically tuned ages for magne-tochron boundaries. Due to the prominent change in lithol-ogy and accumulation rate at the EOT wavelet power spectra for the Oligocene (Supplement Figs. S2–S4) and the Eocene intervals (Supplement Figs. S5–S7) were calculated sepa-rately. For clarity of presentation time series were divided into four intervals.
4.1 Chron C12r–C13n – early Rupelian
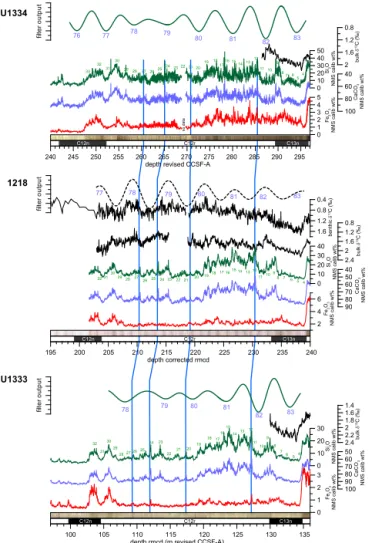
The cyclostratigraphy of the carbonate-rich interval from the base of Chron C12n to the base of Chron C13n was previ-ously constrained by the 405 kyr cycles in the benthic stable isotope record from Site 1218 (Coxall et al., 2005; Wade and Pälike, 2004; Pälike et al., 2006; Coxall and Wilson, 2011) (Fig. 3). Improvements in the composite section (Westerhold et al., 2012a, Supplement Fig. S9) in this interval permit re-tuning the Site 1218 records resulting in smoother sedimen-tation rates than originally published (Pälike et al., 2006). The 405 kyr cycle is apparent in the Site 1218 benthicδ13C record with a period of∼6 m, in Site U1334 Si data with a period of∼7 m, and in Site U1333 Si data with a period of
∼5 m (Fig. 3; Supplement Fig. S2). These periods can also be observed in the Ca record (Supplement Fig. S4). Low-Fe contents mean that cyclicity is less visible in the Fe records (Fig. 3) at sites 1218 and U1333 than at Site U1334. Long and short eccentricity minima (lighter values) in benthic and bulkδ13C correspond to Si and Fe maxima. Based on the pat-tern comparison between the La2011 solution and the benthic
δ13C record from Site 1218, we arrive at the same correlation of the stable 405 kyr cycle as Pälike et al. (2006) with Chron C12r and C13n spanning cycles 78–83. The short eccentric-ity cycles are clearly present in the lower part of Chron C12r and the upper part of Chron C13n, where amplitudes in Si and Ca data are more pronounced. In the upper part of Chron C12r these cycle are present but less evident. We have ten-tatively identified these short eccentricity cycles and corre-lated them to La2011 (green numbers in Fig. 3). Four ash layers can be traced at all three sites and were used as inde-pendent correlation features (Kuroda and Westerhold, 2013) to further guide correlation.
4.2 Chron C13n–C15r – Eocene–Oligocene Transition (EOT)
C12r
C12n C13n
79 80 81
82 83
78
654 7 8 12 11 9 10 15 24 23 21 20 19 1817 1413 22 16 29
28 2726 25 30 31 32 fi lt e r o u tp u t
100 105 110 115 120 125 130 135
depth rmcd (m revised CCSF-A)
0 1 2 3 0 10 20 30 100 90 80 70 60 50 2.4 2.2 2 1.8 1.6 1.4 U1333 F e2 O3 N M S calib wt % Si2 O N M S calib w t% C a C O3 N M S calib wt % b ul k δ 1 3C ( ‰ ) fi lt e r o u tp u t C12r C12n C13n
79 80 81 82 83
78 77
654 7 8 12
11109 15 24 23 21 20
1918 17 14 13 22
16 292827
2625 30 31 32 2.4 2 1.6 1.2 0.8 1.6 1.2 0.8 0.4
195 200 205 210 215 220 225 230 235 240
depth corrected rmcd
2 4 6 90 80 70 60 50 40 0 10 20 30 40 1218 F e2 O3 N M S calib wt
% Ca
C O3 N M S calib wt % Si2 O N M S calib w t% b ul k δ 13C ( ‰ ) benth ic δ 13C (‰ ) C12r C12n C13n 79
80 81 82 83
78 77 76
240 245 250 255 260 265 270 275 280 285 290 295
depth revised CCSF-A
0 1 2 3 4 5 0 10 20 30 40 50 100 80 60 40 no data 6 54 7 8 12 11 9 10 15 24 23 21 20
1918 17 14 13 22
16 292827 2625
30 31 32 33 fi lt e r o u tp u t U1334 2 1.6 1.2 0.8 b u lk δ 1 3C ( ‰ ) F e2 O3 N M S calib wt
% Ca
C O3 N M S calib wt % Si2 O N M S calib w t%
Figure 3.High-resolution XRF core scanning data, bulk and
ben-thic stable carbon isotope data, core images and cyclostratigraphy from Chron C12n to C13n for Sites U1334, 1218, and U1333 in the depth domain. For details see captions of Fig. 2. Blue lines mark early Oligocene ash layers apparent in all three sites (Kuroda and and Westerhold, 2013). Numbers represent the assigned short (green) and long (blue) eccentricity cycle maxima positions in the orbital solution (see Supplement Fig. S8). Band pass filters: for Site U1334 from Si data (0.14±0.042 cycle meter−1(c m−1), 7.2 m band in Supplement Fig. S2a), for Site 1218 from benthic stable car-bon isotope data (0.164±0.049 c m−1), and for Site U1333 from Si data (0.2±0.06 c m−1; 5 m band in Supplement Fig. S2c).
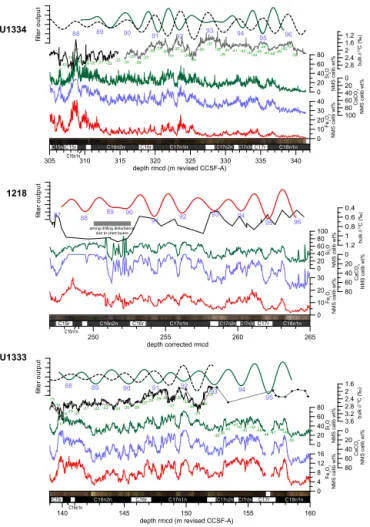
4.3 Chron C15n–C17r – middle Priabonian to late Bartonian
The combination of records from three equatorial Pacific sites (Fig. 5) with the ODP Site 1052 section (Fig. 6, Pälike et al., 2001) allows definition of a cyclostratigraphic framework for Chrons C15n through C17r (covering long eccentricity cycles 88–95). In this interval the bulk δ13C and Si data from Sites U1333 and U1334 best resolve the 405 kyr cyclic-ity. Site 1218, however, suffers from an overall lower sedi-mentation rate in combination with strong carbonate
dissolu-U1333 1218 U1334
C13r
C13n C15n C15r C16n1n
fi lt e r o u tp u t 0 4 8 12 16 0 20 40 60 80 100 80 60 40 20 0
84 85 86 87 88
2.8 2.4 2 1.6 1.2 135 140
depth rmcd (m revised CCSF-A)
133 134 136 137 138 139 141
4 -17 3 -11 -10 -9 -8 -7 -6 -5 -4 -3 -1 1 2 -12 -13 -14 -15 -16 -2 -18 F e2 O3 N M S calib wt % Si2 O N M S calib w t% C a C O3 N M S calib wt % b ul k δ 1 3C ( ‰ ) C13r
C13n C15n C15r C16n1n
fi lt e r ou tpu t 0 10 20 30 100 80 60 40 20 0 0 20 40 60 80 100 3 2 1 0 1.2 0.8 0.4 0
240 245 250
depth corrected rmcd 4 -17 3 -11 -10 -9 -8 -7 -6 -5 -4 -3 -1 1 2 -12 -13 -14 -15 -16 -2
84 85 86 87 88
F e2 O3 N M S calib wt
% Ca
C O3 N M S calib wt % Si2 O N M S calib w t% b ul k δ 13C ( ‰ ) benth ic δ 13C (‰ ) C13r
C13n C15n C15r C16n1n
fi lt e r o u tp u t 0 10 20 30 40 0 20 40 60 80 100 80 60 40 20 0 87 84 86 85 88
295 300 305 310
depth rmcd (m revised CCSF-A) 4 -17 3 -11 -10 -9 -8 -7 -6 -5 -4 -3 -1 1 2 -12-13 -14-15 -16 -2
-18 2 .82 .4
2 1 .6 1 .2 b u lk δ 1 3C ( ‰ ) F e2 O3 N M S calib wt
% Ca
C O3 N M S calib wt % Si2 O N M S calib w t%
Figure 4.High-resolution XRF core scanning data, bulk and
ben-thic stable carbon isotope data, core images, and cyclostratigra-phy from Chron C13n to C15r for Sites U1334, 1218, and U1333 in the depth domain. For details see caption of Fig. 2. 405 kyr
band pass filters: for Site U1334 from Si data (green line; 0.34±
0.102 c m−1; 2.95 m band in Supplement Fig. S5a) and bulk
sta-ble carbon isotopes (dashed black line; 0.33±0.099 c m−1; 3.03 m
band in Supplement Fig. S1a); for Site 1218 from Si data (0.42±
0.126 c m−1; 2.38 m band in Supplement Fig. S5b); for Site U1333
from Si data (green, 0.82±0.25 c m−1; 1.22 m band in Supplement Fig. S5c) and bulk stable carbon isotopes (dashed black line; 0.82±
0.25 c m−1; 1.22 m band in Supplement Fig. S1b). Blue line marks
the Eocene–Oligocene boundary (defined as 14 % down in C13r– C13r.14).
re-C16r C16n1n
C18n1n C16n2n C17n1n C17n2nC17n3n
C15r C17r
140 145 150 155 160
depth rmcd (m revised CCSF-A)
0 4 8 12 16 0 20 40 60 80 80 60 40 20 0 3.6 3.2 2.8 2.4 2 1.6 fi lt e r o u tp u t
88 89 90 91 92
93 94 95 -20 -19 -18 -17
-21-22-23 -24-25-26 -29 -38 -37 -35 -34 -33 -32 -31 -28 -27 -36 -30 -46 -45 -44 -43 -42 -41 -40 -39 -16 -48 -47 -49 -50 -15 U1333 F e2 O3 N M S calib wt % Si2 O N M S calib w t% C a C O3 N M S calib wt % b ul k δ 13C ( ‰ ) C16r
C16n2n C17n1n C17n2n C17n3nC17r C18n1n
C15r C16n1n
250 255 260 265
depth corrected rmcd
0 10 20 30 80 60 40 20 0 0 20 40 60 80 100 1.2 1 0.8 0.6 0.4 fi lt e r o u tp u t
87 88 90
91 92
93 94 95 89
96
strong drilling disturbance due to chert layers 1218 F e2 O3 N M S calib wt
% Ca
C O3 N M S calib wt % Si2 O N M S calib w t% b ul k δ 1
3C (
‰
)
C16r
C16n2n C17n1n C17n2n C17n3nC17r C18n1n
C15r C16n1n
C15n
305 310 315 320 325 330 335 340
depth rmcd (m revised CCSF-A)
0 10 20 30 40 0 20 40 60 80 100 80 60 40 20 0
88 89 90 91 92 93 94 95 96 -19 -18 -17 -16 -20 -21 -25 -24 -22-23 -28 -37 -36 -34 33 -32 -31 -30 -27 -26 -35 -29 -46 -45 -43 -42 -41 40 -39 -38 -15
-44-47-48-49 -50-51 -52 fi lt e r o u tp u t 2.8 2.4 2 1.6 1.2 U1334 b u lk δ 1 3C ( ‰ ) F e2O 3 N M S calib wt
% Ca
C O3 N M S calib wt % Si 2O N M S calib w t%
Figure 5.High-resolution XRF core scanning data, bulk and
ben-thic stable carbon isotope data, core images, and cyclostratigraphy from Chron C15r to C18n.1n for Sites U1334, 1218, and U1333 in the depth domain. For details see caption of Fig. 2. 405 kyr
band pass filters: for Site U1334 from Si data (green line; 0.26±
0.075 c m−1; 3.85 m band in Supplement Fig. S5a) and bulk
sta-ble carbon isotopes (dashed black line; 0.26±0.075 c m−1; 3.85 m band in Fig. S1a); for Site 1218 from Fe data (0.48±0.14 c m−1; 2.08 m band in Fig. S6b); for Site U1333 from Si data (green, 0.43±0.13 c m−1; 2.33 m band in Fig. S5c) and bulk stable car-bon isotopes (dashed black line; 0.43±0.13 c m−1; 2.33 m band in Supplement Fig. S1b).
spectively (Fig. 5, Supplement Fig. S1). In this time interval the long eccentricity-related lower values in bulkδ13C cor-respond to Si and Fe minima and Ca maxima (Fig. 5). The cyclostratigraphy based on theδ13C data from Sites U1334 and U1333 is consistent with the extracted cyclicity in the Fe record from Site 1218. At Site U1334 a shift in phase relation occurs at 317 rmcd (m revised CCSF-A) close to the base of C16n.2n. This shift is not observed at Sites U1333 and 1218, which indicates that the cyclostratigraphy for Chron C16 may remain indistinct.
Although ODP Site 1052 has poor quality shipboard pa-leomagnetic data (Shipboard Scientific Party, 1998)
shore-C16r
C16n2n C17n1n C17n2n C17n3n C17r C18n1n
C15r C16n1n
0 10 20 30 40 50 60 70 80 90 100 110 120 depth (rmcd) fi lt e r o u tp u t 0 20 40 60 Ca/Fe
88 89 90 91 92 93 94 95
-20 -19 -18
-17 -21 -22 -25-26
-23-24 -29
-38 -37 -35 -34 -33 -32 -31 -28 -27 -36 -30 -46 -44 -43 -42 -41 -40 -39 -16 -45 -47 obliquity dominated 1052 ? inclination -90 0 90
Figure 6.Cyclostratigraphy from Chron C15r to C18n.1n for ODP
Site 1052 in the depth domain. Ca/Fe data, revised depth scale and
paleomagnetic reversal pattern with errors from Pälike et al. (2001), inclination data from Ogg and Bardot (2001). Numbers represent the assigned short (green) and long (blue) eccentricity cycle maxima positions in the orbital solution (see Supplement Fig. S8). Band pass filters: 405 kyr filter in black (0.09±0.027 c m−1); 100 kyr filter in green (0.32±0.096 c m−1). Please note the strong obliquity com-ponent present from 10 to 30 rmcd in the 1052 sedimentary record.
based work could identified the position of magnetochrons C16r, C17r, and C18r (Ogg and Bardot, 2001; Fig. 6). After revision of the depth scale, Pälike et al. (2001) re-evaluated the data and presented a more detailed magnetic stratigra-phy spanning from C15r down to C18n.2n (Fig. 6). Because the shipboard data are of poor quality, we consider the mag-netic stratigraphy at 1052 only reliable for base C16n.2n, top C17n.1n, base C17n.3n, and top C18n.1n based on the shore-based data of Ogg and Bardot (2001). The chron-boundary C15r–C16n.1n is likely documented around 12 rmcd in the 1052D shipboard data but not backed up by shore based sam-ples. Thus we assume that Chron C16 ends above∼14 rmcd. The XRF core scanning data (Pälike et al., 2001) show well expressed eccentricity-modulated precession cycles (except for a∼600 kyr period in the upper part of Chron C16n with obliquity dominance) (Fig. 6). The long eccentricity cycle at Site 1052 encompasses ∼11 m intervals in the Ca/Fe XRF core scanning data. The obliquity-dominated interval in C16n (Pälike et al., 2001) lies within cycle 88 and upper cycle 89.
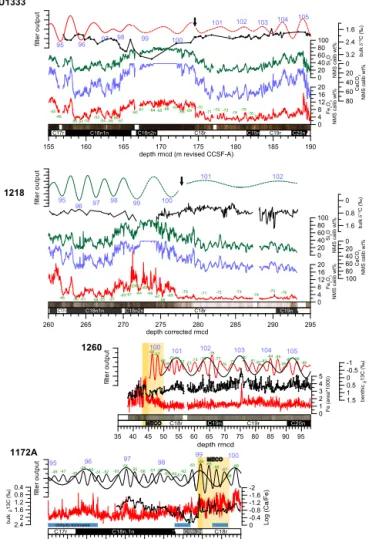
4.4 Chron C17r–C20n – Bartonian to late Lutetian To establish a reliable cyclostratigraphy for equatorial Pa-cific sites covering Chron C17r through C20n data from Sites 1218 and U1333 have been integrated with records from Site 1260 (ODP Leg 207, Demerara Rise; Westerhold and Röhl, 2013) and Hole 1172A cyclostratigraphies (ODP Leg 189, East Tasman Plateau, Röhl et al., 2004) (Fig. 7). This step is needed because of strong dissolution during the MECO (Bohaty and Zachos, 2003) interval (∼170 rmcd in the Site U1333 record and ∼273 rmcd in the Site 1218 section) at both PEAT sites, the lack of high-quality, high-resolution stable isotope data for the entire interval, and pronounced changes in sedimentation rate between the short eccentricity cycle−70 and−69.
The magnetostratigraphy for ODP Site 1260 first was de-velop by the Shipboard Scientific Party (2004) and then re-fined by shore-based discrete samples (Suganuma and Ogg, 2006). Additionally, Edgar et al. (2007) analyzed a total num-ber of 100 samples at 20–30 cm resolution across each of the magnetic reversals using the same method of “polarity rating” from rotary cores where the magnetic overprint is used to determine declination (and hence polarity) in the low-paleolatitude (low inclination) data.
The shipboard data magnetic stratigraphies at ODP Site 1172 in the relevant interval (Fig. F19, in Shipboard Sci-entific Party, 2001) indicates very poorly defined magnetic stratigraphy. Despite this difficulty Fuller and Touchard (2004) identified the positions of the top of C18n.1n, top of C18n.2n, and base C18n.2n for Site 1172A. Subsequently, the reversal pattern was slightly revised in Röhl et al. (2004, see Fig. 6 therein) and used for cyclostratigraphy. Based on the shipboard inclination data (Supplement Fig. S10) only the top C18n.1n can be identified reliably. Base of C18n.1n and the boundaries of C18n.2n cannot be defined in 1172A based on these data. Compilation of bio-, chemo-, and mag-netostratigraphic data for the time encompassing the mid-dle Eocene climate optimum (MECO; Bohaty et al., 2009) showed that the distinct carbon isotope excursion (CIE) at the end of the MECO is close to the base of C18n.2n. Compar-ison of bulk stable carbon isotope data from 1172A (Bijl et al., 2010) with the magnetostratigraphy (Edgar et al., 2010) and bulk stable carbon isotope data of Site 1051 (Bohaty et al., 2009) (Supplement Fig. S10) suggests that the base of C18n.2n in 1172A should be indeed located at around 415 m b.s.f. (metres below seafloor) as proposed by Fuller and Touchard (2004). However, the exact astronomical cal-ibration of the base of C18n.2n using 1172A is not reliable and needs to be refined by other records. Due to the good correlation of the CIE in the peak-MECO and the base of C18n.2n (Bohaty et al., 2009; Supplement Fig. S10) in var-ious records, a relatively good estimate for the duration of C18n can still be achieved on the eccentricity level.
3.2 2.4 1.6
C17r C18n1n C18n2n C18r C19n C19r C20n
95 96 97
98 99 100
101 102 103 104 105
155 160 165 170 175 180 185 190
depth rmcd (m revised CCSF-A)
-51 -52-53-54 -55-56-57
-60-61-64 -65 -66-67
-68 -70
-69 -71-72 -73-74-75
-77 -76 -46 -45 -50 0 4 8 12 16 20 0 20 40 60 80 100 80 60 40 20 0 fi lt e r o u tp u t U1333 ? F e2O 3 N M S calib wt % C a C O3 N M S calib wt % Si 2O N M S calib w t% b ul k δ 13C ( ‰ ) 0 4 8 12 16 20 100 80 60 40 20 0 0 20 40 60 80 100 0 0.8 1.6 fi lt e r ou tpu t
C17r C18n1n C18n2n C18r C19n
95
96 97 98 99 100
101 102
260 265 270 275 280 285 290 295
depth corrected rmcd
-74 -75 -76
-73 -72 -71 -70 -69 -64 -65 -66 -67 -68 -60-61 -62/63 -57 -54 -55 -50 -51 -46 1218 F e2 O3 N M S calib wt % Si2 O N M S calib w t% C a C O3 N M S calib wt % b ul k δ 13C ( ‰ )
MECO C18r C19n C19r C20n 35 40 45 50 55 60 65 70 75 80 85 90 95
depth rmcd fi lt e r ou tpu t 1260 0 1 2 3 4 5 Fe (area*1000) 1.5 1 0.5 0 -0.5 -1 b e n th ic δ 1 3 C (‰)
100 101 102 103 104 105
-84 -75 -76 -85 -72 -71 -70 -69 -77
-78-79-80-81
-86-87 -88-89
-82-83 -74 -73 -68 -67 -66 MECO C18n.2n C18n.1n C17r C18r fi lt e r o u tp u t 0 -0.4 -0.8 -1.2 -1.6 -2 -54 -63 -62 -53 -48 -47 -46 -69 -61 -60 -59 -58 -57 -52 -51 -50 -49 -56 -55 -64-65 -68 -67 -66 obliquity dominated
95 96 97 98
99 100 1172A Log (Ca/Fe) 2.4 2 1.6 1.2 0.8 0.4 bulk δ 1 3 C (‰) ?
Figure 7.High-resolution XRF core scanning data, bulk and
ben-thic stable carbon isotope data, core images, and cyclostratigra-phy from Chron C18n.1n to C20n for Sites U1333, 1218, 1260, and Hole 1172A in the depth domain. For details see caption of Fig. 2. ODP Site 1260 XRF Fe intensity data from Westerhold and Röhl (2013), benthic stable isotope data, and magnetostratig-raphy from Edgar et al. (2007). ODP 1172A XRF data from Röhl
et al. (2004), bulkδ13C data from Bijl et al. (2010). Extend of
the MECO is marked by a light orange bar and the carbon iso-tope excursion at the end of the MEO is marked by a orange bar in 1260 and 1172A (for correlation details see Supplement Fig. S10). Arrows mark change in phase relation between stable isotope and XRF core scanning data. 405 kyr band pass filters: for
Site U1333 from Fe data (155–165 rmcd 0.36±0.110 c m−1; 165–
At Sites 1260 and 1172, the∼10 m long-eccentricity cy-cles can be extracted from benthic isotope data (Edgar et al., 2007) and XRF core scanning Ca/Fe data (Röhl et al., 2004). This provides a solid framework for Chron C18 and C19 spanning long eccentricity cycles 96–105 (Supplement Fig. S8). At Sites 1218 and U1333 the long eccentricity cycle can be identified in Si and Fe data as far as Chron C18n.1r with a length of ∼2.4 and ∼2.8 m, respectively (Fig. 7, Supplement Figs. S5 and S6). The sparse stable iso-tope data available for this interval still suggest that the phase relation to Si, Fe, and Ca is the same as in the previously discussed interval. Thus, for the interval from short eccen-tricity cycle −45 to −69 we assumed the same phase re-lation and tried to identify the 405 kyr cycles by correlat-ing the equatorial Pacific records to those from Sites 1260 and 1172. At Site 1218 the sedimentation rates drop from
∼1.5 to ∼0.5 cm kyr−1 and at Site U1333 from
∼1.0 to
∼0.5 cm kyr−1 (Supplement Fig. S11) during short eccen-tricity cycle−70 leading into the MECO. According to depth backtracking Site 1218 (3152 m b.s.l.) was almost 400 m shallower than Site U1333 (3533 m b.s.l.) during the top of Chron C19n (Pälike et al., 2010), which may explain why the sedimentation rate at Site 1218 is much higher than at Site U1333. The correlation suggests that the 405 kyr cycle in the Site 1218 record has a length of∼9.1 m starting at C19n to short eccentricity cycle−70, and∼4.5 m from there up to the top of C18n.2n (Fig. 7). At Site U1333 the 405 kyr cycle has a length of ∼2.7 and ∼4.0 m in the respective intervals. This implies an increase in sedimentation rates at Site U1333 during the MECO that is not visible in the Site 1218 record. However, the MECO interval was only cored in a single hole at Site U1333 (Westerhold et al., 2012a). The high sedimentation rates could be an artifact if the upper part of Core U1333A-18X covering the MECO was artificially stretched by coring.
In order to compare the geological data with orbital so-lutions and subsequently anchor the floating 405 kyr strati-graphic framework in absolute time by orbital tuning, the ob-servation of a dominant obliquity component in Hole 1172A (Röhl et al., 2004) during long eccentricity cycles 95 and 96 as well as between cycle 99 and 100 (Fig. 7) is very impor-tant. As observed in the early to middle Eocene at ODP Site 1258 (Westerhold and Röhl, 2009) an orbital configuration of low eccentricity in combination with high obliquity ampli-tudes during 2.4 myr eccentricity minima could have fostered the development of obliquity-dominated intervals. Therefore, the dominant obliquity component intervals in 1172A can help to identify the position of 2.4 myr eccentricity cycle minima in the geological data and are important features for evaluating the accuracy of orbital solutions for eccentricity.
5 Astronomical tuning
Astronomical tuning, the correlation of cyclic variations in the geological record to astronomical computations of solar insolation on Earth, depends on the accuracy of the orbital target curves and the completeness of the geological data set to be calibrated. Because of uncertainties in radioisotopic dating (Westerhold et al., 2012b) and limits of astronomi-cal astronomi-calculations (Laskar et al., 2004, 2011a, 2011b) first an independent stratigraphic framework based on the identifi-cation of the stable long eccentricity cycle was developed. Subsequently, the geological data of Sites 1218, U1333, and U1334 were tuned to the La2011 orbital solution for Earth’s eccentricity starting in the early Oligocene, which has been anchored to the astronomically tuned Neogene timescale (Lourens et al., 2004; Pälike et al., 2006).
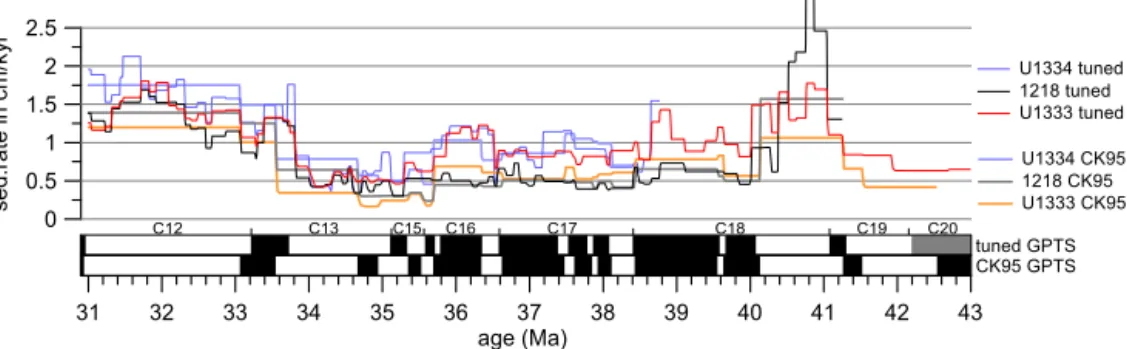
The strength of obliquity cycles in the Ca/Fe data series from Site 1052 (Pälike et al., 2001) (Fig. 6) in Hole 1172A (Röhl et al., 2004) (Fig. 7) during minima in the 2.4 myr ec-centricity cycle at 35.4 Ma (cycle 88) and 38.2 Ma (cycle 95) suggests that orbital solutions and geological data are consis-tent with one another for this time interval. For consistency in orbital tuning procedures an astronomical target curve com-bining eccentricity, tilt, and precession (ETP) was used as de-scribed in Pälike et al. (2006). The La2011 eccentricity and the La2004 values for precession and obliquity were applied. Basically, the La2011 and La2004 eccentricity solutions are almost identical up to 42 Ma with only minor deviations in the 2.4 myr eccentricity minima (Westerhold et al., 2012b). Currently there is no precession and obliquity target avail-able based on La2011, thus the availavail-able curves were com-bined. To achieve a consistent age model between all sites all available information were utilized and age tie points for each site defined separately. This way an accurate astronom-ically calibrated timescale for the middle Eocene to early Oligocene (31–43 Ma) interval for the PEAT sites and Site 1218 (age tie points are given in Supplement Table S15) was developed. Sedimentation rates based on the astronomical calibration are relatively smooth (Fig. 8). New age estimates and durations for the geomagnetic polarity timescale are pre-sented in Tables 1 and 2 (detailed PEAT magnetostratigraphy in Supplement Table S16) and discussed below.
6 Discussion
31 32 33 34 35 36 37 38 39 40 41 42 43 age (Ma)
0 0.5 1 1.5 2 2.5
sed.rate
in
c
m
/k
y
r
U1334 tuned 1218 tuned U1333 tuned
U1334 CK95 1218 CK95 U1333 CK95
C12 C13 C15 C16 C17 C18 C19 C20
tuned GPTS CK95 GPTS
Figure 8.Sedimentation rate estimate in cm kyr−1based on astronomical tuning compared with paleomagnetic based estimates using the
timescale of Cande and Kent (1995, CK95). For reference the CK95 and tuned GPTS (this study) are drawn.
43 42 41 40 39 38 37 36 35 34 33 32 31 30
ag
e
(M
a
)
CK95 GPTS
2004
GPTS 2012
P06 PEAT
sites ODP 1260 1052
E/O
C11
C12
C13
C15
C16
C17
C18
C19
C20
405-kyr cycle
75 76 77 78 79 80 81 82 83 84 85 86 87 88 89 90 91 92 93 94 95 96 97 98 99 100 101 102 103 104 105 106
Figure 9.Comparison of magnetochron boundary ages and
dura-tions for Chron C12 to C19 based on estimates from Cande and Kent (1995; CK95), Ogg and Smith (2004; GPTS 2004), Pälike et al., (2006; P06), Ogg (2012; GPTS 2012), Pacific Equatorial Age Tran-sect (PEAT; this study), and combined ODP Sites 1052 and 1260 (this study). Orange lines track changes between different estimates. Calibration points with error bar used by CK95, GPTS2004 and GPTS2012 are plotted in red dots. Also given is the respective ab-solute age of the Eocene–Oligocene boundary (E–O; blue line) and the long eccentricity cycle number for reference (see Supplement Fig. S8).
identification of the stable long eccentricity cycle (405 kyr) in deep-sea records for the middle Eocene to early Oligocene (31–43 Ma).
6.1 Duration of magnetochrons and comparison to standard geomagnetic polarity timescales
This new stratigraphic framework provides estimates of the absolute ages of magnetic polarity Chrons C12r–C20n and
their positions in the 405 kyr cycle number scheme. Based on the multiple site approach the data set can be consid-ered stratigraphically complete to the long eccentricity cy-cle level. Astronomically tuning to the La2011 orbital solu-tion allows to refine age estimates down to the 100 kyr level. The ages of magnetochron boundaries are accurate; only for Chron C15n and the top of C16n.1n does some uncertainty still exist.
In the early Oligocene interval, comparison of the new ages with published GPTS ages (Fig. 9, Table 1) shows that the ages are very close to those derived from previous or-bital tuning of Site 1218 (Pälike et al., 2006) down to the E–O boundary. The GSSP for the Eocene–Oligocene (E– O) boundary in Massignano is defined at the layer hold-ing the extinction of the Hantkeninidae (Premoli Silva and Jenkins, 1993). This group of planktonic foraminifers is not preserved in the investigated equatorial Pacific sites. Be-cause it is currently unknown whether or not the top of the Hantkeninidae is synchronous between the Massignano sec-tion and the equatorial Pacific sites we assume that the E– O boundary occurs 14 % down in Chron C13r (as given in Luterbacher et al., 2004). This results in an astronomically tuned absolute age for the E–O boundary of 33.89 Ma, which is∼100 kyr older than the age in Pälike et al. (2006). Pearson et al. (2008) placed the Hantkenina extinction on theδ18O plateau from Tanzania just afterδ18O step 1. Based on the correlation between the Tanzania record and ODP Site 1218 (Pearson et al., 2008), we arrive at the same age of 33.89 Ma for the E–O boundary in the PEAT sites. This validates the astronomical tuned age from the Massignano, Italy, global stratotype section and point (GSSP) (Brown et al., 2009).
W
esterhold:
Orbitally
tun
ed
timescale
and
astr
onomical
for
cing
965
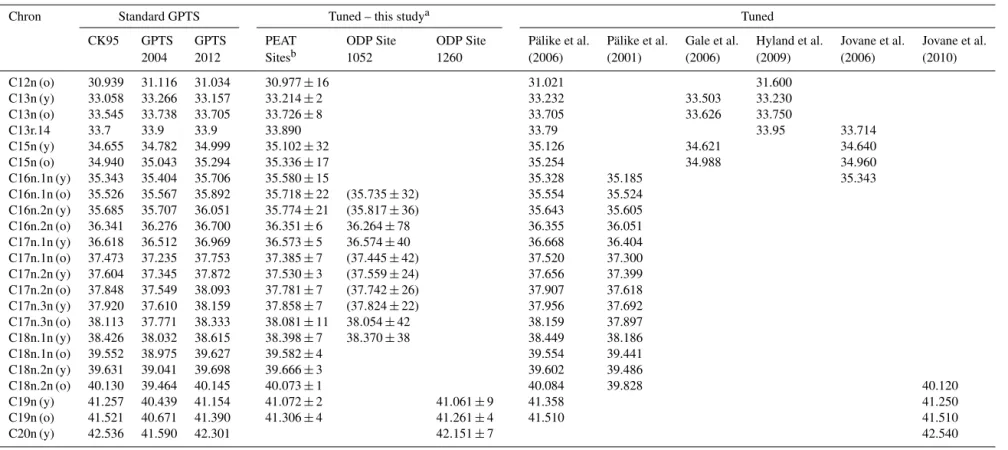
Table 1.Comparison of magnetochron boundary ages in million years. Italicised values: these values are uncertain.
Chron Standard GPTS Tuned – this studya Tuned
CK95 GPTS GPTS PEAT ODP Site ODP Site Pälike et al. Pälike et al. Gale et al. Hyland et al. Jovane et al. Jovane et al.
2004 2012 Sitesb 1052 1260 (2006) (2001) (2006) (2009) (2006) (2010)
C12n (o) 30.939 31.116 31.034 30.977±16 31.021 31.600
C13n (y) 33.058 33.266 33.157 33.214±2 33.232 33.503 33.230
C13n (o) 33.545 33.738 33.705 33.726±8 33.705 33.626 33.750
C13r.14 33.7 33.9 33.9 33.890 33.79 33.95 33.714
C15n (y) 34.655 34.782 34.999 35.102±32 35.126 34.621 34.640
C15n (o) 34.940 35.043 35.294 35.336±17 35.254 34.988 34.960
C16n.1n (y) 35.343 35.404 35.706 35.580±15 35.328 35.185 35.343
C16n.1n (o) 35.526 35.567 35.892 35.718±22 (35.735±32) 35.554 35.524
C16n.2n (y) 35.685 35.707 36.051 35.774±21 (35.817±36) 35.643 35.605
C16n.2n (o) 36.341 36.276 36.700 36.351±6 36.264±78 36.355 36.051
C17n.1n (y) 36.618 36.512 36.969 36.573±5 36.574±40 36.668 36.404
C17n.1n (o) 37.473 37.235 37.753 37.385±7 (37.445±42) 37.520 37.300
C17n.2n (y) 37.604 37.345 37.872 37.530±3 (37.559±24) 37.656 37.399
C17n.2n (o) 37.848 37.549 38.093 37.781±7 (37.742±26) 37.907 37.618
C17n.3n (y) 37.920 37.610 38.159 37.858±7 (37.824±22) 37.956 37.692
C17n.3n (o) 38.113 37.771 38.333 38.081±11 38.054±42 38.159 37.897
C18n.1n (y) 38.426 38.032 38.615 38.398±7 38.370±38 38.449 38.186
C18n.1n (o) 39.552 38.975 39.627 39.582±4 39.554 39.441
C18n.2n (y) 39.631 39.041 39.698 39.666±3 39.602 39.486
C18n.2n (o) 40.130 39.464 40.145 40.073±1 40.084 39.828 40.120
C19n (y) 41.257 40.439 41.154 41.072±2 41.061±9 41.358 41.250
C19n (o) 41.521 40.671 41.390 41.306±4 41.261±4 41.510 41.510
C20n (y) 42.536 41.590 42.301 42.151±7 42.540
aTuned to the orbital solution La2011 (Laskar et al., 2011).
bCombined ages based on Pacific equatorial age transect sites 1218, U1333, and U1334.
Note: ages in brackets for Site 1052 are uncertain due to low-resolution paleomagnetic data.
.clim-past.net/10/955/20
14/
Clim.
P
ast,
10,
955–
973
,
T
.
W
esterhold:
Orbital
ly
tuned
timescale
and
astr
onomical
for
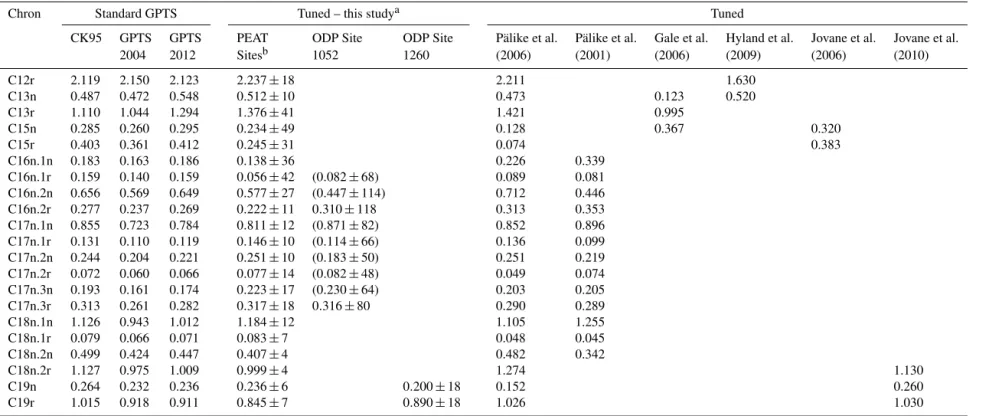
Table 2.Comparison of magnetochron boundary durations in million years. Italicised values: these values are uncertain.
Chron Standard GPTS Tuned – this studya Tuned
CK95 GPTS GPTS PEAT ODP Site ODP Site Pälike et al. Pälike et al. Gale et al. Hyland et al. Jovane et al. Jovane et al.
2004 2012 Sitesb 1052 1260 (2006) (2001) (2006) (2009) (2006) (2010)
C12r 2.119 2.150 2.123 2.237±18 2.211 1.630
C13n 0.487 0.472 0.548 0.512±10 0.473 0.123 0.520
C13r 1.110 1.044 1.294 1.376±41 1.421 0.995
C15n 0.285 0.260 0.295 0.234±49 0.128 0.367 0.320
C15r 0.403 0.361 0.412 0.245±31 0.074 0.383
C16n.1n 0.183 0.163 0.186 0.138±36 0.226 0.339
C16n.1r 0.159 0.140 0.159 0.056±42 (0.082±68) 0.089 0.081
C16n.2n 0.656 0.569 0.649 0.577±27 (0.447±114) 0.712 0.446
C16n.2r 0.277 0.237 0.269 0.222±11 0.310±118 0.313 0.353
C17n.1n 0.855 0.723 0.784 0.811±12 (0.871±82) 0.852 0.896
C17n.1r 0.131 0.110 0.119 0.146±10 (0.114±66) 0.136 0.099
C17n.2n 0.244 0.204 0.221 0.251±10 (0.183±50) 0.251 0.219
C17n.2r 0.072 0.060 0.066 0.077±14 (0.082±48) 0.049 0.074
C17n.3n 0.193 0.161 0.174 0.223±17 (0.230±64) 0.203 0.205
C17n.3r 0.313 0.261 0.282 0.317±18 0.316±80 0.290 0.289
C18n.1n 1.126 0.943 1.012 1.184±12 1.105 1.255
C18n.1r 0.079 0.066 0.071 0.083±7 0.048 0.045
C18n.2n 0.499 0.424 0.447 0.407±4 0.482 0.342
C18n.2r 1.127 0.975 1.009 0.999±4 1.274 1.130
C19n 0.264 0.232 0.236 0.236±6 0.200±18 0.152 0.260
C19r 1.015 0.918 0.911 0.845±7 0.890±18 1.026 1.030
aTuned to the orbital solution La2011 (Laskar et al., 2011).
bDuration based on Pacific equatorial age transect sites 1218, U1333, and U1334.
Note: duration in brackets for Site 1052 are uncertain due to low-resolution paleomagnetic data.
P
ast,
10,
955–
973
,
2014
ww
w
because it uses a relatively young age of 45.60±0.38 Ma for an ash layer in C21n compared to CK95 (Westerhold and Röhl, 2009) and GPTS2012.
The most obvious differences in the age estimates are observed in the late Eocene, namely for Chron C15 and the younger part of Chron C16. The new GPTS as well as Pälike et al. (2006) gives durations for both Chrons C15r and C16n.1r that are shorter than other timescales and gives du-rations for Chron C13r that are longer than other timescales. Pälike et al. (2012) suggested this was related to highly dy-namic variations in the CCD in the equatorial Pacific. Other suitable sites with sufficient high-quality magneto- and cy-clostratigraphy to decipher this part of the timescale fully are not yet available from the deep sea. Two marine sections and one continental section with established magneto- and cy-clostratigraphies are, however, already available for Chron C13r: the Solent Group from the Isle of Wight in the UK (Gale et al., 2006), the Massignano GSSP section in cen-tral Italy (Premoli Silva and Jenkins, 1993; Jovane et al., 2006, Brown et al., 2009), and the lacustrine records from the Xining Basin on the Tibetan Plateau (Dupont-Nivet et al., 2007; Xiao et al., 2010). Both the Solent Group record (Gale et al., 2006) and the Massignano section (Jovane et al., 2006, Brown et al., 2009) suggest that Chron C13r lasted the equivalent of 2.5 long eccentricity cycles or∼1000 kyr. Obliquity-driven cyclicity in physical properties from the Xining basin record imply an even shorter duration, on the order of 800–900 kyr, of Chron C13r (Xiao et al., 2010). This would require that PEAT records overestimate the duration of Chron C13r by∼400 kyr or one long eccentricity cycle. Alternatively, the Solent Group record may be condensed or incomplete in C13n and around the C13r–C15n boundary. A hint for this scenario could be a hiatus in Chron C13n and the fact that the Chron C13r–C15n boundary is characterized only by an incomplete illitic clay cycle.
At the Massignano section uncertainties may lie in the ar-ray of estimated 10–12 m length for Chron C13r (Lowrie and Lanci, 1994). Based on average sedimentation rates of 0.7 cm kyr−1 the dominant cycles in the Massignano sec-tion with lengths of 32, 72, and 284 cm relate to peri-ods of 45, 102, and 405 kyr, respectively (Jovane et al., 2006). These periods and their frequency ratio are diagnos-tic of obliquity and eccentricity related cycles. However, this basic calculation does not account for the range in thick-ness of Chron C13r (10–12 m). Applying 1376 kyr for the duration of Chron C13r (Table 2), sedimentation rates at Massignano would then range between 0.73 cm kyr−1(10 m thickness of Chron C13r) and 0.87 cm kyr−1 (12 m thick-ness of Chron C13r). The cyclicity in the Massignano sec-tion and the 1376 kyr durasec-tion for Chron C13r are most con-sistent with the 10 m estimate of thickness for Chron C13r in the Massignano section. But a duration of 1376 kyr for C13r is not consistent with the interpretation that lacustrine records from the Xining Basin (Xiao et al., 2010) are obliq-uity driven. Chron C15n and C15r are shorter in the PEAT
records than estimated for the Massignano section (Jovane et al., 2006; Brown et al., 2009). Sedimentation rates in-crease during Chrons C15 and C16 in the PEAT record (Fig. 8). In the carbonate record of interval C16n.1n to early Chron C13r at Massignano a temporary shift from obliq-uity to 26–30 kyr cycles occurs and is interpreted as a possi-ble feedback to impact/comet shower related climate change (Brown et al., 2009). If the calculated sedimentation rates of
∼0.8 cm kyr−1is applied, however, the observed 26–30 kyr cycles in the interval from 5.6 to 13 m at Massignano (Brown et al., 2009) becomes∼20 kyr cycles. Although the thick-ness of Chron C15r in the Massignano section is not unam-biguous (Lowrie and Lanci, 1994), this interpretation indi-cates that the duration of Chron C15r should be about a third shorter than the 383 kyr of Jovane et al. (2006). If correct, the duration of C15r is∼250 kyr – as observed at the PEAT sites (214–286 kyr). The 74 kyr estimate of Pälike et al. (2006) is far too short (Westerhold et al., 2012a) as indicated by the unusual sedimentation rate increase in C15 (Supplement Fig. S11). The durations for Chron C16n.1n and C16n.1r are not as well resolved in the PEAT record as in other records studied.
6.2 Paleoceanographic implications
Two prominent features in the PEAT records and the new as-tronomical timescale need to be briefly discussed. One is the change in phase relationship between stable carbon isotope and XRF core scanning data in relation to the short and long eccentricity cycle (see Fig. 10 and Supplement Fig. S12). From 43 Ma, where our study starts, to 40.5 Ma the records are in-phase with low Fe and Si, and with high Ca corre-sponding to lowerδ13C values. The phase relation switches around 40.5 Ma to an anti-phase mode at all three sites and this pattern remains until ∼36 Ma. Due to strong dissolu-tion no distinct reladissolu-tion is observable between 36 and 35 Ma. After ∼35 Ma the records are again in phase. The switch in phase relation of isotopes vs. carbonate content is simi-lar to the shift from the Atlantic-type (high carbonate in in-terglacials) to Pacific-type (high carbonate in glacials) car-bonate stratigraphy observed during the earliest Gauss Mag-netic Chron (3.18–3.41 Ma) in equatorial Pacific sediments (Moore Jr. et al., 1982; Dunn, 1982), close to the onset of northern hemisphere glaciation. The shift in phase relation prior to the EOT could be related to a change in the deep and intermediate water circulation (Katz et al., 2011). This reorganization in ocean circulation is also expressed in the response of the equatorial Pacific to orbital forcing and prob-ably also affected the distribution of nutrients.
The other important feature is the occurrence of an obliquity-dominated cyclicity coinciding with the 2.4 myr eccentricity minima at 35.5 Ma (Site 1052; Pälike et al., 2001; Fig. 6, 405 cycle 88), at 38.3 Ma and 40.1 Ma (both Site 1172, Fig. 7, cycles 95 and 99/100). Prominent obliquity cycles are not present in the PEAT records probably due to their low-latitude setting. At both intervals around 40.1 and 38.3 Ma relatively high amounts of ice-rafted debris (IRD) have been reported from the Greenland Sea Site 913 (Eldrett et al., 2007; Tripati et al., 2008) with an age model approach based on CK95, which is therefore chronologically compa-rable to the PEAT record. At 35.5 Ma an increase in IRD is reported from the same high latitude site (Eldrett et al., 2007) in Chron C15r, coincident with a cooling shift observed at the Southern Ocean Site 689B (Vonhof et al., 2000) and a major sea level fall (Peters et al., 2010). From the new stratigraphic framework defined for the PEAT record, we would hypothe-size that the cooling as reflected by the higher amount of IRD in the Greenland Sea might be fostered by the 2.4 myr eccen-tricity minima at 35.5, 38.3, and 40.1 Ma (405 kyr cycles 88, 95, and 100). The occurrence of contemporaneous obliquity cycles at Sites 1172 and 1052 suggests that to some extent high-latitude processes driven by orbital obliquity strongly influenced ocean circulation during 2.4 myr eccentricity min-ima. Temperatures at high latitudes cool enough to form ice in the Arctic already occurred at 47–46 Ma ago (Stickley et al., 2009; St. John et al., 2008). With decreasing atmospheric CO2(Pearson and Palmer, 2000; DeConto and Pollard, 2003; Pollard and DeConto, 2005) in an environment and aftermath
U1334
U1333 1218
1.2 0.8 0.4 0 -0.4
be
n
th
ic
δ
13
C
(‰
)
E
c
c
en
tr
ic
it
yLa20
1
1
3 2 1 0
b
ul
k
δ
1
3
C
(
‰
)
40
5
k
y
r
fil
te
r
C12 C13 C15 C16 C17 C18 C19 C20
31 32 33 34 35 36 37 38 39 40 41 42 43 age (Ma)
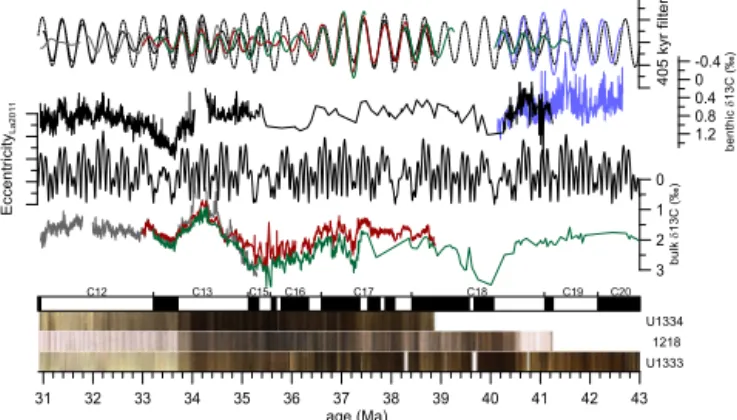
Figure 10.Tuned bulk and benthic stable carbon isotope data
plot-ted against La2011 orbital solution for eccentricity (Laskar et al., 2011b). Bulk data: 1218 (gray; Pälike et al., 2006), U1333 (green; this paper; Wilson et al., unpublished; Leon-Rodriquez and Dick-ens, 2013), U1334 (red; this paper; Wilson et al., unpublished). Benthic data: 1218 (black; Lear et al., 2004; Coxall et al., 2005; Tripati et al., 2005; Coxall and Wilson, 2011), 1260 (blue; Edgar et al., 2007). Long eccentricity (405 kyr) band pass filters of the de-trended, tuned records are plotted on top La2011 (dash line). Mag-netostratigraphy as provided in Table 1 and combined core images from Site U1333, U1334, and 1218 for illustration.
of gateway evolution (Bijl et al., 2013), orbital forcing might have fostered ephemeral ice buildup on Antarctica causing a sea level fall (Peters et al., 2010) and seasonal sea-ice forma-tion in the Arctic. The data presented here from PEAT so far support the suggestion that high-latitude processes had little effect in equatorial regions (Pearson et al., 2007) during the late Eocene.
7 Summary and conclusions
Pacific. The age estimates support the CK95 calibration, are discordant with the GPTS2004 calibration, and reveal a sys-tematic offset of about >300 kyr relative to GPTS2012 for late Eocene reversals from Chron C15r–C17r. The chronol-ogy of changes in the phase relationship in PEAT records be-tween XRF core scanning data and stable carbon isotope data suggests a close linkage to changes in overall deep-ocean cir-culation at 40.5 and 35–36 Ma. The synopsis of the records utilized for the cyclostratigraphy reveals strong obliquity re-lated cycles in middle to high-latitude sites (1052, 1171) dur-ing 2.4 myr eccentricity minima at 35.5, 38.3, and 40.1 Ma.
The Supplement related to this article is available online at doi:10.5194/cp-10-955-2014-supplement.
Acknowledgements. This research used samples and/or data
provided by the Ocean Drilling Program (ODP) and Integrated Ocean Drilling Program (IODP). Data have been acquired in the XRF Core Scanner Lab at the MARUM – Center for Marine Environmental Sciences, University of Bremen, Germany. We thank Monika Segl and her team (MARUM) for stable isotope analysis. We thank Jan Backman, an anonymous reviewer, and Editor Andrea Dutton for thorough reviews and comments in the discussion phase improving the manuscript. Funding for this research was provided by the Deutsche Forschungsgemeinschaft (DFG), NERC, and the National Science Foundation (Grant NSF OCE-0961412). We are indebted to V. Lukies (MARUM) for assisting in XRF core scanning, and the staff at BCR and GCR for core handling. The complete data set presented in this paper is available online in the WDC-MARE PANGAEA database under www.pangaea.de.
Edited by: A. Dutton
References
Bijl, P. K., Houben, A. J. P., Schouten, S., Bohaty, S. M., Sluijs, A., Reichart, G.-J., Sinninghe Damste, J. S., and Brinkhuis, H.:
Tran-sient Middle Eocene Atmospheric CO2and Temperature
Vari-ations, Science, 330, 819–821, doi:10.1126/science.1193654, 2010.
Bijl, P. K., Bendle, J. A. P., Bohaty, S. M., Pross, J., Schouten, S., Tauxe, L., Stickley, C. E., McKay, R. M., Röhl, U., Ol-ney, M., Sluijs, A., Escutia, C., Brinkhuis, H., and Scien-tists, E.: Eocene cooling linked to early flow across the Tas-manian Gateway, P. Natl. Acad. Sci. USA, 110, 9645–9650, doi:10.1073/pnas.1220872110, 2013.
Bohaty, S. and Zachos, J. C.: Significant Southern Ocean warming event in the late middle Eocene, Geology, 31, 1017–1020, 2003. Bohaty, S. M., Zachos, J. C., Florindo, F., and Delaney, M. L.: Coupled greenhouse warming and deep-sea acidifica-tion in the middle Eocene, Paleoceanography, 24, PA2207, doi:10.1029/2008pa001676, 2009.
Bohaty, S. M., Zachos, J. C., and Delaney, M. L.: Foraminiferal Mg/Ca evidence for Southern Ocean cooling across the Eocene– Oligocene transition, Earth Planet. Sc. Lett., 317–318, 251–261, doi:10.1016/j.epsl.2011.11.037, 2012.
Brown, R. E., Koeberl, C., Montanari, A., and Bice, D. M.: Evi-dence for a change in Milankovitch forcing caused by extrater-restrial events at Massignano, Italy, Eocene-Oligocene boundary GSSP, in: The Late Eocene Earth – Hothouse, Icehouse and Im-pacts, edited by: Koeberl, C., and Montanari, A., Geol. S. Am. S., 452, 119–137, doi:10.1130/2009.2452(08), 2009.
Burgess, C. E., Pearson, P. N., Lear, C. H., Morgans, H. E. G., Han-dley, L., Pancost, R. D., and Schouten, S.: Middle Eocene climate cyclicity in the southern Pacific: Implications for global ice vol-ume, Geology, 36, 651–654, 2008.
Cande, S. C. and Kent, D. V.: Revised calibration of the geomag-netic polarity timescale for the Late Cretaceous and Cenozoic, J. Geophys. Res., 100, 6093–6095, 1995.
Coxall, H. K. and Wilson, P. A.: Early Oligocene glaciation and productivity in the eastern equatorial Pacific: Insights into global carbon cycling, Paleoceanography, 26, PA2221, doi:10.1029/2010pa002021, 2011.
Coxall, H. K., Wilson, P. A., Pälike, H., Lear, C. H., and Back-man, J.: Rapid stepwise onset of Antarctic glaciation and deeper calcite compensation in the Pacific Ocean, Nature, 433, 53–57, doi:10.1038/nature03135, 2005.
DeConto, R. M. and Pollard, D.: Rapid Cenozoic glaciation of
Antarctica induced by declining atmospheric CO2, Nature, 421,
245–249, doi:10.1038/nature01290, 2003.
DeConto, R. M., Pollard, D., Wilson, P. A., Pälike, H., Lear, C. H., and Pagani, M.: Thresholds for Cenozoic bipolar glaciation, Na-ture, 455, 652–656, doi:10.1038/nature07337, 2008.
Dunn, D. A.: Change from “Atlantic-type” to “Pacific-type” carbon-ate stratigraphy in the middle Pliocene Equatorial Pacific Ocean, Mar. Geol., 50, 41–59, doi:10.1016/0025-3227(82)90060-3, 1982.
Dupont-Nivet, G., Krijgsman, W., Langereis, C. G., Abels, H. A., Dai, S., and Fang, X.: Tibetan plateau aridification linked to global cooling at the Eocene-Oligocene transition, Nature, 445, 635–638, 2007.
Edgar, K. M., Wilson, P. A., Sexton, P. F., and Suganuma, Y.: No extreme bipolar glaciation during the main Eocene calcite com-pensation shift, Nature, 448, 908–911, doi:10.1038/nature06053, 2007.
Edgar, K. M., Wilson, P. A., Sexton, P. F., Gibbs, S. J., Roberts, A. P., and Norris, R. D.: New biostratigraphic, magnetostrati-graphic and isotopic insights into the Middle Eocene Climatic Optimum in low latitudes, Palaeogeogr. Palaeocl., 297, 670–682, doi:10.1016/j.palaeo.2010.09.016, 2010.
Ehrmann, W. U. and Mackensen, A.: Sedimentological evidence for the formation of an East Antarctic ice sheet in Eocene/Oligocene time, Palaeogeogr. Palaeocl., 93, 85–112, doi:10.1016/0031-0182(92)90185-8, 1992.
Eldrett, J. S., Harding, I. C., Wilson, P. A., Butler, E., and Roberts, A. P.: Continental ice in Greenland during the Eocene and Oligocene, Nature, 446, 176–179, 2007.
between Australia and Antarctica, edited by: Exon, N. F., Ken-nett, J. P., and Malone, M. J., Am. Geophys. Union, Geophys. Monogr., 63–78, 2004.
Gale, A. S., Huggett, J. M., Pälike, H., Laurie, E., Hailwood, E. A., and Hardenbol, J.: Correlation of Eocene-Oligocene marine and continental records: orbital cyclicity, magnetostratigraphy and sequence stratigraphy of the Solent Group, Isle of Wight, UK, J. Geol. Soc. London, 163, 401–415, doi:10.1144/0016-764903-175, 2006.
Grazzini, C. V. and Oberhaensli, H.: Isotopic Events at the Eocene/Oligocene Transition. A Review, Developments in Palaeontology and Stratigraphy, 311–329, doi:10.1016/S0920-5446(08)70136-5, 1986.
Guidry, E. P., Richter, C., Acton, G. D., Channell, J. E. T., Evans, H. F., Ohneiser, C., Yamamoto, Y., and Yamazaki, T.: Oligocene-Miocene magnetostratigraphy of deep-sea sediments from the Equatorial Pacific (IODP Site U1333), Geological Society, Lon-don, Special Publications, 373, 13–27, doi:10.1144/SP373.7, 2013.
Hay, W. W., DeConto, R., Wold, C. N., Wilson, K. M., Voigt, S., Schulz, M., Wold-Rossby, A., Dullo, W.-C., Ronov, A. B., Balukhovsky, A. N., and Soeding, E.: Alternative Global Cretaceous Paleogeography, in: The Evolution of Cretaceous Ocean/Climate Systems, edited by: Barrera, E. and Johnson, C., Geological Society of America Special Paper, 1–47, 1999. Hilgen, F. J. and Kuiper, K. F.: A critical evaluation of the
numeri-cal age of the Eocene-Oligocene boundary, in: The Late Eocene Earth – Hothouse, Icehouse, and Impacts: Geological Society of America Special Paper, edited by: Koeberl, C. and Montanari, A., Geol. S. Am. S., 452, 139–148, doi:10.1130/2009.2452(09), 2009.
Hinnov, L. A. and Hilgen, F. J.: Cyclostratigraphy and As-trochronology, in: The Geological Timescale 2012, edited by: Gradstein, F. M., Ogg, J. G., Schmitz, M. D., and Ogg, G. M., El-sevier, 63–83, doi:10.1016/B978-0-444-59425-9.00004-4, 2012. IODP (Integrated Ocean Drilling Program): IODP Depth Scales
Terminology, available at: www.iodp.org/doc_download/
3171-iodpdepthscaleterminologyv2, last access: 12 May 2014, 2011.
Jovane, L., Florindo, F., Sprovieri, M., and Pälike, H.: Astronomic calibration of the late Eocene/early Oligocene Massignano sec-tion (central Italy), Geochem. Geophy. Geosy., 7, Q07012, doi:10.1029/2005GC001195, 2006.
Katz, M. E., Cramer, B. S., Toggweiler, J. R., Esmay, G., Liu, C., Miller, K. G., Rosenthal, Y., Wade, B. S., and Wright, J. D.: Impact of Antarctic Circumpolar Current Development on Late Paleogene Ocean Structure, Science, 332, 1076–1079, doi:10.1126/science.1202122, 2011.
Kirschvink, J. L.: The least-squares line and plane and the analysis of palaeomagnetic data, Geophys. J. Roy. Astr. S., 62, 699–718, 1980.
Koeberl, C. and Montanari, A.: The Late Eocene Earth – Hothouse, Icehouse and Impacts, Geol. S. Am. S., 322 pp., 2009.
Kuiper, K. F., Deino, A., Hilgen, F. J., Krijgsman, W., Renne, P. R., and Wijbrans, J. R.: Synchronizing Rock Clocks of Earth History, Science, 320, 500–504, doi:10.1126/science.1154339, 2008.
Kuroda, J. and Westerhold, T.:: Data report: volcanic glass shards from the Eocene–Oligocene transition interval at Site U1333,
in: Proceedings of the Integrated Ocean Drilling Program, 320/321, edited by: Pälike, H., Lyle, M., Nishi, H., Raffi, I., Gamage, K., Klaus, A., and the Expedition 320/321 Scientists, doi:10.2204/iodp.proc.320321.211.2013, 2013.
Lanci, L., Pares, J. M., Channell, J. E. T., and Kent, D. V.: Miocene magnetostratigraphy from Equatorial Pacific sediments (ODP Site 1218, Leg 199), Earth Planet. Sc. Lett., 226, 207–224, doi:10.1016/j.epsl.2004.07.025, 2004.
Lanci, L., Parés, J. M., Channell, J. E. T., and Kent, D. V.: Oligocene magnetostratigraphy from Equatorial Pacific sediments (ODP Sites 1218 and 1219, Leg 199), Earth Planet. Sc. Lett., 237, 617– 634, doi:10.1016/j.epsl.2005.07.004, 2005.
Laskar, J., Joutel, F., and Boudin, F.: Orbital, precessional, and
inso-lation quantities for the earth from−20 Myr to +10 Myr, Astron.
Astrophys., 270, 522–533, 1993.
Laskar, J., Robutel, P., Joutel, F., Gastineau, M., Correia, A., and Levrard, B.: A long-term numerical solution for the insola-tion quantities of the Earth, Astron. Astrophys., 428, 261–285, doi:10.1051/0004-6361:20041335, 2004.
Laskar, J., Fienga, A., Gastineau, M., and Manche, H.: La2010: a new orbital solution for the long-term motion of the Earth, As-tron. Astrophys., 532, A89, doi:10.1051/0004-6361/201116836, 2011a.
Laskar, J., Gastineau, M., Delisle, J. B., Farrés, A., and Fienga, A.: Strong chaos induced by close encounters with Ceres and Vesta, Astron. Astrophys., 532, L4, doi:10.1051/0004-6361/201117504, 2011b.
Lear, C. H., Rosenthal, Y., Coxall, H. K., and Wilson, P. A.: Late Eocene to early Miocene ice sheet dynamics and the global carbon cycle, Paleoceanography, 19, PA4015, doi:10.1029/2004PA001039, 2004.
Lear, C. H., Bailey, T. R., Pearson, P. N., Coxall, H. K., and Rosen-thal, Y.: Cooling and ice growth across the Eocene-Oligocene transition, Geology, 36, 251–254, 2008.
Leon-Rodriguez, L. and Dickens, G. R.: Data report: stable isotope composition of Eocene bulk carbonate at Sites U1331, U1332, and U1333, in: Proceedings of the Integrated Ocean Drilling Pro-gram, 320/321, edited by: Pälike, H., Lyle, M., Nishi, H., Raffi, I., Gamage, K., Klaus, A., and and the Expedition 320/321 Sci-entists, doi:10.2204/iodp.proc.320321.208.2013, 2013.
Liu, Z., Pagani, M., Zinniker, D., DeConto, R., Huber, M., Brinkhuis, H., Shah, S. R., Leckie, R. M., and Pearson, A.: Global Cooling During the Eocene-Oligocene Climate Tran-sition, Science, 323, 1187–1190, doi:10.1126/science.1166368, 2009.
Lourens, L. J., Hilgen, F. J., Laskar, J., Shackleton, N. J., and Wilson, D.: The Neogene Period, in: A Geological Timescale 2004, edited by: Gradstein, F., Ogg, J., and Smith, A., 409–440, Cambridge University Press, Cambridge, UK, doi:10.1017/CBO9780511536045.022, 2004.
Lourens, L. J., Sluijs, A., Kroon, D., Zachos, J.‘C., Thomas, E., Röhl, U., Bowles, J., and Raffi, I.: Astronomical pacing of late Palaeocene to early Eocene global warming events, Nature, 435, 1083–1087, doi:10.1038/nature03814, 2005.