www.clim-past.net/11/1599/2015/ doi:10.5194/cp-11-1599-2015
© Author(s) 2015. CC Attribution 3.0 License.
Expansion and diversification of high-latitude radiolarian
assemblages in the late Eocene linked to a cooling event in the
southwest Pacific
K. M. Pascher1,2, C. J. Hollis1, S. M. Bohaty3, G. Cortese1, R. M. McKay2, H. Seebeck1, N. Suzuki4, and K. Chiba4 1GNS Science, P.O. Box 30368, Lower Hutt 5040, New Zealand
2Victoria University Wellington, Antarctic Research Centre, P.O. Box 600, Wellington 6140, New Zealand
3Ocean and Earth Science, University of Southampton, National Oceanography Centre Southampton, European Way,
Southampton SO14 3ZH, UK
4Institute of Geology and Paleontology, Graduate School of Science, Tohoku University, Sendai City, 980-8578, Japan
Correspondence to:K. M. Pascher ([email protected])
Received: 16 June 2015 – Published in Clim. Past Discuss.: 9 July 2015
Revised: 13 November 2015 – Accepted: 18 November 2015 – Published: 7 December 2015
Abstract.The long-term cooling trend from middle to late
Eocene was punctuated by several large-scale climate pertur-bations that culminated in a shift to “icehouse” climates at the Eocene–Oligocene transition. We present radiolarian micro-fossil assemblage and foraminiferal oxygen and carbon sta-ble isotope data from Deep Sea Drilling Project (DSDP) sites 277, 280, 281, and 283 and Ocean Drilling Project (ODP) Site 1172 to identify significant oceanographic changes in the southwest Pacific through this climate transition (∼40– 30 Ma). We find that the Middle Eocene Climatic Opti-mum at ∼40 Ma, which is truncated but identified by a negative shift in foraminiferal δ18O values at Site 277, is associated with a small increase in radiolarian taxa with low-latitude affinities (5 % of total fauna). In the early late Eocene at ∼37 Ma, a positive oxygen isotope shift at Site 277 is correlated with the Priabonian Oxygen Isotope Maxi-mum (PrOM). Radiolarian abundance, diversity, and preser-vation increase within this cooling event at Site 277 at the same time as diatom abundance. A negative δ18O excur-sion above the PrOM is correlated with a late Eocene warm-ing event (∼36.4 Ma). Radiolarian abundance and diversity decline within this event and taxa with low-latitude affini-ties reappear. Apart from this short-lived warming event, the PrOM and latest Eocene radiolarian assemblages are charac-terised by abundant high-latitude taxa. High-latitude taxa are also abundant during the late Eocene and early Oligocene (∼38–30 Ma) at DSDP sites 280, 281, 283 and 1172 and are associated with very high diatom abundance. We
there-fore infer a northward expansion of high-latitude radiolar-ian taxa onto the Campbell Plateau in the latest Eocene. In the early Oligocene there is an overall decrease in ra-diolarian abundance and diversity at Site 277, and diatoms are scarce. These data indicate that, once the Antarctic Cir-cumpolar Current was established in the early Oligocene (∼30 Ma), a frontal system similar to present day devel-oped, with nutrient-depleted Subantarctic waters bathing the area around DSDP Site 277, resulting in a more restricted siliceous plankton assemblage.
1 Introduction
pCO2(Bohaty and Zachos, 2003; Bohaty et al., 2009; Bijl
et al., 2010). Lipid biomarker-based climate proxies suggest the southwest Pacific sea surface temperatures were tropical during the MECO (28◦
C) and continued to be warm through-out the late Eocene (24–26◦
C), cooling only slightly across the Eocene–Oligocene transition (EOT,∼22◦C) (Liu et al., 2009; Bijl et al., 2010).
The warm conditions of the Eocene indicated by geochem-ical proxies are generally consistent with fossil-based re-constructions of Southern Ocean circulation developed from high-latitude drill cores (Kennett, 1977; Nelson and Cooke, 2001; Kennett and Exon, 2004; Houben et al., 2013), in which subtropical waters are interpreted to have extended close to the Antarctic margin until the late Eocene. How-ever, the latest generation of ocean circulation and climate modelling simulations fails to reproduce the degree of high-latitude warmth indicated for the Eocene by these new prox-ies (Hollis et al., 2012; Lunt et al., 2012). Even under hyper-greenhouse conditions, the models produce a cyclonic gyre that blocks subtropical waters from penetrating south-ward beyond 45◦
S (Huber and Sloan, 2001; Huber et al., 2004). High-latitude warmth also conflicts with increasing evidence for ephemeral Antarctic glaciation during the latest Eocene from both fossil and geochemical proxies (Lazarus and Caulet, 1993; Scher et al., 2014; Barron et al., 2015). Following the MECO event, benthicδ18O values increased to their maximum Eocene values of∼2.3 ‰ at about 37.3 Ma during a short-lived cooling episode in the early late Eocene, referred to as the Priabonian Oxygen Isotope Maximum (PrOM) (Scher et al., 2014). Further climate oscillations are reported for the late Eocene (Vonhof et al., 2000; Pälike et al., 2001; Bohaty and Zachos, 2003; Villa et al., 2008; West-erhold et al., 2014) prior to the expansion of Antarctic ice that defines the EOT. A negativeδ18O excursion reported at Ocean Drilling Project (ODP) sites 689 (Maud Rise), 738, 744, and 748 (Kerguelen Plateau) (Diester-Haass and Zahn, 1996; Bohaty and Zachos, 2003; Villa et al., 2008, 2014) has been interpreted to be a short-lived warming event in the late Eocene (∼36.4 Ma).
Identifying the initial timing and establishment of a high-latitude fauna in the Southern Ocean helps to constrain the development of the Southern Ocean frontal systems and, in turn, heat transfer between low and high latitudes. Ken-nett (1978) provided the first summary on the biogeographic development of planktic biota in the circumpolar Southern Ocean throughout the Cenozoic. He inferred that the de-velopment of distinct polar plankton assemblages was re-lated to the evolution of the Antarctic Circumpolar Cur-rent (ACC) and the Antarctic Polar Front (AAPF). This change was linked by Kennett (1978) to Southern Ocean circulation changes associated with the opening of Drake Passage and Tasmanian Gateway in the late Eocene–early Oligocene and implicated as the main causal mechanisms for Antarctic glaciation. Subsequent deep-sea drilling cam-paigns have provided additional data on regional changes in
Southern Ocean plankton, which were integrated by Lazarus and Caulet (1993) into a set of circumpolar maps across spe-cific time intervals. Moreover, these authors also carried out the first synthesis of radiolarian biogeography for the region and found a pattern of increasing endemism in the Southern Ocean across the EOT. Nelson and Cooke (2001) undertook a comprehensive review of previous work and presented an updated synthesis on the oceanic front development in the southwest Pacific during the Cenozoic. According to these authors, the proto-Subtropical Front was established in the late Eocene (ca. 35 Ma) and an AAPF in the early Oligocene. A more detailed study of radiolarian biogeographic patterns and trends in the southwest Pacific was done by Lazarus et al. (2008), who found increased endemism in the radiolar-ian fauna in the late Eocene (ca. 35 Ma). Further radiolarradiolar-ian studies from the Atlantic sector of the Southern Ocean were performed by Funakawa and Nishi (2008), who recorded the first expansion of an Antarctic assemblage significantly ear-lier (38.5 Ma). They identified several faunal turnover events in the Antarctic assemblage from the late middle Eocene to late Oligocene and linked these events to migrations of the AAPF. Latest research suggests that the ACC was not de-veloped until ∼30 Ma, together with the establishment of an AAPF (Scher et al., 2015), when the Tasmanian Gateway aligned with the westerly wind flow (Hill et al., 2013). From the middle to late Eocene, a westward Antarctic Slope Cur-rent is inferred to have flowed across the gateway, driven by the polar easterlies (Bijl et al., 2013; Scher et al., 2015).
In this paper, we document variation in radiolarian assem-blages and foraminiferal oxygen and carbon stable isotopes from middle Eocene to early Oligocene (∼40 to 30 Ma) at Deep Sea Drilling Project (DSDP) Site 277 and relate these variations to radiolarian assemblage changes at DSDP sites 280, 281, and 283 and ODP Site 1172. DSDP Site 277 pro-vides a unique record of pelagic sedimentation in the south-west Pacific during late Palaeocene to Oligocene times and the first Eocene foraminiferal δ18O record was generated from this site (Shackleton and Kennett, 1975). Although the study by Lazarus et al. (2008) of radiolarian assemblages cluded all above-mentioned DSDP sites, this new work in-cludes a more thorough taxonomic review of the radiolarian assemblages at these sites and integrates the radiolarian as-semblage trends with new stable isotope data for Site 277. Our results help to identify the extent to which tropical or warm-subtropical conditions prevailed during the middle and late Eocene, refine the timing and nature of the development of a distinctive Southern Ocean radiolarian fauna and discuss implications for the palaeoceanography of the southwest Pa-cific from the middle Eocene to early Oligocene.
2 Study sites
(Fig. 1). The main focus of our study is Site 277, which is located on the western margin of the Campbell Plateau (52◦
13.43′
S, 166◦
11.48′
E) at a water depth of 1214 m. Forty-six cores were drilled with a maximum penetration of 472.5 m below sea floor (mbsf), but with total length of 434.5 m of cored section and only 59.6 % recovery. Poor re-covery was due to 9.5 m coring runs being conducted ev-ery 19 m (i.e. alternate drilling and coring at 9.5 m intervals) between 301.5 and 368.0 mbsf Below 10 mbsf, a Palaeo-gene sequence spanning from the late Palaeocene to middle Oligocene was recovered (Kennett et al., 1975). We studied cores 277-35R (349.2 mbsf) to 277-15R (134.5 mbsf), which cover a middle Eocene–lower Oligocene interval. The sedi-ment at Site 277 (palaeolatitude∼55◦S) throughout the suc-cession is highly calcareous, indicating a depositional envi-ronment well above the lysocline, with a palaeodepth esti-mated at around 1500 m (Kennett et al., 1975; Hollis et al., 1997).
Four additional sites were included in our study in or-der to acquire a regional picture of radiolarian assemblage change and biogeography during the middle Eocene to early Oligocene (Fig. 1). DSDP Site 280 comprises two holes (48◦
57.44′
S, 147◦
14.08′
E) located ∼100 km south of the South Tasman Rise and drilled at a water depth of 4176 m. We collected radiolarian assemblage data from Hole 280A, which consists of a 201 m cored section that includes a 97.2 m middle Eocene–middle Oligocene interval. The stud-ied interval spans Core 7R (123.4 mbsf) to Core 280A-5R (92.54 mbsf). DSDP Site 281 on the South Tasman Rise (47◦
59.84′
S, 147◦
45.85′
E), drilled at a water depth of 1591 m, encompasses two holes (281 and 281A). We exam-ined Hole 281, which was cored to 169 mbsf, and recovered a 105.6 m (62.5 % recovery) upper Eocene–Pleistocene sec-tion. The studied interval covers cores 281-16R (149 mbsf) to 281-14R (122.5 mbsf). DSDP Site 283 lies in the central Tasman Sea (43◦
54.6′
S, 154◦
16.96′
E) at a water depth of 4729 m and also comprises two holes (283 and 283A). We examined Hole 283, which was drilled to 156 mbsf (39 % recovery), and recovered a Palaeocene–Pleistocene section that contains a hiatus from the upper Eocene to possibly the Miocene. Samples from cores 8R (192.25 mbsf) to 283-5R (87.75 mbsf) were studied from this site. ODP Site 1172 is situated west of the East Tasman Plateau (43◦
57.58′
S, 149◦
55.69′
E) in a water depth of 2622 m and was drilled dur-ing ODP Leg 189 (Exon et al., 2004). It comprises four holes (1172A, 1172B, 1172C and 1172D). The examined sam-ples were from Section 1172A-39X-1 to Section 48X-CC (354.625–450.55 mbsf), spanning a middle Eocene–lower Oligocene interval, and from Section 1172D-2R-2 to Sec-tion 1172D-2R-3 (355.225–356.875 mbsf), covering a lower Oligocene interval.
! !
! !
-30°
-40°
280 281
283
277
1172 Campbell Plateau
Tasman Rise
180° 160°
180° 160°
140°
-40°
-50° Tasman Sea
STF
SAF
SAW
Figure 1.Modern location of DSDP and ODP study sites in the southwest Pacific. Dark grey: coastline; light grey: 2000 m isobath of continental boundary; STF: Subtropical Front; SAF: Subantarctic Front, SAW: Subantarctic Water.
3 Material and methods
3.1 Sample preparation and analysis
This study is based on 33 sediment samples from DSDP Site 277 (∼350 to 135 mbsf) spanning a middle Eocene–lower Oligocene interval (17 reported by Hollis et al. (1997) and 16 new samples), 6 samples from DSDP Site 283 (new, all from the DSDP/ODP Micropaleontology Reference Centre (MRC)), 7 from DSDP Site 281 (3 from the DSDP/ODP MRC, 4 new) and 4 from DSDP Site 280 (new). Due to in-complete core recovery in all study sections, the sampling resolution of our study is variable (∼0.5 to ∼30 m sam-ple spacing). To obtain a consistent taxonomic identifica-tion across all sites, all samples previously reported from DSDP sites 277, 280, 281 and 283 were re-examined and re-counted as part of this study. The Supplement files in-clude taxonomic notes for all radiolarian species recorded in this study, plates of selected species, and radiolarian distribu-tion charts and sample informadistribu-tion for DSDP sites 277, 280, 281 and 283 (Supplement Tables 1–5). Radiolarian census data of 41 samples from ODP Site 1172, covering a mid-dle Eocene–lower Oligocene interval, are provided in Sup-plement Table 6. The radiolarian taxonomy, sample prepara-tion and analysis methodology were published in Suzuki et al. (2009).
For strewn slide preparation, 1–10 g of sample material was broken into∼5 mm diameter chips and acidified with 10 % HCl to dissolve carbonate. Samples were then washed through a 63 µm sieve, and the > 63 µm residue was cleaned by gently heating in a 1:1 solution of 10 % hydrogen perox-ide and sodium hexametaphosphate ((NaPO3)6). The residue
ra-diolarians, 1–5 strewn slides were prepared for each sample. If the radiolarians were sparse, specimens were individually picked from the dried residue under a stereo microscope. For strewn slides, a known portion of dried residue was evenly distributed on a pre-glued coverslip, which was inverted and placed gently on a glass slide with a thin coating of Canada balsam. The slide was placed on a hot plate until the balsam was fixed.
Strewn slides were examined using a Zeiss transmitted light microscope fitted with a Zeiss AxioCam ERc5s digi-tal camera. Radiolarian census data were derived along ver-tical slide traverses under transmitted light following the method of Hollis (2006). For samples with sparse radiolar-ians (< 300 specimens per slide), all radiolarradiolar-ians on the pre-pared slide(s) were counted. For richer samples, all speci-mens were counted until a total number of∼300 specimens was achieved. The proportion of the slide examined to this point was determined and the abundance of common taxa (> 15 observed specimens) estimated for the rest of the slide. The remaining portion was then examined and rare taxa (< 15 specimen observed in initial count) recorded. All intact tests were assigned to a counting group that range from undiffer-entiated order (e.g. Nassellaria undet.) and family (e.g. Acti-nommidae undet.) to species and subspecies. This approach allows for an accurate estimate of the abundance of individ-ual species, but it does result in overall diversity being under-estimated.
Radiolarian abundance was calculated using the following equation:
XR×XS× 1
XP
/ASed, (1)
withXRbeing the total number of radiolarians per slide,XS
the number of slides made of a known portionXPof the dried
material, andASedthe initial amount of dried sediment.
Additional data derived for each sample assemblages in-cludes taxic richness, the Fisher α diversity index and the Simpson index of evenness. The latter two indices were cal-culated using the PAST software version 3.07 (Hammer et al., 2001). The Fisher α index is a general guide to diver-sity, calculated from the number of taxa and the total number of individuals. The Simpson index of evenness determines the degree to which assemblages are dominated by individual taxa and ranges from 0 to 1. Since taxic richness is correlated with preservation and is also dependent on the sample size, we performed an individual rarefaction analysis for Site 277 samples with PAST (Supplement Table 2). This allows the comparison of taxonomic diversity in samples of different sizes. We used 100, 200, 300 and 500 counts as sample sizes to calculate taxic richness. Additionally, we derived a range-through taxic richness after subsampling for Site 277 with R version 3.1.3 (www.r-project.org) (Supplement Table 2). We chose sample sizes of 100 and 300, both with a subsam-pling of 1000. This approach shows whether a diversity drop in the middle of a series is a true diversity drop or a
tem-porary absence due to preservation. The diatom / radiolarian (D/R) ratio was calculated using the counts of diatoms and radiolarians of one examined slide. In the case of very rare diatoms, all specimens were counted on a slide; otherwise, several transverses were counted for diatoms and the total number estimated for the whole slide. Although this method is not an accurate measure of total diatom abundance as most pelagic diatoms are smaller than the 63 µm screen used in this study, it serves to identify the order of magnitude in changes in diatom abundance that allows us to identify significant di-atom event horizons.
3.2 Radiolarian biogeographic affinities
The assignment of biogeographic affinities to radiolarian species, subspecies and informally defined morphotypes en-countered in our study is based on a comprehensive litera-ture review. We focussed on published records of these taxa or their close relatives from the southwest Pacific and South-ern Ocean (e.g. Petrushevskaya, 1975; Takemura and Ling, 1997; Sanfilippo and Caulet, 1998; Hollis, 2002, 2006; Fu-nakawa and Nishi, 2005, 2008; Hollis et al., 2005; FuFu-nakawa et al., 2006; Kamikuri et al., 2013). This literature review was complemented with radiolarian occurrence data from the NSB (Neptune Sandbox Berlin) database (Lazarus, 1994; Spencer-Cervato, 1999). Unfortunately, this database lacks many Palaeogene radiolarians, and, for those that are present, occurrences need to be cross-checked with the DSDP/ODP reports. The first step was to assess the palaeolatitude of each site for the interval of radiolarian ranges. We used www.paleolatitude.org (van Hindsbergen et al., 2015) to ex-tract palaeolatitude information in intervals of 10 Ma for the past 60 Ma and created the mean value for each site for an age range (Supplement Table 11). We listed radiolarian taxa and their range and abundance at high-latitude (> 45◦
N/S), mid-latitude (25–45◦
N/S) and low-latitude sites (0–25◦
as-sumption that southwest Pacific and North Atlantic Ocean conditions would have been similar in the Palaeogene is not supported by ocean circulation models (Huber et al., 2003, 2004). These models indicate that oceanic conditions for the North Atlantic and the southwest Pacific were sub-stantially different in the early Palaeogene: the North At-lantic was bathed in warm currents of∼25◦C moving north-wards (Huber et al., 2003), while the southwest Pacific was influenced by a strong cyclonic gyre preventing warm wa-ters from penetrating southwards, except during times of ex-treme global warmth (Huber et al., 2004; Hollis et al., 2012). Thus, the occurrence of warm-water indicators throughout the Palaeocene–Eocene interval in the mid-latitude North At-lantic is consistent with both the global circulation model re-sults and our interpretation of influxes of Amphicraspedum as being indicative of warming.
Tectonic reconstructions of the Australia–Antarctica– Pacific plate circuit were undertaken in GPlates version 1.5 (Boyden et al., 2011) using finite poles of rotation for the relative motions between Australia and East Antarctica from Cande and Stock (2004) (0–38.13 Ma), East Antarctica and West Antarctica from Granot et al. (2013) (30.94–40.13 Ma), and West Antarctica and the Pacific from Croon et al. (2008) (0–47.54 Ma). Relative motions of the Australia–Antarctica– Pacific plate circuit were tied to the Australian palaeomag-netic apparent polar wander path of Torsvik et al. (2012) to provide an estimate of palaeolatitude appropriate for palaeoclimate studies (van Hinsbergen et al., 2015). The 2000 m isobath from the GEBCO bathymetric grid (www. gebco.net) was used to approximate continental boundaries. The continental–oceanic boundaries of Bird (2003) are also shown (dashed lines in Figs. 1 and 8) for regions where extension has significantly thinned continental crust. Each DSDP and ODP study site was assigned to the appropriate plate for reconstruction.
The overlap of the North and South Island of New Zealand in these reconstructions is a consequence of the finite poles of rotation determined from the Adare Trough by Granot et al. (2013), which constrain the motion of East and West Antarctica between 40 and 30 Ma. These new poles result in a poor fit (significant overlap) of continental crust be-tween the two islands that is not supported by geologi-cal data. The discrepancy between geologigeologi-cal and palaeo-magnetic data could be reconciled with the use of seafloor spreading data from the Emerald Basin (e.g. Keller, 2003), which describes Australia–Pacific relative motions (Suther-land, 1995) between 40 and 30 Ma, and the Adare Trough. However, our sites lie south of New Zealand and so we make no attempt to resolve this issue here.
3.3 Stable isotope analysis
Stable oxygen (δ18O) and carbon (δ13C) isotope measure-ments of foraminiferal samples from Site 277 were con-ducted in the stable isotope laboratories at the University
of Southampton (UoS) and University of California Santa Cruz (UCSC). Sample analyses included bulk carbonate, benthic foraminifera (Cibicidoides spp.), and the planktic foraminifera Subbotina spp. (thermocline) from 332.62 to 159.88 mbsf andGlobigerinatheka index(mixed layer) from 332.62 to 188.58 mbsf (its last occurrence). In total, 169 sam-ples spanning the middle Eocene–lower Oligocene interval of DSDP Hole 277 were measured (Supplement Tables 7– 10). Stable isotope analyses at the UoS were performed on a Europa GEO 20-20 dual-inlet mass spectrometer with CAPS preparation oven maintained at 70◦
C, and analyses at UCSC were performed on a VG Prism dual-inlet mass spectrome-ter coupled to a carousel preparation device with a common acid bath maintained at 90◦
C. All values are reported rela-tive to the Vienna Pee Dee Belemnite (VPDB) standard. In both labs, analytical precision, based on replicate analyses of in-house marble standards and NBS-19, averaged∼0.07 ‰ (1σ) forδ13C and∼0.08 ‰ (1σ) forδ18O.
4 Results
4.1 Site 277 biostratigraphy and stable isotope stratigraphy
nanno chalk with chert nodules
nanno ooze sandstone
no core recovery Lithology
Age NZ stages RP(SH) Log Core
mbsf DSDP 277 early Oligocene late Eocene middle Eocene lRP15 uRP15 uRP14 lRP14 RP12 early Whaingaroan Kaiatan Bortonian Runangan NP16 NP17 NP18 NP19-20 NP21-22 NP23 350 300 250 200 150 RP13 14 20 17 34 31 30 29 28 26 23 22 21 16 15 18 32 27 25 24 18 Cibicidoides O δ
(‰, v-PDB)
13 Cibicidoides C δ
(‰, v-PDB)
ODP 68918
Cibicidoides O δ
(‰, v-PDB)
ODP 68913
Cibicidoides Cδ
(‰, v-PDB) 3 2 1 0 -1
34 33 19
δ13C
δ18O 35 NP Zones EOT MECO PrOM L. Eoc. warming
HO A. primitiva 39.1 Ma HO G. index 34.6 Ma
HO C. reticulatum 36.44 Ma LO I. recurvus 36.97 Ma LCO C. oamaruensis 37.32 Ma LO E. spinosum ~38 Ma HO D. saipanensis 34.44 Ma
HO C. solitus 40.4 Ma
uncertainty of bioevents
2 1 0
0 1 2
Age (Ma) 40 36 32 34 38 42
0 1 2
Figure 2.DSDP Site 277 stratigraphy, NZ stages (Raine et al., 2015), Southern Hemisphere radiolarian zones (RP), nannofossil zones (NP), lithology, core recovery, selected bioevents (ages calibrated to the 2012 geological timescale; Gradstein et al., 2012; Raine et al., 2015) and benthicδ18O andδ13C data of DSDP Site 277. The dashed lines correlate with Site 277 based on the ages of the bioevents to Southern OceanCibicidoidesdata of ODP Site 689 Hole B (Maud Rise) (Diester-Haass and Zahn, 1996) calibrated to the GTS2012 timescale using the magnetostratigraphy data of Florindo and Roberts (2005) and Spiess (1990). LO: lowest occurrence; LCO: lowest common occurrence; HO: highest occurrence; MECO: Middle Eocene Climatic Optimum; PrOM: Priabonian Oxygen Isotope Maximum; EOT: Eocene–Oligocene transition.
oamaruensis, 37.32 Ma (Gradstein et al., 2012), defines the base of NP18 at 244.5–240.6 mbsf (Edwards and Perch-Nielsen, 1975). The base of NP19-20 is defined by the LO of Isthmolithus recurvus, 36.97 Ma (Gradstein et al., 2012), at 226.58–225.5 mbsf (Edwards and Perch-Nielsen, 1975). Within NP19-20, the HO of Cribrocentrum reticu-latum is found at 206.5–201.1 mbsf (Edwards and Perch-Nielsen, 1975), estimated at 36.44 Ma (Raine et al., 2015). The base of NP21-22 (HO of Discoaster saipanensis) is placed at 191.6–190.1 mbsf (Edwards and Perch-Nielsen, 1975) and is dated at 34.44 Ma (Gradstein et al., 2012). As D. saipanensis is a warm-water taxon, its disappearance is likely to have occurred earlier at high latitudes. The Eocene– Oligocene boundary is approximated by the HO ofG. index at DSDP Site 277. More precise location is complicated by incomplete recovery and the highly disturbed nature of cores 277-19R, -20R, and -21R.
Although the recovery gaps in the Site 277 stable iso-tope record preclude detailed correlation, the broad trends and major events such as the MECO (∼40 Ma) and PrOM (∼37.3 Ma) can be identified in the benthicδ18O andδ13C isotope profiles and compared to the middle Eocene–early
Oligocene benthic isotope stratigraphy from ODP Site 689 (Maud Rise; Diester-Haass and Zahn, 1996) (Fig. 2). The EOT interval is characterised by a large (∼1 ‰) positive shift in benthic oxygen and carbon isotopes between cores 277-20R and -19R (183.64–171.28 mbsf) (Shackleton and Kennett, 1975; Keigwin, 1980), which is slightly lower than the full magnitude of the benthic δ18O shift seen at other Southern Ocean sites on the Kerguelen Plateau and Maud Rise (Diester-Haass and Zahn, 1996; Zachos et al., 1996; Bo-haty et al., 2012).
4.2 Site 277 oxygen and carbon isotopes
δ18O (‰, v-PDB)
δ13C(‰, v-PDB)
early Oligocene
late Eocene
middle Eocene
early Whaingaroan
Kaiatan
Bortonian
Runangan
350 300 250 200 150
Age NZ stages Core
mbsf
DSDP 277
20 17
34 31 30 29 28 26 23 22 21 16 15
18
32 27 25 24
34 33 19
35
2 1 0 -1
0 1 2 3 4
G. index Bulk Subbotina Cibicidoides Rad samples
MECO EOT
PrOM
L. Eoc. warming
Figure 3.DSDP Site 277δ18O andδ13C records and location of studied radiolarian samples within the MECO and late Eocene warming interval (red stars) and radiolarian-rich upper Eocene–lower Oligocene interval (blue stars).
because their isotopic signatures are likely less affected by diagenesis.
Several short-lived climatic events are identified in the benthic stable isotope records at Site 277 (Figs. 2 and 3, Sup-plement Table 7). The body of the MECO was not recovered due to a 16 m sampling gap between the top of Core 277-33R and the base of Core 277-32R, but MECO onset and recovery is well constrained by a 0.5 ‰ negative shift in ben-thicδ18O values at∼313 mbsf (between samples 277-33R-2, 106–108 cm, and -33R-1, 129–130.5 cm) and a ∼0.4 ‰ positive shift in δ18O values at ∼296 mbsf (between sam-ples 32R-3, 107–109 cm, and 32R-3, 77–79 cm), indicating that the MECO spans∼17 m (Fig. 2). The MECO is more strongly expressed in the benthic δ18O, but this may relate to the poor recovery of the body of the event at this site or diagenetic impacts on plankticδ18O values (Pearson et al., 2001; Sexton et al., 2006). In agreement with other records (Bohaty and Zachos, 2003; Bohaty et al., 2009), a positive
δ13C shift is observed in conjunction with the onset of the MECO in the benthic and bulk carbonate records (Fig. 2).
The PrOM event (Scher et al., 2014) is well defined in the
δ18O record from DSDP Site 277 but also spans three signif-icant recovery gaps at the base of cores 277-26R, -25R and -24R (∼244.5 to 225.5 mbsf) (Fig. 3). The∼0.4 ‰ positive shift inδ18O that marks the onset of the PrOM spans upper
Core 277-26R and lower Core 277-25R (∼240–230 mbsf) and is followed by an interval of relatively lowδ18O values in upper Core 277-25R, prior to reaching maximum values in uppermost Core 277-25R (∼226 mbsf) (Fig. 2). A grad-ual decrease inδ18O occurs through Core 277-24R. We de-fine the PrOM at DSDP Site 277 as the interval within these three cores in which benthicδ18O exceeds∼0.6 ‰, with the exception of a narrow interval in upper Core 277-25R. These benthicδ18O values are lower than those reported by Scher et al. (2014), but it is likely that peak δ18O values are not captured at Site 277. Consequently, the PrOM is placed be-tween 240.62 and 219.57 mbsf (spanning a∼21 m section). The plankticδ18O records show similar trends to the benthic record in the PrOM interval but lack the maximum excursion in uppermost Core 277-25R. At the onset of the PrOM event, short-lived negativeδ13C excursions are evident in the ben-thic, bulk and planktic records. However, a longer-term pos-itive trend for planktic and benthicδ13C values is associated with the benthicδ18O maximum.
Figure 4.DSDP Site 277 benthicδ18O record, radiolarian abundance and diatom/radiolarian (D/R) ratio, taxic richness (number of taxa) derived from individual rarefaction and range-through analyses for different sample sizes, and Fisherαindex and Simpson evenness index for radiolarian assemblages. Red bars indicate sample sizes < 100 specimens, blue bars indicate sample sizes < 300 specimens and black bars indicate samples sizes > 300 specimens.
may be correlated with the late Eocene warming interval re-ported from ODP sites 689 (Maud Rise), 738, 744, and 748 (Kerguelen Plateau) (Diester-Haass and Zahn, 1996; Bohaty and Zachos, 2003; Villa et al., 2008, 2014).
A large positive shift inδ18O occurs at Site 277 between the base of cores 277-20R and 277-19R, with maximum values in benthic and planktic δ18O andδ13C occurring in Core 277-19R (171.28 to 169.65 mbsf). This can be corre-lated with the large δ18O shift across the EOT documented at many deep-sea sites, which is characterised by two dis-tinct steps (EOT-1 and Oi-1) in more complete sections (e.g. Coxall et al., 2005; Katz et al., 2008).
We note that the stable isotope record at Site 277 exhibits high-amplitude cyclical variation in the range of 0.5 ‰ for benthicδ18O and slightly more forδ13C (Fig. 3). The pres-ence of at least 10 cycles within the 6 million years between the MECO and the EOT is consistent with orbital-scale forc-ing. Although the record is too incomplete to establish the frequency of these cycles, their presence in this expanded Palaeogene section bodes well for future drilling at this lo-cation.
4.3 Radiolarian assemblages at DSDP Site 277
In total, 16 families, 56 genera and 98 radiolarian species were identified at DSDP Site 277 (Supplement
Table 1). Radiolarian abundance is generally low (10– 100 specimens g−1
) and preservation is moderate through-out the middle Eocene–lower upper Eocene interval (349.2 to 227.2 mbsf) (Fig. 4). In the uppermost Eocene and lower Oligocene (226.1–143.9 mbsf) radiolarians are abundant to very abundant (> 1500 specimens g−1
) and well preserved. Diversity increases during the MECO (313.5–296 mbsf) and in the upper Eocene (226.10–186.5 mbsf) and drops in the lower Oligocene (162.2–134.5 mbsf) (Fig. 4). A short-lived drop in radiolarian abundance (< 500 specimens g−1
) and diversity is observed at 210.5–207.5 mbsf during the late Eocene warming event. Diversity closely parallels trends in abundance and preservation. Simpson evenness is strongly correlated with diversity but exhibits greater troughs where samples are sparse (Fig. 4). Spumellarians are dominant in most samples ranging between∼44 and 96 % (∼71 % aver-age). The main families are the Actinommidae, Litheliidae, Spongodiscidae, Artostrobiidae, Lychnocaniidae and Lopho-cyrtiidae (Supplement Table 1).
also has trace occurrences in five samples in the uppermost Eocene to lowermost Oligocene (cores 277-24R to -20R at 217.70, 209, 207.5, 197.82 and 186.50 mbsf). Several species are restricted to the MECO, including Artobotrys titanoth-ericeraos, Sethocyrtis chrysallis, Eusyringium fistuligerum and Stichopilium cf. bicorne. Lophocyrtis jacchia hapsis, which is a high-latitude variant ofL. jacchia jacchia (Sanfil-ippo and Caulet, 1998) and endemic to the Southern Ocean, is also common during the MECO and uppermost Eocene (217.7–206.83 mbsf), but is absent from the remaining mid-dle and lower upper Eocene. Furthermore, the LOs of sev-eral (albeit rare) species are recorded at this site during the MECO interval (Axoprunum pierinae,Zealithapium mitra, Periphaenaspp., Larcopyle hayesi,L. polyacantha, Zygo-circus buetschli,Siphocampe?amygdala,Eucyrtidium mon-tiparum, Lychnocanium amphitrite, Clinorhabdus ananto-mus,Lophocyrtis keraspera,Lophocyrtis dumitricai, Cryp-tocarpium ornatum andLamprocyclas particollis) (Supple-ment Table 1).
A major change in siliceous assemblages occurs within the PrOM interval (∼226 mbsf; Core 277-25R), coincident with maximum values in benthic δ18O (Fig. 4). A pro-nounced increase in radiolarian abundance (from < 50 to ∼4000 specimens g−1), preservation and diversity occurs at 226.10 mbsf (Sample 277-25R-1, 60 cm). Diatoms also be-come abundant at the same level as the increase in radi-olarian abundance. The most abundant nassellarian fami-lies are the Artostrobiidae (∼22 %), Lophocyrtiidae (∼6 %) and Lychnocaniidae (∼2.5 %). Plagiacanthidae account for ∼2 % of the total assemblage. The following taxa have their LO within the PrOM at Site 277:Lithelius (?) forem-anae,Ceratocyrtisspp.,Lithomelissa ehrenbergi,L. gelasi-nus,L.sphaerocephalis,Siphocampe nodosaria,Artostrobus annulatus, Artostrobuscf. pretabulatus,Clathrocyclas uni-versa, Dictyophimus? aff. archipilium, Lychnocanium wa-iareka,Aphetocyrtis rossiandTheocyrtis tuberosa (Supple-ment Table 1).
Five samples were investigated at Site 277 that lie within the late Eocene warming event (210.5–207.5 mbsf). During this event, radiolarian abundance and diversity decrease sig-nificantly, as well as diatom abundance (Fig. 4). The radi-olarian assemblages of these five samples differ from the other upper Eocene samples. Lychnocaniidae are more abun-dant (∼12 %), whereas Artostrobiidae are absent. Further-more, Lophocyrtiidae decrease (∼4 %) and Plagiacanthidae andLarcopylespp. are very rare (0.5 and 0.9 %, respectively; Supplement Table 1).
Immediately after the warming event, a second pro-nounced increase in radiolarian abundance (from < 200 to 9600 specimens g−1
) and diversity is observed at 206.83 mbsf, together with an increase in diatom abundance (Fig. 4). In the uppermost Eocene–lowermost Oligocene interval (206.83–186.5 mbsf), Plagiacanthidae (∼5 %), Ar-tostrobiidae (∼7 %) and Lophocyrtiidae (∼10 %) increase again, whereas Lychnocaniidae decrease (∼2 %;
Supple-ment Table 1). Theocyrtis tuberosahas a very rare occur-rence from the upper Eocene to lower Oligocene (∼226– 143.9 mbsf; cores 277-25R to -16R). This species is also known to have had isolated occurrences in the southern At-lantic and southern Indian oceans in the late Eocene (Take-mura, 1992; Takemura and Ling, 1997) and is common in lat-est Eocene to early late Oligocene assemblages from low to middle latitudes of all ocean basins (Sanfilippo et al., 1985). A significant decline in radiolarian abundance and di-versity is observed through the lower Oligocene (186.5 to 134.5 mbsf; cores 277-20R to -15R) (Fig. 4). Radiolarian abundance declines from 6400 to 750 radiolarians g−1
. Many nassellarian taxa decline or disappear, especially within the Lophocyrtiidae and Plagiacanthidae. Spumellarians increase from∼73 to∼97 % of the total fauna, with Litheliidae and Actinommidae being the most abundant families (Supple-ment Table 1).
Figure 5.Stratigraphy, Southern Hemisphere radiolarian zones (RP), lithology and core recovery at DSDP sites 280, 281 and 283. Variation in radiolarian abundance, diatom / radiolarian (D/R) ratio, Fisherαindex and Simpson evenness for radiolarian assemblages at all sites.
4.4 Radiolarian assemblages at other southwest Pacific sites
To establish the significance and nature of radiolarian fau-nal turnover associated with the PrOM event regiofau-nally, we investigated the upper Eocene–lower Oligocene intervals of DSDP sites 280, 281 and 283 and ODP Site 1172.
4.4.1 DSDP Site 280
Four samples were investigated at DSDP Site 280 from cores 280-7R, -6R and -5R (123.4 to 92.54 mbsf). In previ-ous work, the Eocene–Oligocene boundary in Hole 280 was placed at the base of Core 280-6R (110.5 mbsf) (Crouch and Hollis, 1996). However, due to the presence ofEucyrtidium antiquum(Caulet, 1991) andLarcopyle frakesi(Chen, 1975), both of which have LOs in the lower Oligocene, we place the studied interval (123.4–92.54 mbsf) in lower Oligocene Zone RP15(SH) (Fig. 5, Supplement Table 3). This is in agree-ment with O’Connor (2000), who found upper Eocene as-semblages were restricted to cores 280-10R to -8R (205.5 to 139 mbsf). The absence of the zonal markerAxoprunum? ir-regularisindicates correlation with lower RP15(SH) Eucyr-tidium spinosum, which according to Funakawa and Nishi (2005) has its HO in the lower Oligocene, is absent in the Site 280 study interval. However, the HO of this species is recorded within the upper Eocene interval at Site 277, sug-gesting a diachronous HO between the southwest Pacific and the South Atlantic.
In total, 15 families, 35 genera and 50 radiolarian species were identified at Site 280. Radiolarians are abundant (1000– 2500 specimens g−1
) and well preserved in all samples. Di-atoms are also very abundant (D/R ratio ∼10) (Fig. 5). Diversity and evenness are stable and high in all samples. Spumellarians are slightly more abundant than
nassellari-ans (52–66 % of the assemblage). The most abundant fam-ilies are Litheliidae (20–37 %), Plagiacanthidae (14–22 %), Actinommidae (4–12 %), Spongodiscidae (5–9 %), Eucyr-tidiidae (4–8 %) and Lophocyrtiidae (3–8 %) (Supplement Table 3). Compared to DSDP Site 277, this site has higher diatom abundance and better overall preservation, which may explain the higher diversity. More species of the gen-eraLithomelissa (7) andLarcopyle(5) are present, as well as a higher abundance of Lophocyrtiidae. Lychnocaniids are very rare at this site (< 1 %) and the genusLychnocaniumis absent (Supplement Table 3).
4.4.2 DSDP Site 281
Seven samples were investigated from DSDP Site 281 in the interval between 149 and 122.5 mbsf (cores 281-16R to -14R) (Fig. 5). Results from three of these samples were previously reported in Crouch and Hollis (1996) but have been re-examined for this study. Due to the presence of Eucyrtidium spinosumandEucyrtidium nishimurae, the lat-ter with a HO in the late Eocene at ∼36.9–36.7 Ma (Fu-nakawa and Nishi, 2005), we correlate the Site 281 study in-terval with lower Zone RP14(SH) (∼Kaiatan local stage). A hiatus spanning the uppermost Eocene and Oligocene is in-ferred from the presence of abundant glauconite in the upper part of Core 281-14R as well as from commonCyrtocapsella tetraperain Core 281-13R, which indicates a Miocene age (Crouch and Hollis, 1996).
In total, 14 families, 34 genera and 46 species were identified at Site 281. Radiolarians are abundant (2000– 4000 specimens g−1
281-14R (125.5–122.5 mbsf). The radiolarian assemblages are dominated by spumellarians (55–93 %), with Litheli-idae (17–42 %), SpongodiscLitheli-idae (12–30 %) and Actinommi-dae (10–20 %) the most abundant families. The most com-mon nassellarians belong to the Plagiacanthidae (1–15 %), Lophocyrtiidae (3–7 %) and Eucyrtidiidae (1–7 %) (Supple-ment Table 4). Although sites 280 and 281 were relatively close to each other (Fig. 1), the radiolarian assemblages are distinctly different, indicating different oceanographic con-ditions. Crouch and Hollis (1996) concluded that Site 281 was shallower and closer to terrigenous influx than Site 280. The depositional environment of Site 280 is interpreted as more oceanic. The greater abundance of Spongodiscidae at Site 281 supports a shallower oceanic setting for this locality (Casey, 1993). Compared to the early upper Eocene assem-blage of Site 277, where radiolarian abundance and diversity is very low, with several samples containing less than∼100 specimens, Site 281 contains more Spongidiscidae (∼20 %), Plagiacanthiidae (∼7 %) and Litheliidae (∼20 %), whereas the genusLychnocaniumis absent at Site 281.
4.4.3 DSDP Site 283
Six samples were examined from Site 283 between 192.25 and 87.75 mbsf (cores 283-8R to -5R) (Fig. 5). The lower-most sample at 192.25 mbsf is correlated with RP13(SH) due to the absence ofEucyrtidium spinosum. The uppermost five samples are of early late Eocene age based on the presence of E. spinosum and nannofossil age control (Edwards and Perch-Nielsen, 1975). The age of the Site 281 and 283 suc-cessions are poorly defined and the PrOM event cannot be lo-cated at these sites. Both sites containEucyrtidium nishimu-rae: at Site 283 it is found in all samples, and at Site 281 its HO is in 125.5–122.5 mbsf. According to Funakawa and Nishi (2005) its HO is in C17n1n (∼36.7 Ma; Gradstein et al., 2012).E. nishimuraeis absent at Site 277. The deposition of siliceous ooze in the upper middle to upper Eocene and the absence (or very rare) occurrence of foraminifera suggests a deep oceanic setting close or below the calcite compensation depth (CCD) for Site 283.
A total of 16 families, 50 genera and 81 radiolarian species were recorded at Site 283. Radiolarians are very abundant (4700–21 150 radiolarians g−1
) – with the highest abundance in cores 283-6R and -5R – well preserved, and diverse (59– 77 taxa per sample, Fisher α index of 10–13, evenness of 0.75–0.89). Diatoms are present in low abundance with D/R ratios < 1 (Fig. 5). Spumellarians account for 59–87 % of the assemblage, with the Litheliidae (23–38 %), Actinommi-dae (5–19 %) and SpongodisciActinommi-dae (2–8 %) the most abun-dant families. The Trissocyclidae (2–11 %), Eucyrtidiidae (2–11 %), Lophocyrtiidae (3–8 %) and Plagiacanthidae (2– 8 %) are the most common nassellarian families (Supplement Table 5).Theocyrtis tuberosais very abundant in the upper-most sample. The acme of this taxon might be correlated with its rare occurrence at Site 277 in the upper Eocene. Several
taxa appear earlier at Site 283 than at Site 277. These include the following taxa that occur in the upper middle Eocene (e.g. Axoprunum bispiculum, Amphicentria sp. 1 sensu Suzuki, Ceratocyrtisspp., Lithomelissa ehrenbergi,L. cf. haeckeli,
L. sphaerocephalis, L. tricornis, Pseudodictyophimus gra-cilipes gr., Tripodiscinus clavipes, Siphocampe nodosaria, Spirocyrtis joides, Aspis sp. A sensu Hollis,Clathrocyclas universa, Eurystomoskevos petrushevskaae, Lychnocanium waiareka,Aphetocyrtis gnomabax) or lower upper Eocene (Spirocyrtis greeni, Eurystomoskevos cauleti, Lophocyrtis jacchia hapsis,Lamprocyclas particollis) at Site 283.
4.4.4 ODP Site 1172
Forty-one samples were analysed from ODP Site 1172 spanning the middle Eocene–lower Oligocene interval, in-cluding four samples from Core 1172D-2R (356.875– 355.675 mbsf) and 37 from cores 1172A-48X to -39X (445.01–354.625 mbsf). The faunal assemblages of ODP Site 1172 were described by Suzuki et al. (2009), who did not correlate them to RP zones. Many taxa used to de-fine Southern Hemisphere RP zones at Site 277 are ab-sent at Site 1172 or have diachronous ranges.Eucyrtidium spinosum, the marker for Zone RP14(SH), has its LO at 373.75–371.21 mbsf, butLithomelissa tricornisand Pseudo-dictyophimus gracilipes are absent.Eucyrtidium antiquum has a single LO at 365.21 mbsf, but is absent in the early Oligocene.E. nishimurae is present within the middle and upper Eocene.Axoprunum irregularisis very abundant in the lower Oligocene interval at this site (356.875–354.625 mbsf), which we correlate to the upper RP15(SH) zone.
Spumellarians dominate the Site 1172 assemblages throughout the middle Eocene to lower Oligocene (∼82 %). The Litheliidae are the most abundant family, comprising about 20 % on average in the middle Eocene, 35 % in the upper Eocene, and 25 % in the lower Oligocene. Plagiacan-thidae (0.5–2.5 %), Eucyrtidiidae (0.5–3 %), Lophocyrtiidae (1.5–8 %) and Lychnocaniidae (0.5–2.7 %) account for most of the nassellarians. Fisherαdiversity and Simpson evenness are very high throughout the succession, ranging between ∼10 and 20 and between 0.82 and 0.96, respectively. Simi-lar to Site 277, diversity and evenness decrease in the lower Oligocene (Supplement Table 6).
Figure 6.Biogeographic affinities of radiolarian assemblages at DSDP Site 277 and the abundance of high-latitude taxa/families. MECO: Middle Eocene Climatic Optimum; PrOM: Priabonian Oxygen Isotope Maximum; EOT: Eocene–Oligocene transition.
Above ∼376 mbsf (∼38 Ma) the diatom assemblage indi-cates an inner to outer neritic regime (Röhl et al., 2004).
4.5 Trends in biogeographic affinities
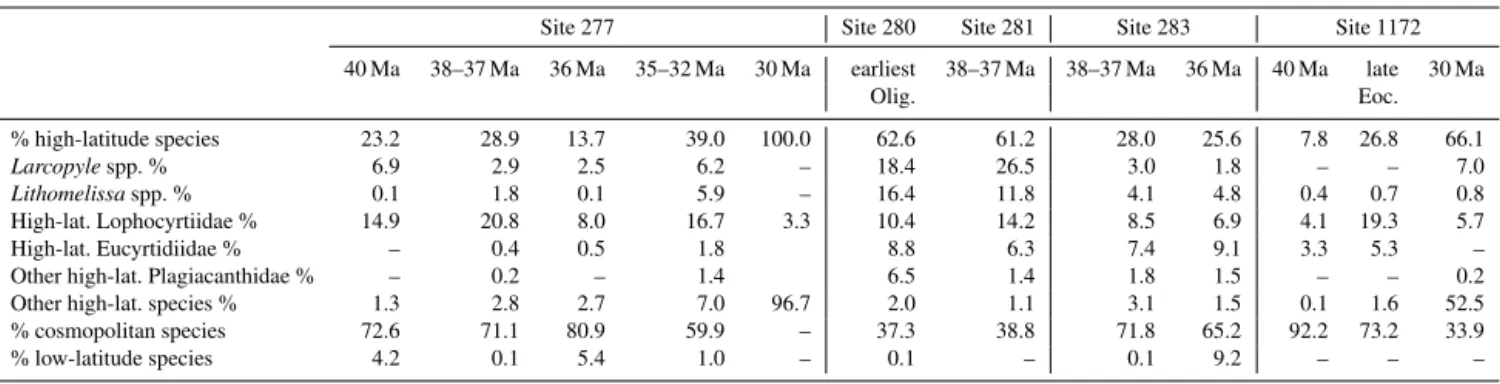
The radiolarian assemblages at our five sites include 92 species or species groups that can be assigned to one of three biogeographic categories: high latitude (50 taxa), cosmopoli-tan (38 taxa), and low latitude (4 taxa) (Table 1, Supplement Table 12). Biogeographic affinities remain poorly known for the remaining 39 taxa encountered at DSDP sites 277, 280, 281 and 283, and for ∼100 taxa at Site 1172 reported by Suzuki et al. (2009). Within the high-latitude group, six taxa are bipolar (Artostrobus annulatus,Axoprunum bispiculum, Ceratocyrtis spp., Cycladophora cosma cosma, Pseudodic-tyophimus gracilipesgr. andSpongopyle osculosa), whereas 45 taxa are inferred to be endemic to the Southern Ocean. Almost all species in the Litheliidae, Lophocyrtiidae and Pla-giacanthidae are high latitude. The biogeographic affinity of Lithelius minorgr. is considered to be cosmopolitan, but be-cause this group is very abundant in some assemblages, we
separate it out in Figs. 6 and 7. For Site 277, we also differ-entiate key high-latitude taxa within the three families noted above, namelyLarcopylespp.,Lophocyrtis longiventer and Lithomelissa spp., and the actinommidAxoprunum irregu-laris(Fig. 6).
Faunal affinities %
middle Eocene
IODP 1172
0 50 100 Faunal affinities %
late Eocene lRP15 uRP14 lRP14 RP12 early Whaingaroan Kaiatan Runangan 350 300 250 200 150 RP13 DSDP 277 Age RP(SH) Age RP(SH) mbsf NZ stages
E-O mbsf uRP15 RP10-13 *tr *tr *tr *tr
Lithelius minor gr.
Cosmopolitan Low-latitude
Biogeographic affinity
High-latitude
Theocyrtis tuberosa (tr=trace, a=abundant)
*
0 50 100
early Oligocene
e. Olig.
0 10 20 Fisher α diversity
MECO
0 10 20 Fisher αdiversity 0 50 100
Faunal affinities % DSDP 283 Age RP(SH) m.E. RP13 lRP14 * tr *tr *tr
0 10 20 Fisher αdiversity
Olig.
early late Eocene
lRP14 80 120 160 200 DSDP 280 Age RP(SH)
mbsf 0 50 100 Faunal affinities %
90 100 110 120 120 130 140 150 DSDP 281 mbsf early Oligocene lRP15
early late Eocene
L. Eoc. warming EOT 350 360 370 380 390 400 410 420 430 440 450
0 10 20 Fisher α diversity
uRP15 RP14 l. Eoc. *a PrOM middle Eocene ? Bortonian
Figure 7.Variation in faunal affinities for radiolarian assemblages and Fisherαdiversity at all sites. Dashed black lines indicate correlation between sites. The location of the MECO at Site 1172 is taken from Bijl et al. (2010).
During the late Eocene warming event, high-latitude taxa decrease to ∼13 % at Site 277 and only rare occurrences of Lithomelissa spp. and high-latitudeLophocyrtis spp. are noted (Fig. 6, Table 2). Late Eocene warming, however, coin-cides with the abundant occurrence of the low-latitude taxon Thyrsocyrtis pinguisicoides (up to 20 %) and the trace oc-currence of A. prolixum. Cosmopolitan taxa are dominated byLychnocanium spp., but general diversity also decreases within the warming event (Supplement Table 1). After this event, high-latitude taxa increase to up to∼50 % in the up-permost Eocene and lowermost Oligocene with the reap-pearance of all high-latitude taxa and an overall diversifica-tion (Fig. 6, Table 2). During the lower Oligocene, diversity declines and especially the Plagiacanthidae and Lophocyr-tiidae decrease in abundance. Lithelius minor gr. is domi-nant until∼144 mbsf Above 144 mbsf,Lithelius minor gr. decreases in abundance and high-latitude actinommids Axo-prunum bispiculumandA. irregularismake up∼97 % of the high-latitude assemblage (Fig. 6, Supplement Table 1).
At Site 1172, high-latitude taxa are present in the middle and upper Eocene, although varying between∼3 and 40 % of the assemblage for which biogeographic affinities have been established (Fig. 7). The MECO interval at Site 1172 (Core 1172D-45X; Bijl et al., 2010) corresponds to a mini-mum in high-latitude taxa, which is part of a longer minimini-mum in high-latitude taxa from 430 to 410 mbsf The most pro-found increase in high-latitude taxa at Site 1172 occurs in the lower Oligocene (∼50–80 %) with an increase in abundance ofA. irregularisto dominant levels, similar to Site 277. None
of the low-latitude taxa found at the other sites are present at Site 1172.
At Site 283, high-latitude taxa are present from the middle Eocene and range between∼12 and 35 %.Lithelius minor gr. is very abundant and varies between∼20 and 40 % in all samples (Fig. 7). We tentatively correlate the relatively high abundance in the low-latitude species Theocyrtis tuberosa (∼9 %) in the upper part of the studied section (87.75 mbsf) to the late Eocene warming event at Site 277. Sites 280 and 281 both have a higher proportion of high-latitude taxa in the lower upper Eocene to lower Oligocene than all other sites. High-latitude taxa range between∼40 and 73 % in the lower upper Eocene at Site 281 and between∼50 and 73 % in the lower Oligocene at Site 280 (Fig. 7). Several taxa that are present in the lower Oligocene at Site 280 are absent at Site 277, includingLithomelissa challengerae,Larcopyle frakesi, Lithomelissa sakaii, andAntarctissaspp. The abundance of Lithelius minorgr. is also high at sites 280 and 281, ranging between∼20 and 40 %.
5 Discussion
5.1 Comparison with geochemical temperature proxies
Table 1.Summary of species for which biogeographic affinities have been established and their presence (x) at sites 277, 280, 281, 283, and 1172. H: high latitude (> 45◦
N/S); L: low latitude (< 25◦
N/S); and C: cosmopolitan. Location of photographic images on plates for selected species.
Taxa Biogeogr. Site 277 Site 280 Site 281 Site 283 ODP1172 Plate affinity
Amphicentriasp. 1 sensu Suzuki H x x x x Pl. 2, Fig. 1
Amphicraspedum murrayanumHaeckel L x Pl. 1, Fig. 14
Amphicraspedum prolixumSanfilippo and Riedel gr. L x x Pl. 1, Figs. 15–17
Amphisphaera coronata(Ehrenberg) gr. C x x x Pl. 1, Fig. 2
Amphisphaera spinulosa(Ehrenberg) C x x Pl. 1, Fig. 5
Amphymenium splendiarmatumClark and Campbell C x x x x Pl. 1, Figs. 18, 19
Antarctissa cylindricaPetrushevskaya H x
Antarctissa robustaPetrushevskaya H x
Aphetocyrtis bianulus(O’Connor) H x x x Pl. 5, Fig. 1
Aphetocyrtis gnomabaxSanfilippo and Caulet H x x x x Pl. 5, Figs. 2–7
Aphetocyrtis rossiSanfilippo and Caulet H x x x Pl. 5, Figs. 8–11
Artobotrys auriculaleporis(Clark and Campbell) C x x
Artostrobus annulatus(Bailey) H x x
Artostrobuscf.pretabulatusPetrushevskaya H x Pl. 3, Fig. 13
Aspissp. A sensu Hollis H x x x Pl. 3, Figs. 14–16
Axoprunum bispiculum(Popofsky) H x x
Axoprunum pierinae(Clark and Campbell) gr. C x x x x x Pl. 1, Figs. 10, 11
Axoprunum?irregularisTakemura H x x Pl. 1, Fig. 12
Ceratocyrtisspp. H x x x x Pl. 2, Figs. 3–5
Cinclopyramis circumtexta(Haeckel) C x x x x x
Clathrocyclas universaClark and Campbell C x x x x
Clinorhabdus anantomusSanfilippo and Caulet H x x x Pl. 5, Figs. 12, 13
Clinorhabdus robusta(Abelmann) H x
Cornutella profundaEhrenberg C x x x x x
Cryptocarpium bussonii(Carnevale) gr. C x x x x x Pl. 5, Figs. 25a, b, 26a, b
Cryptocarpium ornatum(Ehrenberg) C x x
Cycladophora cosma cosmaLombari and Lazarus H x Pl. 3, Fig. 17
Cycladophora humerus(Petrushevskaya) H x x x Pl. 3, Fig. 18
Cycladophoraspp. H x x x
Cyrtolagena lagunculaHaeckel C x x
Dictyophimus pocillumEhrenberg C x
Dictyophimus? aff.archipiliumPetrushevskaya H x x x Pl. 4, Fig. 3a, b–8
Dictyophimus?archipiliumPetrushevskaya H x x x Pl. 4, Figs. 1a, b, 2
Eucyrtidium antiquumCaulet H x x x Pl. 3, Fig. 19
Eucyrtidium mariaeCaulet H x
Eucyrtidium nishimuraeTakemura and Ling H x x x Pl. 3, Fig. 20a, b
Eucyrtidium spinosumTakemura H x x x x Pl. 3, Fig. 21
Eucyrtidium montiparumEhrenberg C x x Pl. 3, Fig. 22
Eurystomoskevos cauletiO’Connor H x x x x Pl. 3, Fig. 23a, b
Eurystomoskevos petrushevskaaeCaulet H x x x x x Pl. 3, Fig. 24
Eusyringium fistuligerum(Ehrenberg) C x x Pl. 3, Fig. 25
Eusyringium lagena(Ehrenberg) C x
Glycobotrys nasuta(Ehrenberg) gr. C x x x x x Pl. 3, Figs. 5–7
Lamprocyclas particollisO’Connor H x x x x Pl. 5, Fig. 27
Larcopylecf.pylomaticus(Riedel) H x x Pl. 1, Fig. 25a, b
Larcopyle frakesi(Chen) H x Pl. 1, Fig. 20
Larcopyle hayesi(Chen) H x x x x Pl. 1, Fig. 21
Larcopyle labyrinthusaLazarus H x Pl. 1, Fig. 22
Larcopyle polyacantha(Campbell and Clark) gr. H x x x x Pl. 1, Figs. 23, 24
Larcopylespp. H x x x
Lithelius minorJörgensen gr. C x x x x x Pl. 1, Figs. 26–28
Lithomelissa challengeraeChen H x Pl. 2, Figs. 6–8
Lithomelissa ehrenbergiBütschli H x x x x x Pl. 2, Figs. 10, 11
Lithomelissa gelasinusO’Connor H x x x x Pl. 2, Figs. 12, 13
Lithomelissa robustaChen H x x Pl. 2, Fig. 16
Lithomelissa sphaerocephalisChen H x x x x Pl. 2, Fig. 17
Lithomelissaspp. H x x x x
Lithomelissa tricornis H x x x x Pl. 2, Fig. 18
Lithomelissa?sakaiiO’Connor H x Pl. 2, Fig. 19
Lophocyrtis(Apoplanius)aspera(Ehrenberg) H x x x Pl. 5, Figs. 14a, b–16
Lophocyrtis(Apoplanius)kerasperaSanfilippo and Caulet H x x x Pl. 5, Figs. 17–19
Lophocyrtis(Lophocyrtis)jacchia hapsisSanfilippo and Caulet H x x Pl. 5, Figs. 20–22
Table 1.Continued.
Taxa Biogeogr. Site 277 Site 280 Site 281 Site 283 ODP1172 Plate affinity
Lophocyrtis(Paralampterium)longiventer(Chen) H x x x x x Pl. 5, Figs. 23, 24
Lophocyrtisspp. H x
Lophophaena capitoEhrenberg C x x x
Lychnocanium amphitrite(Foreman) C x x x Pl. 4, Figs. 11a, b, c, 12
Lychnocanium babylonis(Clark and Campbell) C x x Pl. 4, Figs. 13a, b, 14
Lychnocanium bellumClark and Campbell C x x x Pl. 4, Figs. 15, 16
Periphaena decoraEhrenberg C x x x x x
Periphaena heliastericus(Clark and Campbell) C x x x x x
Plectodiscus circularis(Clark and Campbell) C x x x x x
Pseudodictyophimus galeatusCaulet H x Pl. 2, Fig. 20
Pseudodictyophimus gracilipes(Bailey) gr. H x x x x Pl. 2, Figs. 21–23
Pseudodictyophimusspp. H x Pl. 2, Figs. 24–27
Sethocyrtis chrysallisSanfilippo and Blome C x Pl. 3, Fig. 26a, b
Siphocampe nodosaria(Haeckel) C x x x x
Siphocampe quadrata(Petrushevskaya and Kozlova) C x x x x
Siphocampe?amygdala(Shilov) C x x Pl. 3, Figs. 11, 12
Sphaeropyle tetrapila(Hays) H x Pl. 1, Fig. 29
Spirocyrtis joides(Petrushevskaya) C x x x x
Spongodiscus cruciferus(Clark and Campbell) C x x x
Spongodiscus festivus(Clark and Campbell) C x x
Spongopyle osculosaDreyer H x x x x x Pl. 1, Fig. 13
Spongurus bilobatusClark and Campbell C x x x x
Stylosphaera minorClark and Campbell gr. C x x x x Pl. 1, Fig. 7
Theocampe amphora(Haeckel) C x
Theocampe urceolus(Haeckel) C x x x x
Theocyrtis tuberosaRiedel L x x Pl. 5, Fig. 30
Thyrsocyrtis pinguisicoidesO’Connor L x x Pl. 3, Fig. 27
Tripodiscinus clavipes(Clark and Campbell) C x x x
Zealithapium mitra(Ehrenberg) C x x Pl. 1, Fig. 8
Table 2.Average of total % of high-latitude species, groups, genera and high-latitude members of families for five time slices: Middle Eocene Climatic Optimum (MECO,∼40 Ma), early late Eocene/PrOM (∼38–37 Ma), late Eocene warming event (∼36 Ma), latest Eocene–earliest Oligocene (∼35–32 Ma) and early Oligocene (∼30 Ma).
Site 277 Site 280 Site 281 Site 283 Site 1172
40 Ma 38–37 Ma 36 Ma 35–32 Ma 30 Ma earliest 38–37 Ma 38–37 Ma 36 Ma 40 Ma late 30 Ma
Olig. Eoc.
% high-latitude species 23.2 28.9 13.7 39.0 100.0 62.6 61.2 28.0 25.6 7.8 26.8 66.1
Larcopylespp. % 6.9 2.9 2.5 6.2 – 18.4 26.5 3.0 1.8 – – 7.0
Lithomelissaspp. % 0.1 1.8 0.1 5.9 – 16.4 11.8 4.1 4.8 0.4 0.7 0.8
High-lat. Lophocyrtiidae % 14.9 20.8 8.0 16.7 3.3 10.4 14.2 8.5 6.9 4.1 19.3 5.7
High-lat. Eucyrtidiidae % – 0.4 0.5 1.8 8.8 6.3 7.4 9.1 3.3 5.3 –
Other high-lat. Plagiacanthidae % – 0.2 – 1.4 6.5 1.4 1.8 1.5 – – 0.2
Other high-lat. species % 1.3 2.8 2.7 7.0 96.7 2.0 1.1 3.1 1.5 0.1 1.6 52.5
% cosmopolitan species 72.6 71.1 80.9 59.9 – 37.3 38.8 71.8 65.2 92.2 73.2 33.9
% low-latitude species 4.2 0.1 5.4 1.0 – 0.1 – 0.1 9.2 – – –
Site 1172. The persistence of high-latitude taxa and the va-riety of cosmopolitan species at both sites suggests a warm temperate climate (15–20◦
C; Nelson and Cooke, 2001), in contrast to geochemical proxies suggesting a tropical climate (> 25◦
C) for the MECO at Site 1172 (Bijl et al., 2010) and ∼27◦C for the latest Eocene at Site 277 (Liu et al., 2009). The sea surface temperature estimates were derived from or-ganic proxies (TEX86 andUK
′
37) and may be biased towards
summer temperatures (Liu et al., 2009; Hollis et al., 2012). Although the interval of peak warmth may not be preserved in the MECO at Site 277, the relatively low abundance of tropical radiolarian taxa within the Palaeocene–Eocene
Ther-mal Maximum and early Eocene climatic optimum in the southwest Pacific has also been previously noted by Hollis (2006; Hollis et al., 2014).
5.2 Nature of the Antarctic assemblage
is shown in Table 2. We assigned all Lithomelissaspp. and Larcopyle spp. to the high-latitude group as they are more abundant at higher-latitude sites. Although we assigned a cosmopolitan affinity toLithelius minorgr., the palaeoecol-ogy of this group is not yet fully understood, as it tends to be most abundant at high-latitude sites. The sudden appear-ance of Lithomelissa spp. and other high-latitude taxa and diatoms at Site 277 indicates the expansion of high-latitude water masses across the southern Campbell Plateau in two phases: first during the PrOM event and again after the late Eocene warming event when a second diversification and in-flux of high-latitude taxa is observed.
5.3 High-latitude cooling and eutrophication during the PrOM event
5.3.1 Diagenesis
One possible explanation for the pronounced increase in radi-olarian abundance and diversity in the upper Eocene at Site 277 is that these trends are an artefact of biogenic opal di-agenesis. Chert nodules are recorded throughout the upper Palaeocene–middle Eocene section of the cored sequence at Site 277, with a transition between chert-bearing nannofos-sil chalk and overlying nannofosnannofos-sil ooze at 246 mbsf (lower upper Eocene) (Kennett et al., 1975). The presence of chert combined with the generally poorer preservation of radiolar-ians in the lower Palaeogene interval indicates some degree of diagenesis, which is also reflected in the range-through taxic richness analysis. However, the first major radiolarian turnover event occurs ∼20 m above the lithological tran-sition from chert-bearing nannofossil chalk to nannofossil oozes, which implies that the event represents a real increase in radiolarian and diatom abundance and not an artefact of diagenesis. No lithological changes are present at that level, which could explain the observed diversity decrease during the late Eocene warming event and the increase in diversity thereafter.
5.3.2 Climate cooling
The long-term cooling trend through the middle and late Eocene, which was interrupted by the short-lived MECO warming event, does not explain the sudden radiolarian di-versification in the late Eocene at Site 277. If gradual, long-term cooling was the driver of the expansion of high-latitude taxa, a progressive increase in such taxa would be expected over a longer time period. A gradual increase in high-latitude taxa is observed at Site 1172 from the middle Eocene but not at Site 277. Instead, the short-lived PrOM event appears to have been the trigger for the northward expansion of high-latitude taxa onto the Campbell Plateau. Whether this event was caused by an abrupt decline in atmospheric CO2
con-centrations or was related to the opening of the Tasmanian Gateway, which may have been open to surface circulation
in early middle Eocene (Bijl et al., 2013), cannot be de-termined. Furthermore, astronomically induced changes also may have played a role. Laskar et al. (2004) calculated nodes in the amplitude modulation of eccentricity and obliquity at ∼37 Ma and Röhl et al. (2004) found evidence at Site 1172 for the increasing dominance of the 100 kyr eccentricity cy-cle at∼37 Ma. Although there are nodes in amplitude modu-lation throughout the Eocene (Laskar et al, 2004), it is possi-ble that a combination of these phenomena (e.g. a decrease in atmospheric CO2, gateway opening and nodes in amplitude
modulation) caused a cooling event. The amplitude modu-lation of obliquity, in particular, has been linked to climatic cooling in the Oligocene (Pälike et al., 2006).
The PrOM event at ∼37 Ma may have been associated with the formation of small Antarctic ice sheets (Scher et al., 2014), which in turn may have caused an intensification of currents in the Southern Ocean. Funakawa and Nishi (2008) reported a marked increase in radiolarian taxa with Antarc-tic faunal affinities at ODP Site 689 (Maud Rise, southern Atlantic) in the earliest late Eocene (∼38.6–36.9 Ma; Chron C17), which they interpreted to signify the northward expan-sion of the polar front that may be related to the PrOM. A subsequent decrease in Antarctic taxa, spanning chrons 16 and 15 (∼37–35 Ma), was related to the late Eocene warm-ing event of Bohaty and Zachos (2003). These coolwarm-ing and warming events appear to have caused longer-lived changes in radiolarian faunal assemblages than those observed at Site 277, lasting 1.7 and 2.0 Ma, respectively. This may reflect specific differences in the oceanographic settings of the two sites. Although the late Eocene warming event appears to be short-lived at Site 277, it may have spanned a longer inter-val of time elsewhere in the southwest Pacific. Incursions of warm-water foraminifera, including the low-latitude genus Hantkenina, are known to have occurred in the middle late Eocene (late Kaiatan–early Runangan) in sedimentary basins of southern New Zealand (Hornibrook et al., 1989; Horni-brook, 1992).
5.3.3 Radiolarian biogeographic reconstruction
During the onset of the PrOM event in the early late Eocene (∼38–37 Ma, Fig. 8b), the abundance of high-latitude taxa increased at sites 1172 and 277. Additionally, sites 281 and 283 were characterised by high radiolarian abundance, with an average of∼61 and∼27 % high-latitude taxa, respectively. The region of high productivity expanded in this time, with the southernmost Site 281 having the high-est D/R ratio in the interval (Fig. 8b). The region might have experienced an intensification of the Ross Gyre, extending the region of high productivity onto the Campbell Plateau and creating the Subtropical Front (STF) (Nelson and Cooke, 2001) (Fig. 8b).
During the late Eocene warming event (∼36 Ma, Fig. 8c), radiolarian diversity decreased abruptly at Site 277, together with a decrease in high-latitude taxa (Lithomelissaspp., Lar-copyle spp., Lophocyrtiidae; Table 2) and diatoms, and the appearance of low-latitude taxa at sites 283 and 277. Site 281 contains a late Eocene hiatus, implying an increase in the strength of bottom-water currents across the Tasmanian Gateway. We suggest that these changes were associated with a southward shift of the EAC that pushed the high-productivity zone of the STF towards the south, explaining the low radiolarian abundance and drop in diversity at Site 277. There is little evidence that the large Tasman Current as proposed by Huber et al. (2004) and Bijl et al. (2010) existed in the middle and late Eocene. Instead, our data suggest Site 277 was positioned at the northernmost limit of the influence of the Ross Gyre and the southernmost site of the influence of warm water delivered by the EAC.
During the latest Eocene–earliest Oligocene interval (∼35–32 Ma, Fig. 8d), Site 277 experienced a second siliceous plankton bloom, associated with high radiolarian and diatom abundance and the reappearance of high-latitude taxa (Table 2). This suggests that latest Eocene cooling led to the expansion of the Ross Gyre to encroach on Camp-bell Plateau (Fig. 8d). At the same time, and perhaps re-flecting strengthening of northward- and westward-flowing bottom currents, the area of non-deposition widened across the Tasmanian Gateway over sites 281, 283 and 1172. Dur-ing the earliest Oligocene, the abundance of radiolarians and diatoms at Site 280 suggests a region of high primary pro-ductivity. This may have been a consequence of intensified upwelling associated with the ASC in conjunction with deep-ening in this sub-basin.
In contrast, diversity declines at Site 277 in the early Oligocene (Fig. 8e) and diatoms become scarce. The radi-olarian fauna becomes dominated byLithelius minorgr. and Actinommidae and many high-latitude taxa disappear (e.g. Lithomelissaspp., Table 2). This may be related to the devel-opment of the ACC. The ACC is inferred to have developed at ∼30 Ma as the Tasmanian Gateway became fully open (Carter et al., 2004) and its northward expansion brought it in line with the westerly wind belt (Scher et al., 2015). This resulted in the zone of non-deposition extending over Site 280 as it moved into the path of the ACC. At Site
277, the radiolarian fauna is dominated by the high-latitude species Axoprunum irregularis, which is also dominant at Site 1172. Thus, the general low diversity of radiolarians and the scarcity of diatoms at Site 277 suggests the establishment of a cold-water nutrient-depleted environment, similar to the modern setting (Hollis and Neil, 2005). The development of the ACC restricted the northward extent of Ross Gyre and served to establish the Subantarctic Front on the southern margin of the Campbell Plateau (Carter et al., 2004).
6 Conclusions
Middle Eocene–early Oligocene radiolarian assemblages from DSDP sites 277, 280, 281, 283 and ODP Site 1172 were examined to investigate the relative influence of low-and high-latitude water masses in the southern southwest Pacific Ocean as global climate cooled and ice sheets ex-panded in Antarctica. In contrast to temperature reconstruc-tions based on geochemical proxies that indicate subtropical– tropical temperatures at high latitudes during the middle and late Eocene (Liu et al., 2009; Bijl et al., 2010), Eocene radi-olarian assemblages in this region lack significant numbers of warm-water taxa. Furthermore, we show that many high-latitude and taxa endemic to the Antarctic are already present in the middle Eocene. The MECO has been identified at Site 277 from foraminiferalδ18O records and is associated with a short-lived incursion of two taxa with low-latitude affini-ties,Amphicraspedum prolixumgr. andA. murrayanum. The absence of definitive tropical taxa suggests warm temperate rather than tropical conditions during this short-lived event.
Cold, nutrient-depleted waters
Non-deposition/condensed sedimentation Area of primary productivity/common diatoms
EAC: East Australian current LC: Proto Leeuwin current ASC: Antarctic slope current ACC: Antarctic circumpolar current
SAF: Subantarctic front STF: Subtropical front
% High-latitude (blue) % Cosmopolitan (yellow) % Low-latitude (red) Biogeographic affinity High abundance (>1000rads/gr) Low abundance (<1000rads/gr) (b)
Clay-rich sediment with palynomorphs
-160° -160° 180° 180° 160° 160° 140° -140° 120° -120° -40° -40° -50° -50° -60° -60° 283 1172
MECO (~40 Ma)
281 ! ! ! ! EAC Ross Gyre -160° -160° 180° 180° 160° 160° 140° -140° 120° -120° -40° -40° -50° -50° -60° -60° ! !277 EAC EAC
Ross Gyre Ross Gyre
! ! ! -160° -160° 180° 180° 160° 160° 140° -140° 120° -120° -40° -40° -50° -50° -60° -60° 281 283 1172
Late Eocene warming event (~36 Ma)
281
280 ASC
STF
Ross Gyre
Early Oligocene (~30 Ma)
SAF
EAC
EAC (a)
(c) (d)
ASC -160° -160° 180° 180° 160° 160° 140° -140° 120° -120° -40° -40° -50° -50° -60° -60° ! 280 ! ! ! ! -160° -160° 180° 180° 160° 160° 140° -140° 120° -120° -40° -40° -50° -50° -60° -60° STF 277 280 281 1172 283 !
Latest Eocene-earliest Oligocene (~35-32 Ma)
Early late Eocene/PrOM (~38-37 Ma)
283! ! 1172 277 1172 ! 283 ! ASC Ross Gyre Warm current Cold current Frontal systems STF 277 ! 280 ! LC ! ! ! ACC STF !277 (e) 281 ! ASC 280 ASC