Marco Antonio da Silva Ferro*
Institute of Aeronautics and Space São José dos Campos/SP – Brazil
Jorge Yamasaki
Institute of Aeronautics and Space São José dos Campos/SP – Brazil [email protected]
Douglas Roberto M. Pimentel
Institute of Aeronautics and Space São José dos Campos/SP – Brazil
Kleber Pinheiro Naccarato
National Institute for Space Research São José dos Campos/SP – Brazil [email protected]
Marcelo Magalhães Fares Saba
National Institute for Space Research São José dos Campos/SP – Brazil [email protected]
*author for correspondence
Lightning risk warnings based
on atmospheric electric ield
measurements in Brazil
Abstract: This paper presents a methodology that employs the electrostatic ield variations caused by thundercloud formation or displacement to generate lightning warnings over a region of interest in Southeastern Brazil. These warnings can be used to prevent accidents during hazardous operations, such as the manufacturing, loading, and test of motor-rockets. In these cases, certain equipment may be moved into covered facilities and personnel are required to take shelter. It is also possible to avoid the threat of natural and triggered lightning to launches. The atmospheric electric ield database, including the summer seasons of 2007/2008 and 2008/2009 (from November to February), and, for the same period and region, the cloud-to-ground lightning data provided by the Brazilian lightning detection network – BrasilDAT – were used in order to perform a comparative analysis between the lightning warnings and the cloud-to-ground lightning strikes that effectively occurred inside the area of concern. The analysis was done for three areas surrounding the sensor installation deined as circles with 5, 10 and 15 km of radius to determine the most effective detection range. For each area it was done using several critical electric ield thresholds: +/- 0.5; +/- 0.8; +/- 0.9; +/- 1.0; +/- 1.2; and +/- 1.5 kV/m. As a result of the reduction of atmospheric electric ield data provided by the sensor installed in area of concern and lightning provided by BrasilDAT, it was possible, for each of the areas of alert proposals, to obtain the following parameters: the number of effective alarms; the number of false alarms; and the number of failure to warning. From the analysis of these parameters, it was possible to conclude that, apparently, the most interesting critical electric ield threshold to be used is the level of 0.9 kV/m in association with a distance range of 10 km around the point where the sensor is installed.
Keywords: Atmospheric electric ield, Electric ield-mill, Lightning.
IntroductIon
A recent study showed that more than half of lightning
casualties resulted from the irst or one of the irst few cloud-to-ground (CG) lashes in a storm, and signiicant
numbers of casualties resulted from returning to outdoor activities just before lightning had actually ceased (Lengyel, 2004). Between these times, when the threat of lightning is obvious, there are fewer casualties. Thus, it can be concluded that the initiation and cessation of lightning activity are critically important periods for both patrimonial and human safety. Therefore, great effort has been made to develop methods for accurate lightning occurrence forecast both to make secure the development of critical activities and to protect human life in several outdoor activities.
Several papers have dealt with lightning warning methods developed from CG lightning location systems (LLS) (Murphy and Cummins, 2000; Murphy et al., 2002; Holle et al., 2003). Furthermore, other particular researches combine total lightning with weather radar information in an effort to improve the accuracy of lightning threat alarms (Murphy and Holle, 2005; 2006). Finally, some recent studies presented automated lightning warning systems as a combination of lightning detection information and data
from one or more electric ield mills (EFMs) (Murphy
et al., 2008; Montanya et al., 2008; Beasley et al., 2008; Aranguren et al., 2009). These studies had shown that
the EFM measurements were strongly inluenced by the
characteristics of the place where it was installed, for example: the cloud charge center height in that region, the topography, and so on. Thus, the effectiveness of lightning
warning methods using electric ield data changes in
one region to another. It is important to note that all the studies took place in the Northern hemisphere. Naccarato et al. (2008) showed a preliminary analysis comparing
automatic warnings triggered only by EFM and those
based only in CG lightning discharge occurrence in a
speciic region in Southeastern Brazil.
The present study extends the former analysis carried out by Naccarato (2008) for the same region, located in São José dos Campos, state of São Paulo,
comparing data from one EFM to the CG lightning data provided by the Brazilian Lightning Detection
Network (BrasilDAT) to evaluate how the atmospheric electric field variation data can be used to support the decision-making process of generating a lightning risk warning.
BASIc conSIdErAtIonS
EFM
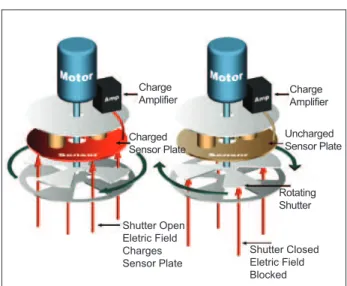
EFMs are designed to determine the relative strength of the electric ield by comparing its level in a known, stable,
uncharged, and reference object. When an uncharged
sensor plate is exposed to an electric ield, it becomes
charged. Thus, unlike lightning detection systems, which
respond to fast transients in the electromagnetic ield generated by lightning, EFMs detect the electrostatic ield and relatively slow changes in that ield. They detect
the presence of charge separation and net charge directly above and in the immediate surroundings of the sensor. Depending on where the charge is located, the effective
detection range of an EFM varies from a few kilometers
to perhaps as much as 20 km (Murphy et al., 2008). Field changes in the order of a fraction of a second are due to the overall rearrangement of the thundercloud charge
distribution, which is produced by a lightning lash, and slower ield changes are due to cloud electriication and
rearrangement of space charge in the atmosphere. Hence, since the conditions are constantly changing, there is a need to constantly measure the strength of the electric
ield, which is translated into the need to alternately read
the charged state of the sensor plate, discharge it, and read again. This is accomplished by repeatedly exposing
the sensor plate to the external electric ield to charge
it, then shielding the plate to allow it to discharge. The process of exposing (charging) and shielding
(discharging) the sensor plate from the electrical ield
is accomplished by means of a rotary shutter, consisting of a motor-driven, mechanically complementary rotor/ stator pair. As the motor rotates, the shutter alternately
opens to allow the external electric ield to charge the
sensor plate, and then it closes (Fig. 1) in order to shield the sensor plate to discharge or reset, in preparation for the next measurement.
The main advantage of the EFM is the protection from the occurrence of the irst CG lightning strike.
Electric ield meters are typically factory calibrated
using a parallel plate method, where a uniform electric
ield is developed by applying a known voltage between parallel conductive plates. Each EFM is factory calibrated in a parallel plate calibration ixture with the
instrument aperture mounted in upward-facing. A linear
it of the calibration data results in a calibration equation
expressed as:
E = f.V (1)
The multiplier f is a function of the EFM electrode
dimensions and the characteristics of the charge ampliier’s electronic circuit. The manufacturer of the EFM used in
this study estimated that the measurement accuracy of f for the instrument calibrated in the parallel plate electric
ield calibrator is ±1%.
However, when monitoring the Earth’s electric ield, Eq. 1 is valid only if the instrument aperture is mounted lush with the Earth’s surface and upward-facing.
Yet, for permanent outdoor measurements of electric
ield, a lush-mounted and upward-facing orientation
is problematic because of dirt, bird droppings, rain, and so on, collecting on the sense electrodes and
fouling the measurement. Consequently, a downward facing and elevated coniguration is used for long-term ield applications. Inverting the EFM reduces the
effective gain, while increasing it height above ground enhances the gain, with respect to an ideal
upward-facing lush-mounted geometry. A site correction factor
Csite is necessary to correct f for non lush-mounted
conigurations. The corrected multiplier becomes as Eq. 2:
E = Csite.f.V (2)
Shutter Open Eletric Field Charges Sensor Plate
Charged Sensor Plate
Charge
Amplifier ChargeAmplifier
Uncharged Sensor Plate
Rotating Shutter
Shutter Closed Eletric Field Blocked
In this equation, f is unique for each EFM, yet
independent of a given site, whereas Csite is unique for each given site, yet independent of the particular
EFM used at the site. Csite is typically determined
by using a lush-mounted upward-facing unit in the
vicinity of the site that needs correction. An
upward-facing calibration kit was used to hold the EFM in a lush-mounted upward-facing position. The collected
data from both units, the upward-facing unit and a
downward facing EFM installed in a speciic site, are plotted (Fig. 2). A best-it line computed from the data
resulted in the Csite.
LLS
A LLS can locate CG lightning lashes with detection eficiency (DE) higher than 80% and location accuracy lower
than 500 m, due to its network of precise sensors that detect the electromagnetic radiation of the lightning channels.
Furthermore, based on quality criteria and correction
parameters, the central processing unit (responsible for computing the solutions based on the sensor reports) can discriminate more than 90% of the intracloud (IC)
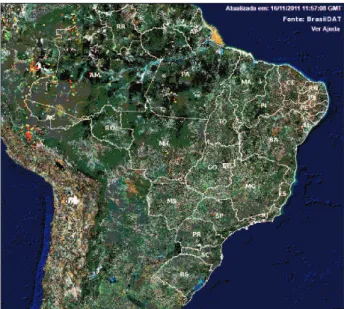
discharges from CG lightning strokes. In Brazil, there
is a LLS operating since 1998, called BrasilDAT. Nowadays, this network is composed by 36 sensors as shown in Fig 3.
The BrasilDAT overall DE was already estimated by a DE model (DEMo) recently developed by the ELAT Group
(Naccarato and Pinto Jr., 2008). A large area of the country
is covered by an 80% or higher DE network.
coMPLEMEntArY oBSErVAtIonS
Charge separation inside a thunderstorm cloud causes a reversal of the electrostatic polarity and an increase in the
-10000 -8000
EF for downward facing position
E
F
u
p
w
a
rd
f
a
c
in
g
p
o
s
iti
o
n
y = 0.110x + 9.917 R2 = 0.813
-1400 -1200 -1000 -800 -600 -400 -200 0 0 200
-6000 -4000 -2000 2000
magnitude of the ield measured by an EFM in its vicinity.
These characteristics can be used to trigger a warning, given that charge separation has to precede lightning. However,
in not all cases does the ield reverse polarity at a particular EFM site as a storm develops, and the exact magnitude reached by the ield depends strongly on the distance between the EFM and the cloud charge regions (Murphy, 1996). Thus, a warning system using a ixed threshold for the ield magnitude may or may not pick up all storms.
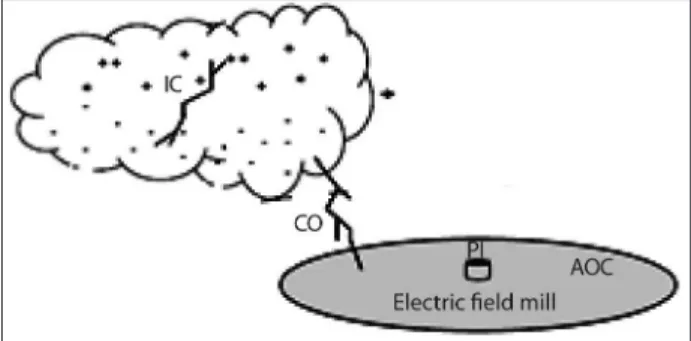
A LLS has a greater effective detection range (about
hundreds of kilometers) than an EFM (about one or two
tens of kilometers). Thus, a LLS is more effective than an
EFM to detect cases where a mature thunderstorm moves
toward the area of concern (AOC) from elsewhere.
LLS is a complex measurement system that by itself can help to provide a relative accurate CG lightning forecast to a particular area. However, the main disadvantages of a LLS are the very high installation and maintenance costs
and it is not able to forecast the irst CG lightning strike. Thus, the main reason for using EFMs is their capability
of detecting the development of a thunderstorm directly over the AOC (Fig. 4).
installed in São José dos Campos (23º19’48.20”S and 45º48’31.85”W) in the Southeast region of Brazil. This
period includes the summer seasons of 2007/2008 and 2008/2009 (from November to February). For the same period and region, it was selected the CG lightning data provided by the BrasilDAT network in order to perform a comparative analysis between the lightning warnings and the CG lightning strikes, which effectively occurred inside the AOC.
There were multiple thunderstorms that moved over the AOC during the period of the study. Some of them started and developed directly over the AOC. In the others cases a mature thunderstorm moved towards the AOC from elsewhere. Most of them moved from South to the North, following the direction of the valley formed by two
chains of mountains named “Serra do Mar” and “Serra da Mantiqueira”, where the city of São José dos Campos
is located.
Therefore, the main purpose of this analysis is to simulate lightning warnings based on the atmospheric
electric ield measurements provided by the EFM and
to compare them to the CG lightning data provided by the BrasilDAT network after some time from the beginning of warning. Thus, it is possible to evaluate
the performance of the atmospheric electric ield monitoring system. In order to simulate EFM automatic warnings, the equipment is assumed to be installed in
the center of the AOC.
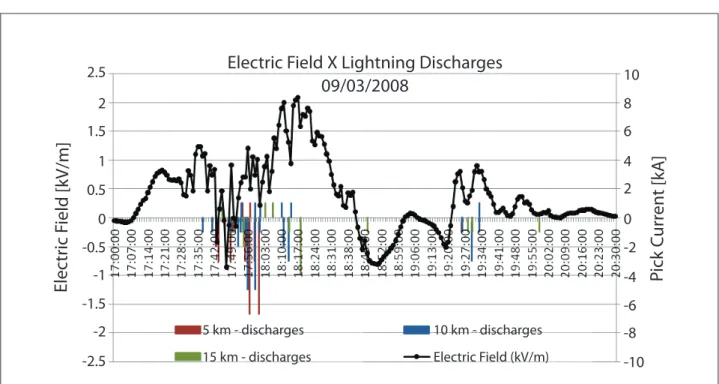
High frequency oscillations due to the rearrangement
of cloud charge by lightning are also detected by the
EFM during a thunderstorm. These fast ield changes
have to be removed from the dataset to avoid that the
lightning-caused ield changes make the ield rise above
the threshold level used in a warning system. The use of
a 60-second average of the EFM measurement values is assumed to be a satisfactory smoothing technique to ilter high frequency oscillations. Figure 5 shows an example of this smoothing technique.
The warnings will be evaluated based on the following parameters:
• effective alarm (EA) is the warning that was triggered
before the CG lightning occurred inside the AOC;
• lead time (LT) is the time interval between the time
of the warning and the occurrence of a CG lightning inside the AOC;
• failure to warning (FTW), when the irst CG
lightning strikes the AOC area without a previous warning;
Figure 4. Area surrounding the sensor installation site.
oBJEctIVES
The main objective of this study was to deine criteria that will be used by an atmospheric electric ield monitoring
system to provide lightning risk warnings.
Since the AOC is located in a region that has good coverage by the BrasilDAT, it is possible to compare
the warnings generated by the EFM to the CG lightning
data provided by BrasilDAT in order to evaluate the rate of false warnings and/or fail to warning based on some
critical ield thresholds.
MEtHodoLoGY
They will help evaluating how the atmospheric electric field data could be used to better support the correct threshold level trigger of a lightning risk warning.
The analysis will be done for both circular and annular regions. On one hand, the influence of the number of
EA, FA and FTW is better denoted using the annular
regions ranging from 0 to 5 km; 5 to 10 km, and 10 to 15 km. On the other hand, to calculate the POD and the FAR is better to use areas surrounding the sensor installation defined as circles with 5, 10 and 15 km of radius. The analysis for each area is going to be done using several critical electric field thresholds: +/- 0.5; +/- 0.8; +/- 0.9; +/- 1.0; +/- 1.2; and +/- 1.5 kV/m. The warning is classified as successful if one or more CG lightning strike(s) is(are) detected inside the AOC up to 45 minutes after the warning is triggered. A delay time (DT) of 45 minutes is adopted to alarm extinction. This value was chosen as the mid-range of the active phase of a storm cloud found in literature. The count of DT is restarted every time an alert criterion is detected.
rESuLtS And dIScuSSIon
The total number of EA, FA and FTW was analyzed as a function of critical electric ield threshold and the distance of sensor installation site. The behavior of the EA, FA and
FTW total numbers are resumed in Table 2.
observed
Yes no total
Forecast
Yes EA FA Forecast
No FTW CNW Not
Forecast
Total Observed Not
Observed Total Table 1. Contingence table.
EA: effective alarm; FA: false alarm; FTW: failure to
warning; CNW: correctly not warned.
• false alarm (FA) is a warning triggered without the subsequent occurrence of a CG lightning inside the
AOC after 45 minutes since the trigger.
The forecast veriication will be done based on the
contingence table described in Table 1. Figure 5. Example of the smoothing technique.
5 km - discharges
Electric Field X Lightning Discharges
09/03/2008
10 km - discharges
-10 -2.5
-2 -1.5 1.5 2 2.5
-1 1
-0.5 0.5 0
-8 -6 -4 -2 0 2 4 6 8 10
P
ick C
ur
ren
t [kA
]
Elec
tr
ic F
ield [kV/m]
Electric Field (kV/m) 15 km - discharges
Two statistical variables will be used in this study: the probability of detection (POD), which is simply the ratio of the number of successful warnings to the total number of episodes of a CG in the AOC, and the FA rate (FAR), which is the ratio of the number of FA to the total number
of alarms (Eqs. 3 and 4).
POD = EA / (EA + FTW) (3)
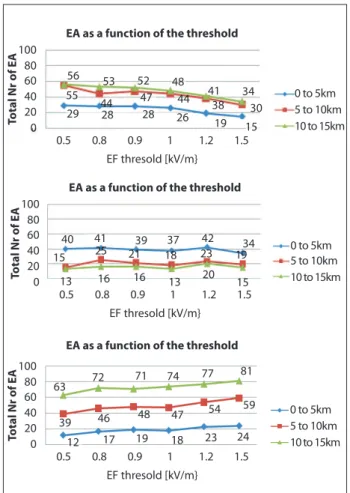
Figure 6 shows the behavior of the EA, FA and FTW total numbers as a function of the electric ield threshold. The results show that the total number of EA decreases, while the electrical ield threshold increases. But it shows a
steady value between 0.8 and 1.0 kV/m dropping again
from this point. There is a signiicative increase in the total number of EA when the annular region is changed
from 0 to 5 km to 5 to 10 km. However, between the annular regions of 5 to 10 km and 10 to 15 km, the total
numbers of EA are very close, suggesting that there is no signiicant gain changing the annular region from 5 to 10
km to 10 to 15 km.
The FA behavior shows a smooth oscillation with the smaller number of FA occurring for the threshold of 1.0
kV/m. It is very interesting the signiicant decrease in the
total number of FA when the annular region is changed from 0 to 5 km to 5 to 10 km. But, in the same way that
EA, between 5 to 10 km and 10 to 15 km the total numbers of FA are very close, suggesting that there is no signiicant
gain changing the annular region from 5 to 10 km to 10 to 15 km. The total number of FTW increases when the distance range is increased, which shows a smooth oscillation between 0.9 and 1.0 kV/m.
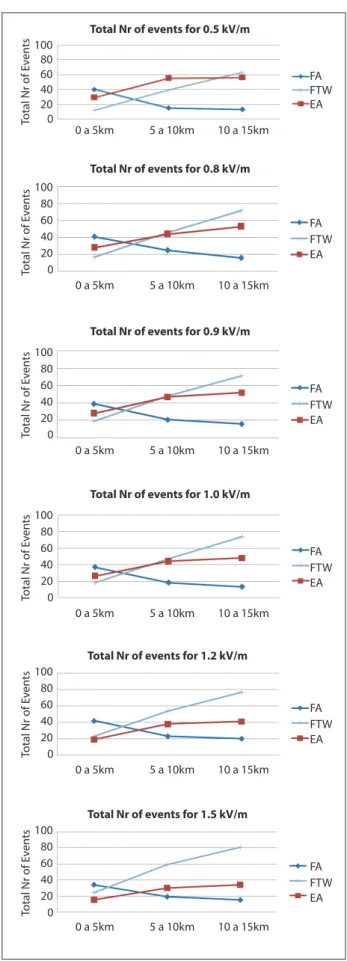
Figure 7 shows the behavior of the total number of EA,
FA and FTW as a function of the distance from the sensor. It is possible to note that the total number of FA and FTW
does not suffer signiicant modiication when the electric ield threshold increases. Also, it is possible to note that there is no signiicant change in the total number of EA
when the annular region changes from 5 to 10 km to 10
to 15 km for all electric ield thresholds. In general, the
total number of EA continuously decreases when the ield
threshold increases, after 1.0 kV/m, and for the annular
region 5 to 10 km and bigger EA is smaller than FTW.
Therefore, from the point of view of total number of events
of EA, FA and FTW, apparently the most interesting critical electric ield threshold to be used is the level of 0.9 kV/m
for the annular region of 5 to 10 km. Though the annular
region from 10 to 15 km shows the biggest number of EA
events, it also shows a high number of FTW.
Taking into account safety, it is better to adopt a
coniguration that results in a small number of FTW, although resulting in a EA reduction and some increase in the FA number, mainly when the total numbers of EA for
the annular region of 5 to 10 km and 10 to 15 km are very close, as shown in Figs. 5 and 6.
The ratio of predicted CG lashes versus FTW shows larger
values (between 6:1 and 2:1) for all electric ield thresholds
when the actuation area of the sensor is restricted to a radius
of 5 km as shown in Table 3. The ratio shrinks as the sensor’s
actuation area increases, reaching 1:1, i.e., for each predicted
CG lash there is another that the sensor failed to predict. distance
range (km)
Critical electric ield threshold
(kV/m)
0.5 0.8 0.9 1.0 1.2 1.5
Total nr of
EA
0 to 5 29 28 28 26 19 15
5 to 10 55 44 47 44 38 30
10 to 15 56 53 52 48 41 34
Total nr of FA
0 to 5 40 41 39 37 42 34
5 to 10 15 25 21 18 23 19
10 to 15 13 16 16 13 20 15
Total nr of FTW
0 to 5 12 17 19 18 23 24
5 to 10 39 46 48 47 54 59
10 to 15 63 72 71 74 77 81
EA: effective alarm; FA: false alarm; FTW: failure to
warning.
Table 2. Total number of EA, FA and FTW.
EF thresold [kV/m} EA as a function of the threshold
T
otal N
r of EA
0.5 29 55
56 53 52
44 47 48 44 26 19 38 41 34 30 15 28 28 0 20 40 60 80 100
0.8 0.9 1 1.2 1.5
0 to 5km 5 to 10km 10 to 15km
EF thresold [kV/m} EA as a function of the threshold
T
otal N
r of EA
0.5 13 15
41
40 39 37 42 34
19 23 18 21 25
16 16 13 20 15 0 20 40 60 80 100
0.8 0.9 1 1.2 1.5
0 to 5km 5 to 10km 10 to 15km
EA as a function of the threshold
EF thresold [kV/m}
T
otal N
r of EA
0.5
12 17 19 18 23 24 59 54 47 48 46 39
63 72 71 74
77 81 0 20 40 60 80 100
0.8 0.9 1 1.2 1.5
0 to 5km 5 to 10km 10 to 15km
0 a 5km
Total Nr of events for 0.5 kV/m
Total N
r of E
v en ts 0 20 40 60 80 100
5 a 10km 10 a 15km
FA
EA FTW
Total Nr of events for 0.8 kV/m
0 a 5km 5 a 10km 10 a 15km
FA
EA FTW
Total N
r of E
v en ts 0 20 40 60 80 100
Total Nr of events for 0.9 kV/m
FA
EA FTW
0 a 5km 5 a 10km 10 a 15km
Total N
r of E
v en ts 0 20 40 60 80 100
Total Nr of events for 1.0 kV/m
FA
EA FTW
0 a 5km 5 a 10km 10 a 15km
Total N
r of E
v en ts 0 20 40 60 80 100
Total Nr of events for 1.2 kV/m
FA
EA FTW
0 a 5km 5 a 10km 10 a 15km
Total N
r of E
v en ts 0 20 40 60 80 100
Total Nr of events for 1.5 kV/m
FA
EA FTW
0 a 5km 5 a 10km 10 a 15km
Total N
r of E
v en ts 0 20 40 60 80 100
Figure 7. Total numbers of EA, FA and FTW as a function of the distance range of sensor.
distance range
(km)
Critical ield threshold
(kV/m)
0.5 0.8 0.9 1.0 1.2 1.5
(EA + FA)/
FTW
5 6 4 4 4 3 2
10 3 3 3 2 2 1
15 2 2 2 2 1 1
Table 3. Relationship between predicted CG lash versus FTW.
EA: effective alarm; FA: false alarm; FTW: failure to
warning.
radius (km)
Critical ield threshold (kV/m)
0.5 0.8 0.9 1.0 1.2 1.5
EA/(EA +
FTW)
5 73 64 62 61 48 41
10 67 59 60 58 49 43
15 58 52 52 50 44 39
Table 4. Probability of detection.
EA: effective alarm; FA: false alarm; FTW: failure to
warning.
However, the ratio of predicted CG lash versus FTW is an approximated notion of warning effectiveness.
The POD results in a more adequate indicator inasmuch as it takes into account the EA instead of the predicted CG lash number, indicating the percentage of lightning events observed, indicated as “yes” in the contingency table (Table 1), which have been properly warned (Eq. 3). The POD as a function of the electric ield threshold and sensor’s actuation area is shown in Table 4.
The use of the electric ield threshold of 0.9 kV/m
together with the area with a radius of 10 km, suggested by previous analyses, leads to a POD value of 60%, bigger than values found in some past studies. Using an electric
ield threshold of 1.0 kV/m, Aranguren et al. (2009) found 37.5% for POD in Catalonia, Spain, and Murphy et al. (2008) found 34.4% in Florida. Naccarato et al. (2008) in a previous study carried out in the same area of the present
paper, analyzing a dataset of 30 days and continuous
records and using a threshold of 0.5 kV/m and distance range of 10 km, found that 82.4% of the discharges inside their AOC were correctly warning. Beasley et al. (2008)
observed that the electric ield magnitude exceeded 1.0
kV/m, inside an area with radius of 10 km around the
strike point and ten minutes before the irst stroke, in
66.0% of the cases.
The fair-weather electric ield could present values of
some few hundred Volts/m due to some disturbances (e.g.,
FA. FAR indicates the percentage of FA related to the total
number of predicted lashes (Eq. 4). FAR as a function of the critical ield threshold and sensor’s actuation area is
shown in Table 5.
• Beasley and Murphy (2008) used the data from the network of EFM at the Kennedy Space Center and
the adjacent Cape Canaveral Air Force Station that
comprises 31 sensors, though Murphy had analyzed
the data from only two sensors in the network.
concLuSIonS
With the purpose of evaluating how the atmospheric electric field variation data can be used to support the decision-making process of generating a lightning risk warning, it was used information from an atmospheric electric field database from November, 2007 to
February, 2009 using an EFM in Southeastern Brazil.
Since the area of interest lies in a region with excellent coverage of BrasilDAT, it was possible to compare the warnings generated by the proposed system to the CG lightning data provided by BrasilDAT in order to evaluate the rate of false warning and/or fail to warning based on some electric field thresholds.
The analysis was carried out for both circular and annular regions. The influence of the numbers of
EA, FA and FTW is better denoted using the annular
regions of 0 to 5 km, 5 to 10 km and 10 to 15 km. To calculate the POD and the FAR, it is better to use areas surrounding the sensor installation defined as circles with 5, 10 and 15 km of radius. The analysis for each area was done using several electric field thresholds: +/- 0.5; +/- 0.8; +/- 0.9; +/- 1.0; +/- 1.2; e +/- 1.5 kV/m. As a result of the reduction of atmospheric electric field data provided by the sensor installed in AOC and lightning provided by BrasilDAT, it was possible, for each of the areas of alert proposals, to obtain the
following parameters: the number of EA; the number
of FA; and the number of FTW.
From the analysis of these parameters, it was possible to conclude that, apparently, the critical electric field threshold more interesting to be used is the level of 0.9 kV/m in association with a distance range of 10 km around the point where the sensor was installed.
radius (km)
Critical ield threshold
(kV/m)
0.5 0.8 0.9 1.0 1.2 1.5
FA/(EA + FA)
5 57 59 57 58 68 68
10 38 46 41 41 50 49
15 32 38 35 35 43 42
EA: effective alarm; FA: false alarm.
Table 5. False alarm rate.
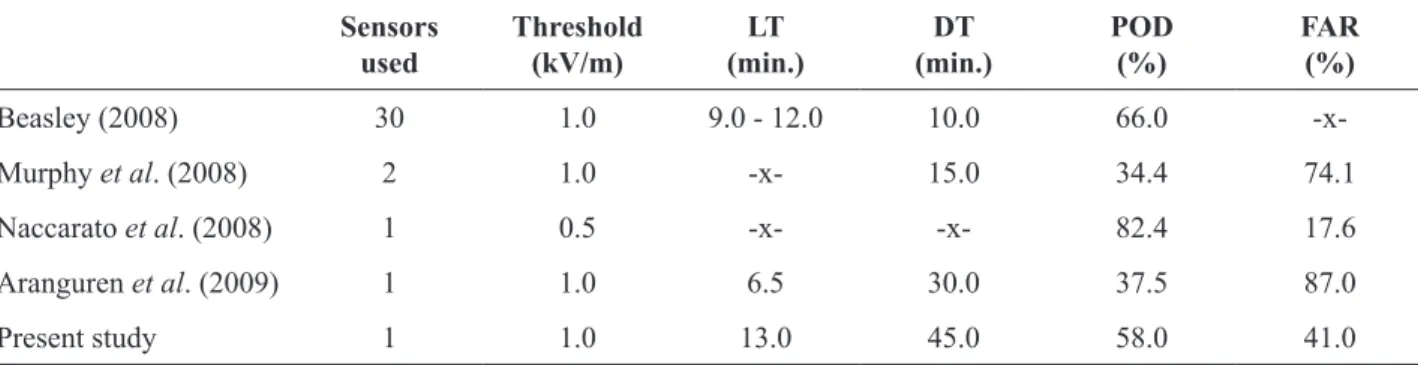
Sensors used
Threshold
(kV/m)
Lt (min.)
dt (min.)
Pod (%)
FAr (%)
Beasley (2008) 30 1.0 9.0 - 12.0 10.0 66.0
-x-Murphy et al. (2008) 2 1.0 -x- 15.0 34.4 74.1
Naccarato et al. (2008) 1 0.5 -x- -x- 82.4 17.6
Aranguren et al. (2009) 1 1.0 6.5 30.0 37.5 87.0
Present study 1 1.0 13.0 45.0 58.0 41.0
Table 6. Resume comparing studies in the literature.
-x-: not analyzed in the study.
The use of electric ield threshold of 0.9 kV/m together
with the area with a 10 km radius, suggested by previous analyses, leads to a FAR value of 41%, smaller than the ones obtained by Aranguren et al. (2009) (87.0% - Catalonia region, Spain) and Murphy et al. (2008) (74.1% - Florida, USA) in the previously mentioned studies (Table 6). Although the previous analyses have pointed the threshold of 0.9 kV/m like the more interesting to use, for the purpose of comparing it with previous studies, Table 6 shows the values related to the threshold of 1.0 kV/m.
With regards to the information in Table 6, it is important to note that:
• Beasley (2008) used data concerning only the
lightning that effectively occurred inside the AOC to
analyze the warning system eficiency;
• Murphy and Naccarato (2008) did not analyze in their
studies the LT;
• Naccarato (2008) did not relate the DT – the warning duration time interval – and used the threshold of
To this electric field threshold, the choice of distance range of 10 km is justified by the fact that, from a security standpoint, it is preferable to have a greater number of FA and less FTW, than otherwise.
Values found for the POD (58%) and for the FAR (41%), using the electric field threshold of 1.0 kV/m and area with a radius of 10 km are significantly better than the ones found by Aranguren et al. (2009) in Catalonia. However, they show worse performance than that found by Naccarato et al. (2008) in the same region of this study. It is important to note that, like this paper, both studies used data from only one sensor. Nevertheless, Naccarato et al. (2008) adopted the threshold of 0.5 kV/m to trigger a warning, which
resulted in high values of POD as a consequence of a large number of EA and a small number of FTW.
The values of POD found by Murphy et al. (2008) and Aranguren et al. (2009) (34.4 and 37.5%, respectively) are smaller than those found herein probably due to the fact that they are using a small DT, which tends
to decrease the number of EA diminishing as a consequence the POD. Besides that, it is important to
note that, as mentioned in the Introduction, the electric
field sensor’s measurements are strongly influenced by
the local characteristics of the installation site (cloud center charge height in that region, topography, etc.). Therefore, measurements from sensors installed at sea
level (Murphy – Florida) can result in a smaller POD as a consequence of a bigger distance to the center
charge of the cloud than the one carried out in higher
places (Aranguren – Terrassa, Spain – 300 m above
the sea level).
This study was carried out in a region located 800 m above the sea level. It is understood that the height of the center charge of the cloud varies with the latitude. Therefore, the effectiveness of lightning warning systems that use electric field data varies as a function
of this parameter (Florida – 24º N; Terrassa – 41º N; São José dos Campos – 23º S).
Thus, the system based on only one sensor, assuming an area with a radius of 10 km around it and an electric field threshold of 0.9 kV/m to trigger the warning,
showed a very interesting performance (POD=60% and FAR=41%) compared to the studies found in
literature. The average time interval before the first lightning occurrence (LT) found in this study (13 minutes) is higher than that found in the mentioned studies. Other methodologies and additional criteria can be used to increase POD and to decrease the FAR. The use of an electric field-mill network is a choice and another one is based on the use of simultaneous
data from both lightning detection and location network combined with electric field measurements and meteorological radar.
rEFErEncES
Aranguren, D., et al., 2009, “On the lightning hazard
warning using electrostatic ield: Analysis of summer thunderstorms in Spain”. Atmospheric Research.
doi:10,1016/j.elstat.2009.01.023.
Beasley, W.H., Williams, D.E., Hyland, P.T., 2008, “Analysis of surface electric-ield contours in relation to cloud-to-ground lightning lashes in air-mass thunderstorms at the Kennedy Space Center”. 20th
International Lightning Detection Conference (ILDC). Proceedings. Tucson.
Holle, R.L., Murphy, M.J., Lopez, R.E., 2003, “Distances and times between cloud-to-ground lashes in a storm”.
International Conference on Lightning and Static
Electricity (ICLSE). Proceedings. Blackpool.
Lengyel, M.M., 2004, “Lightning casualties and their
proximity to surrounding cloud-to-ground lightning”,
M.S. Thesis. University of Oklahoma.
Montanya. J., et al., 2008, “Total lightning, electrostatic field and meteorological radar applied
to lightning hazard warning”. 20th International
Lightning Detection Conference (ILDC). Proceedings. Tucson, CD-ROM.
Murphy, M.J., 1996, “The electriication of Florida thunderstorms”. PhD thesis, University of Arizona.
Murphy, M.J., Cummins, K.L., 2000, “Early detection
and warning of cloud-to-ground lightning at a point of
interest”. 2nd Symposium on Environmental Applications.
Proceedings. American Meteorological Society, Long Beach, p. 172-177.
Murphy, M.J., Demetriades, N.W.S., Cummins,
K.L., 2002, “Probabilistic early warning of
cloud-to-ground lightning at an airport. 16th Conference on
Probability and Statistics in the Atmospheric Sciences”.
Proceedings. American Meteorological Society, Orlando, p. 126-131.
Murphy, M.J., Holle, R.L., 2006, “Warnings of
cloud-to-ground lightning hazard based on combinations of lightning detection and radar information”. 19th
Murphy, M.J., Holle, R.L., 2005, “A warning method for the risk of cloud-to-ground lightning based on total
lightning and radar information”. International Conference on Lightning and Static Electricity (ICLSE). Proceedings.
The Boeing Co., Seattle.
Murphy, M.J., Holle, R.L., Demetriades, N.W.S., 2008, “Cloud-to-ground lightning warnings using
electric ield mill and lightning observations”. 20th
International Lightning Detection Conference (ILDC). Proceedings. Tucson.
Naccarato, K.P., Pinto Jr., O., Ferreira Jr., H.H., 2008,
“Cloud-to-ground lightning forecast based on lightning location
system information and electric ield-mill data”. International Conference on Grounding and Earthing (GROUND 2008)
& 3th International Conference on Lightning Physics and
Effects (LPE). Proceedings. Florianópolis, Brazil.
Naccarato, K.P., Pinto Jr., O., 2008, “Improvements in the detection eficiency model for the Brazilian lightning detection network (BrasilDAT)”. Atmospheric Research.