Pages: 86-91 DOI: 10.13057/biodiv/d120205
Plant community establishment on the volcanic deposits following the 2006
nuées
ardentes
(pyroclastic flows) of Mount Merapi: Diversity and floristic variation
SUTOMO1,♥, RICHARD HOBBS2, VIKI CRAMER2
1Bali Botanic Garden, Indonesian Institute of Sciences, Candikuning, Baturiti, Tabanan, Bali 82191, Indonesia. Tel. 21273. Fax.
+62-368-22051. ♥email: [email protected]
2School of Plant Biology the University of Western Australia, 35 Stirling Hwy, Crawley, Perth 6009, Western Australia.
Manuscript received: 29 October 2010. Revision accepted: 20 January 2011.
ABSTRACT
Sutomo, Hobbs R, Cramer V (2011) Plant community establishment on the volcanic deposits following the 2006 nuées ardentes (pyroclastic flows) of Mount Merapi: diversity and floristic variation. Biodiversitas 12: 86-91. Species establishment and composition changes in a substrate with little or no biological legacy is known as primary succession, and volcanoes, erosion, landslides, floodplains and glaciers are some type of disturbances that can create this kind of environment. Mount Merapi with its Merapi-type nuées ardentes or pyroclastic flows provides excellent opportunities to study primary succession. Using chronosequence approach, plant establishment and succession was studied, and thus five areas that were affected by nuées ardentes deposits between 1994 and 2006 were chosen as study sites. Results showed that there was a rapid colonization by vascular plants in primary succession as the sites aged. Imperata cylindrica, Eupatorium riparium, Anaphalis javanica, Athyrium macrocarpum, Brachiaria paspaloides, Dichantium caricosum, Selaginella doederleinii, Eleusine indica, Cyperus flavidus, Calliandra callothyrsus and Acacia decurrens were the species mainly responsible in explaining the differences between sites. Furthermore, the species richness and diversity reach their peak 14 years after disturbance.
Key words: plant establishment, primary succession, chronosequence, Mount Merapi.
INTRODUCTION
Species establishment and composition changes in a substrate with little or no biological legacy is known as primary succession, and volcanoes, erosion, landslides, floodplains and glaciers are some type of disturbances that can create this kind of environment (Walker and del Moral 2003). Volcanic eruption still poses a significant challenge in the study of primary succession compared with other disturbances because of the absence of the remaining biological legacy following the eruption (Franklin et al. 1985). One type of volcanic disturbance is nuées ardentes or pyroclastic flows. Nuèes ardentes are hot turbulent gas and fragmented material resulting from a collapsed lava dome that rapidly moves down the volcanic slope (Daleet al. 2005b). The accumulation of this material is called a nuées ardentes deposit and it may be up to ten meters thick
(Franklin et al. 1985). Such purely mineral deposits
preserve no “memory” of previous vegetation indicated by the absence of a seed bank (Thornton 2007). Hence, colonization must occur from other undisturbed places.
Disturbance and recovery are two factors that play a significant role in the dynamics of a community and its species diversity (Connell and Slatyer 1977; Crain et al. 2008). Establishment of invasive plant is interceded by disturbance (Hobbs and Huenneke 1992). Vegetation establishment on volcanic deposits has been documented in many parts of the world such as in USA, Italy and Japan, with rates of establishment shown to vary (Aplet et al.
1998; Daleet al. 2005c; Eggler 1959; Tsuyuzaki 1991). For example, plant establishment and spread on the debris-avalanche deposit of Mount St. Helens in USA were slow during the first years after eruption (Daleet al. 2005c). In contrast, Taylor (1957) reported that six years after Mt Lamington in West Papua erupted, vegetation regeneration was very rapid, and included species such as Saccharum
spontaneum, Imperata cylindrica, Pennisetum
macrostachyum, Vitaceae and several ferns. Mt Krakatau
had at least 64 vascular plant species (dominated by grasses species such as S. spontaneum and I. cylindrica) which colonized the island 3 years after the eruption (Thornton 2007).
There are several methods to examine a succession trajectory. A commonly used method is the chronosequence approach (space for time substitution). An alternative approach is to establish permanent plots to do such research (del Moral 2007; del Moral and Wood 1993; Hobbs et al. 2007; Simbolon et al. 2003). Although there have been some criticism of the chronosequence approach (Herben 1996; Johnson and Miyanishi 2008), it is still a useful method, especially when timing and logistics are a problem (Apletet al. 1998; Myster and Malahy 2008).
The nuées ardentes deposits found in Mt Merapi are
questions were: (i) do species composition and diversity vary across deposits of different ages? (ii) Which species contribute most to the differences in composition between different aged deposits?
MATERIAL AND METHOD
Study sites
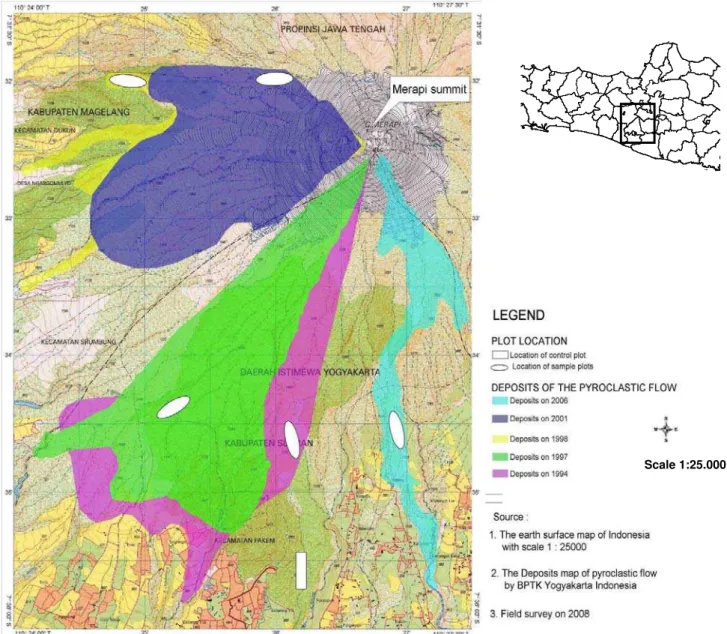
This research was conducted in June 2008 and the research sites were located in the south-west flank forests of Mount Merapi, in the zone of the Mount Merapi National Park (Central Java and Yogyakarta provinces, Indonesia). These sites are the most prone to, and most often affected by, volcanic disturbance, due to the nuées ardentes that tend to flow down the hills in this direction. We chose five areas that were affected by nuées ardentes deposits between 1994 and 2006. The five deposit sites were located in a lower montane zone (Montagnini and Jordan 2005). The summary of the study sites characteristics can be found in Table 1 and Figure 1.
Table 1. Summary of the sampling site characteristics on Mount Merapi.
Year of last
nuées ardentes
Age of deposits*
(years)
Mean altitude (m)
Mean slope (°)
2006 2 1,220 12.2
2001 7 2,002 28.26
1998 10 1,579 25.33
1997 11 1,207 6.53
1994 14 1,180 6.23
Note: * Aged of the deposits at the time of sampling
Sampling
Vegetation on the five nuées ardentes deposits was sampled in 2008. Due to the difficulty of the areas and the similarity of substrates condition on the sites, we sampled ten circular plots (with 5 m radial) in each deposit (50 plots in total), assigned at random to grid cells on a map (Daleet al. 2005a). Each plot was located in the field with reference to a compass and a handheld Global Positioning System (GPS Garmin E-Trex Legend). We measured plant
Figure 1. Sampling location on Mount Merapi National Park, Java.
abundance as density, a count of the numbers of individuals of a species within the plot (Endo et al. 2008; Kent and Coker 1992). Local plant name and Latin name, when known, was noted. Whenever there was any doubt about species name, a herbarium sample was made. Drying and sample identification were done in Dendrology Laboratory, Faculty of Forestry, Universitas Gadjah Mada. Vascular plant nomenclature is based on Backer and Bakhuizen van den Brink (1963). Although homogeneity of the sites was taken into account when choosing sample sites, differences in site conditions were likely to occur. Hence, for each circular plot, site characteristics (altitude and slope) were measured. Altitude was measured using GPS and cross checked with 1:25,000 topographic maps. A clinometer
(SuuntoPM-5clinometer) was used to determine the slope
(in degrees) (Le Brocque 1995).
Data analysis
Species diversity
The Shannon-Wiener Index of Diversity (H') is the index of diversity that is more broadly used by ecologists because it integrates species richness and evenness, and is not influenced by sample size (Isango 2007; Ludwig and Reynolds 1988; Magurran 1988). Shannon-Wiener species diversity on each deposit was then calculated. Changes in these values across the deposits were tested for significance using one-way ANOVA and Tukey’s HSD test using SPSS package V.11.5.
Floristic variation
We tested differences in community composition between deposits using data on species abundance per plot. The data was square root transformed (Valessini 2009) prior constructing resemblance matrix based on Bray-Curtis similarity. Non metric Multi Dimensional Scaling (NMDS) ordination diagram was then generated based on the resemblance matrix. This ordination method is best to apply when we want to test the a priori that there is differences in terms of species composition in each deposits by calculating Bray-Curtis Similarity Index and visually ordinate them in a 2-d space (Clarke 1993). Variation in community composition between deposits was subsequently tested for significance using one-way ANOSIM (analysis of similarity). A zero (0) indicates that there is no difference among groups, while one (1) indicates that all samples within groups are more similar to one another than any samples from different groups (Clarke 1993). The SIMPER analysis was then used to explore the relative contribution of individual species to dissimilarity among deposits. All of these analyses were conducted using PRIMER V.6 (Clarke and Gorley 2005)
RESULTS AND DISCUSSION
Species richness and diversity of the deposits
In the first decade of primary succession, plant re-colonization on Mount Merapi nuées ardentes deposits was rapid, with fifty six species belonging to 26 families recorded. The highest number of species belonged to the
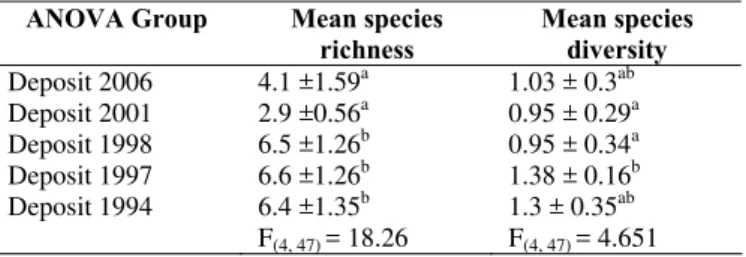
Asteraceae, then Poaceae, followed by Fabaceae and Rubiaceae. The number of species present varied as the deposit aged, with a rising trend of species richness and diversity over time (Table 2). Significant differences in species richness were found (ANOVA, P < 0.05, Table 2), with the two youngest deposits having lower richness than the three oldest deposits. Species richness decreased with time at first, and then increased to become more or less stable after more than 10 years. However, species diversity in the youngest and oldest deposits was not significantly different. This phenomenon might be due to the loss of pioneer species in the oldest deposit. In the youngest deposit the site was still relatively poor of tolerant species and as time goes, pioneer species abundantly invade the sites. As the site aged in the oldest deposit, these abundant of pioneer species were started to die out and replaced by subsequent more tolerant species.
Table 2. Differences in species richness and diversity between groups of nuées ardentes deposit. Superscript letters (a-b) after mean values (±SD) indicates significant different assessed with Tukey’s HSD test.
ANOVA Group Mean species richness
Mean species diversity Deposit 2006 4.1 ±1.59a 1.03 ± 0.3ab Deposit 2001 2.9 ±0.56a 0.95 ± 0.29a Deposit 1998 6.5 ±1.26b 0.95 ± 0.34a Deposit 1997 6.6 ±1.26b 1.38 ± 0.16b Deposit 1994 6.4 ±1.35b 1.3 ± 0.35ab
F(4, 47) = 18.26 F(4, 47) = 4.651
The decline in species richness from the 2006 deposit to 2001 contradicts the expectation that species richness would increase over early successional time. Beside time since disturbance, species composition in each of the deposits would also be influenced by site attributes or characteristics. Located at the highest altitude (± 2000 m asl.) compared with the other deposits, vegetation in the 2001 deposit would likely be influenced by the natural zonation and microclimate (van Steenis 1972; Whitten et al. 1996). Vegetation in high altitude are usually comprises of dwarf plants and because of the more hostile environment (i.e. winds intensity, lower temperature and steep slopes), less variability in the species composition is observed (van Steenis 1972; Whitten et al. 1996). High altitude and also steep slope has shaped the characteristic of the vegetation. Imperata cylindrica appear, but in much less abundance than any other species such as Anaphalis
javanica and Eupatorium riparium. According to Heyne
Floristic variation among deposit ages
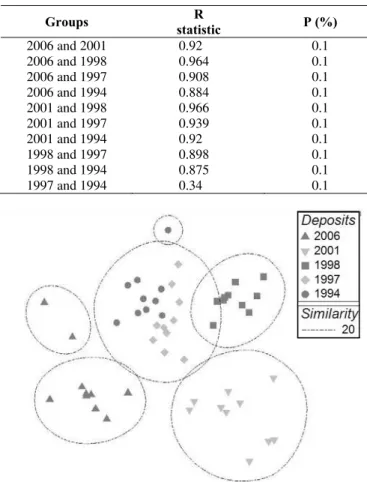
Non metric Multi Dimensional Scaling (NMDS) ordination analysis confirmed the a priori that there were differences between plots with a clear separation between younger and older deposits, except for deposit of 1997 and 1994, which were grouped together and some plots of the 1998 deposit that were in the same group cluster with the 1997 and 1994 deposits (Table 3, Figure 3). This indicated the similar floristic composition in these deposits. Two plots from the 2006 deposit fell into their own group. These two plots have more similarity to each other compared with the rest of the plots from the 2006 deposit. By checking the raw data in each plot we found that Polygala paniculata was the species that responsible for this result by occurring only in the two grouping plots. For one plot grouping in the 1994 deposit, Stachytarpheta jamaicensis was found to be the differentiating species. The global test of analysis of similarity showed a significance level of P = 0.1% and a global R-value of 0.861, which indicated that there were significant differences in Bray-Curtis species similarities between deposits on Mount Merapi. ANOSIM also showed that differences between 1997 and 1994 were not statistically significant, confirming the NMDS ordination analysis.
Table 3. ANOSIM pairwise test of significance differences between deposits. Global test of NMDS plots ordination: Sample statistic (Global R) 0.861. Significance level of sample statistic (P = 0.1%)
Groups R
statistic P (%)
2006 and 2001 0.92 0.1 2006 and 1998 0.964 0.1 2006 and 1997 0.908 0.1 2006 and 1994 0.884 0.1 2001 and 1998 0.966 0.1 2001 and 1997 0.939 0.1 2001 and 1994 0.92 0.1 1998 and 1997 0.898 0.1 1998 and 1994 0.875 0.1 1997 and 1994 0.34 0.1
Figure 3. Two dimensional plot ordinations derived from NMDS for species abundance and composition. Symbols correspond to the year of eruption. Plots at greater distances were more dissimilar in composition. Ellipses indicate groups resulting from cluster analysis. A low stress value (0.14) indicates good representation of data.
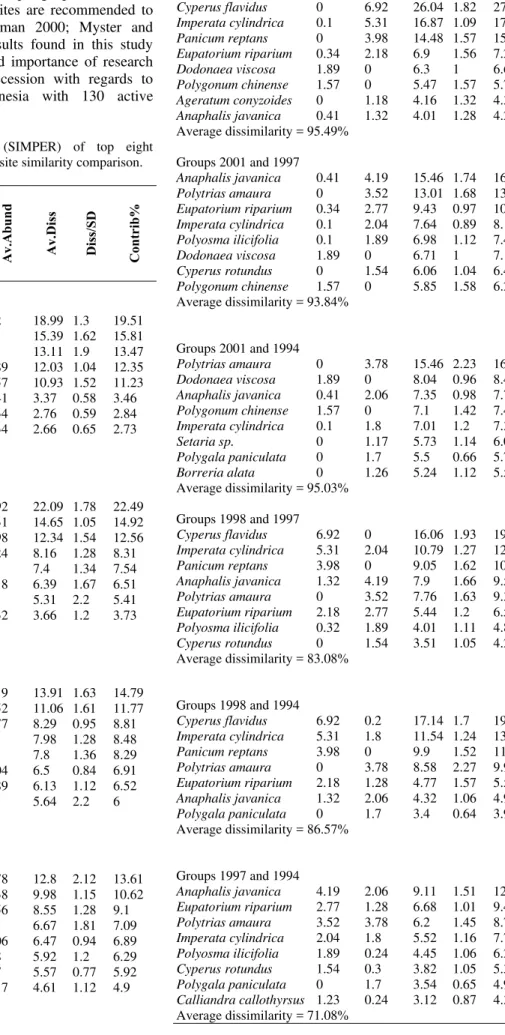
The top eight species that contributed most to the dissimilarity among deposits was determined using SIMPER analysis (Table 4). In general, comparisons between deposits showed dissimilarity of more than 90%, except for the comparisons of the 1997-1998, 1994-1998 and 1994-1997 deposits, which had average dissimilarity values of 83.08, 86.57 and 71.08 %, respectively. Results also showed that species that had the highest contribution percentage (i.e. the most contributed species in differentiating between deposits) were not always the most consistent in their contribution to the dissimilarity (which indicates by the ratio of average dissimilarity with the standard deviation) (Table 4).
In the 2001-2006 deposits, Athyrium macrocarpum was the most differentiating species but appears less
consistently compared with Paspalum conjugatum.
Similarly, Cyperus flavidus was the most differentiating
species between groups 1994-1998 but Polytrias amaura
was the most consistent one. Some species, such as A.
macrocarpum and E. riparium, were present in all five
deposits. A. macrocarpum fluctuated in abundance. It was abundant at first in the youngest deposit then decreased sharply in the 2001 deposit. It then increased in the older deposits, only to decrease again in the oldest deposit. E.
riparium abundance was lowest at the youngest deposit
where it was started to increase throughout older deposit and then decreased in the oldest deposit. Different species have their peak abundance at different times during these early stages of succession. A. macrocarpum was paramount in the earliest stage (i.e. 2006 deposit), I. cylindrica reached its peak in the more or less middle stages of the
successional time range (deposit 1998) whereas E.
riparium, Calliandra callothyrsus and Polyosma ilicifolia peaked at the intermediate stage (1997 deposit). All species abundance decreased in the oldest deposit.
Establishment of plant from seeds on volcanic deposits depends on a range of factors. Plant establishment in Mount St. Helens USA was influenced by factors such as distance from seed sources, species-specific dispersal capabilities, germination and growth characteristics of colonizing species and the substrate condition (Dale et al. 2005a; Dale et al. 2005c). Plant establishment in primary succession is also largely influenced by the development of the sites physical environment. Generally, nitrogen and phosphates are the most limiting essential macro nutrient in new volcanic soil materials (del Moral 2007). By means of physical weathering of the materials in the new substrates through time, phosphorus will become available for plants
(Walker and Syers 1976). For nitrogen, N2 fixing
organisms such as those form Leguminoceae made this nutrients available for the subsequent plant species in the succession (Bellingham et al. 2001; Walker et al. 2003). Furthermore, the role of organic matters is also prominent in the water and nutrients retention to support the growth of the occurring species (Hodkinsonet al. 2002).
establishment of permanent sampling plots and or resampling the chronosequence sites are recommended to do such study (Foster and Tilman 2000; Myster and Malahy 2008). However, the results found in this study highlight the continuing need and importance of research on community dynamics in succession with regards to volcanic disturbances in Indonesia with 130 active volcanoes lies on its region.
Table 4. Similarity percentages (SIMPER) of top eight differentiating species among deposit site similarity comparison.
Av.
A
bun
d
Av.
A
bun
d
Av.
D
iss
Diss/SD
Contr
ib%
Groups 2001 and 2006
Athyrium macrocarpum 2.69 0.2 18.99 1.3 19.51 Paspalum conjugatum 2.75 0 15.39 1.62 15.81
Pinus merkusii 1.67 0 13.11 1.9 13.47
Dodonaea viscosa 0 1.89 12.03 1.04 12.35 Polygonum chinense 0 1.57 10.93 1.52 11.23 Anaphalis javanica 0 0.41 3.37 0.58 3.46 Saprosma arboreum 0 0.34 2.76 0.59 2.84 Eupatorium riparium 0.1 0.34 2.66 0.65 2.73 Average dissimilarity = 97.35%
Groups 1998 and 2006
Cyperus flavidus 0 6.92 22.09 1.78 22.49 Imperata cylindrica 0 5.31 14.65 1.05 14.92
Panicum reptans 0 3.98 12.34 1.54 12.56
Athyrium macrocarpum 2.69 0.24 8.16 1.28 8.31 Paspalum conjugatum 2.75 0 7.4 1.34 7.54 Eupatorium riparium 0.1 2.18 6.39 1.67 6.51
Pinus merkusii 1.67 0 5.31 2.2 5.41
Anaphalis javanica 0 1.32 3.66 1.2 3.73 Average dissimilarity = 98.21%
Groups 1997 and 2006
Anaphalis javanica 0 4.19 13.91 1.63 14.79 Polytrias amaura 0 3.52 11.06 1.61 11.77 Eupatorium riparium 0.1 2.77 8.29 0.95 8.81 Athyrium macrocarpum 2.69 1.1 7.98 1.28 8.48 Paspalum conjugatum 2.75 0 7.8 1.36 8.29 Imperata cylindrica 0 2.04 6.5 0.84 6.91 Polyosma ilicifolia 0 1.89 6.13 1.12 6.52
Pinus merkusii 1.67 0 5.64 2.2 6
Average dissimilarity = 94.05%
Groups 1994 and 2006
Polytrias amaura 0 3.78 12.8 2.12 13.61
Athyrium macrocarpum 2.69 0.38 9.98 1.15 10.62 Paspalum conjugatum 2.75 0.56 8.55 1.28 9.1
Pinus merkusii 1.67 0 6.67 1.81 7.09
Anaphalis javanica 0 2.06 6.47 0.94 6.89 Imperata cylindrica 0 1.8 5.92 1.2 6.29 Polygala paniculata 0.65 1.7 5.57 0.77 5.92
Setaria sp. 0 1.17 4.61 1.12 4.9
Average dissimilarity = 94.00%
Groups 2001 and 1998
Cyperus flavidus 0 6.92 26.04 1.82 27.27 Imperata cylindrica 0.1 5.31 16.87 1.09 17.66
Panicum reptans 0 3.98 14.48 1.57 15.16
Eupatorium riparium 0.34 2.18 6.9 1.56 7.23
Dodonaea viscosa 1.89 0 6.3 1 6.6
Polygonum chinense 1.57 0 5.47 1.57 5.73 Ageratum conyzoides 0 1.18 4.16 1.32 4.36 Anaphalis javanica 0.41 1.32 4.01 1.28 4.2 Average dissimilarity = 95.49%
Groups 2001 and 1997
Anaphalis javanica 0.41 4.19 15.46 1.74 16.48 Polytrias amaura 0 3.52 13.01 1.68 13.86 Eupatorium riparium 0.34 2.77 9.43 0.97 10.05 Imperata cylindrica 0.1 2.04 7.64 0.89 8.14 Polyosma ilicifolia 0.1 1.89 6.98 1.12 7.44
Dodonaea viscosa 1.89 0 6.71 1 7.15
Cyperus rotundus 0 1.54 6.06 1.04 6.46
Polygonum chinense 1.57 0 5.85 1.58 6.23 Average dissimilarity = 93.84%
Groups 2001 and 1994
Polytrias amaura 0 3.78 15.46 2.23 16.26 Dodonaea viscosa 1.89 0 8.04 0.96 8.46 Anaphalis javanica 0.41 2.06 7.35 0.98 7.73 Polygonum chinense 1.57 0 7.1 1.42 7.47 Imperata cylindrica 0.1 1.8 7.01 1.2 7.38
Setaria sp. 0 1.17 5.73 1.14 6.03
Polygala paniculata 0 1.7 5.5 0.66 5.79
Borreria alata 0 1.26 5.24 1.12 5.52
Average dissimilarity = 95.03%
Groups 1998 and 1997
Cyperus flavidus 6.92 0 16.06 1.93 19.33 Imperata cylindrica 5.31 2.04 10.79 1.27 12.99 Panicum reptans 3.98 0 9.05 1.62 10.89 Anaphalis javanica 1.32 4.19 7.9 1.66 9.51
Polytrias amaura 0 3.52 7.76 1.63 9.34
Eupatorium riparium 2.18 2.77 5.44 1.2 6.55 Polyosma ilicifolia 0.32 1.89 4.01 1.11 4.83
Cyperus rotundus 0 1.54 3.51 1.05 4.23
Average dissimilarity = 83.08%
Groups 1998 and 1994
Cyperus flavidus 6.92 0.2 17.14 1.7 19.8 Imperata cylindrica 5.31 1.8 11.54 1.24 13.33
Panicum reptans 3.98 0 9.9 1.52 11.44
Polytrias amaura 0 3.78 8.58 2.27 9.91
Eupatorium riparium 2.18 1.28 4.77 1.57 5.51 Anaphalis javanica 1.32 2.06 4.32 1.06 4.99 Polygala paniculata 0 1.7 3.4 0.64 3.93 Average dissimilarity = 86.57%
Groups 1997 and 1994
CONCLUSION
The observation of plant establishment pattern in primary succession on Mount Merapi revealed that there was a rapid colonization by vascular plants on the nuées
ardentes deposits with fifty six species belonging to 26
families recorded. Species diversity was also increased significantly with time since nuées ardentes. Species
abundance and composition in Mount Merapi nuées
ardentes deposits were significantly different between the younger and the older sites. Younger deposits in Mount
Merapi were dominated by species such as Athyrium
macrocarpum, Polygonum chinense, Paspalum conjugatum
and Cyperus flavidus whereas the older deposits were
dominated by species such as Anaphalis javanica, Imperata cylindrica, Polytrias amaura and Eupatorium riparium.
ACKNOWLEDGEMENTS
This research was part of a master’s project funded by the AusAid. We would like to thanks to Soewarno HB from the Faculty of Forestry, Gadjah Mada University Yogyakarta, Professor Franck Lavigne, from the Universite´ Blaise Pascal, France, Tri Prasetyo, the head of the Mount Merapi National Park (TNGM) for permission to enter the national park and conduct the field data
collections, and to Mbah Maridjan, the caretaker and
gatekeeper of the Merapi Mountain, and lots of other kind helps that could not be mention here.
REFERENCES
Aplet GH, Hughes RF, Vitousek PM (1998) Ecosystem development on Hawaiian lava flows: biomass and species composition. J Veg Sci 9: 17-26.
Backer CA, Bakhuizen van den Brink RC (1963) Flora of Java. Vol. 1. The Rijksherbarium, Leiden.
Bellingham PJ, Walker LR, Wardle DA (2001) Differential facilitation by a nitrogen-fixing shrub during primary succession influences relative performance of canopy tree species. J Ecol 89: 861-75.
Clarke KR (1993) Non-parametric multivariate analyses of changes in community structure. Aust J Ecol 18: 117-143.
Clarke KR, Gorley RN (2005) PRIMER: Plymouth Routines In Multivariate Ecological Research. PRIMER-E Ltd., Plymouth. Connell JH, Slatyer RO (1977) Mechanisms of succession in natural
communities and their role in community stability and organization. Amer Nat 111: 1119-1144.
Crain CM, Albertson LK, Bertness MD (2008) Secondary succession dynamics in estuarine marshes across landscape-scale salinity gradients. Ecology 89: 2889-2899.
Dale VH, Swanson FJ, Crisafulli CM (2005a) Disturbance, survival, and succession: understanding ecological responses to the 1980 eruption of Mount St. Helens. In: Dale VH, Swanson FJ, Crisafulli CM (eds) Ecological responses to the 1980 eruption of Mount St. Helens. Springer. New York.
Dale VH, Acevedo JD, MacMahon J (2005b) Effects of modern volcanic eruptions on vegetation. In: Marti J, Ernst G (eds) Volcanoes and the environment. Cambridge University Press. New York.
Dale VH, Campbell DR, Adams WM, Crisafulli CM, Dains VI, Frenzen PM, Holland RF (2005c) Plant succession on the Mount St. Helens Debris-Avalanche deposit. In: Dale VH, Swanson FJ, Crisafulli CM (eds) Ecological responses to the 1980 eruption of Mount St. Helens. Springer. New York.
de Jong Boers B (1995) Mount Tambora in 1815: A volcanic eruption in Indonesia and its aftermath. Indonesia 60: 36-60.
del Moral R (2007) Limits to convergence of vegetation during early primary succession. J Veg Sci 18: 479-88.
del Moral R, Wood DM (1993) Early primary succession on the volcano Mount St. Helens. J Veg Sci 4: 223-234.
Eggler WA (1959) Manner of invasion of volcanic deposits by plants, with further evidence from Parricutin and Jorullo. Ecol Monographs 29: 267-284.
Endo M, Yamamura Y, Tanaka A, Nakano T, Yasuda T (2008) Nurse-plant effects of a dwarf shrub on the establishment of tree seedlings in a volcanic desert on Mt, Fuji, central Japan. Arctic Antarctic Alp Res 40: 335-342.
Foster BL, Tilman D (2000) Dynamic and static views of succession: Testing the descriptive power of the chronosequence approach. Plant Ecol 146: 1-10.
Franklin JF, MacMahon JA, Swanson FJ, Sedell JR (1985) Ecosystem responses to catastrophic disturbances: Lesson from Mount St. Helens. Nat Geog Res 1: 198-216.
Herben T (1996) Permanent plots as tools for plant community ecology. J Veg Sci 7: 195-202.
Heyne K (1987) Useful plants of Indonesia. Yayasan Sarana Wana Jaya. Jakarta. [Indonesia]
Hobbs RJ, Huenneke LF (1992) Disturbance, diversity and invasion: Implication for conservation. Conserv Biol 6: 324-336.
Hobbs RJ, Yates S, Mooney HA (2007) Long-term data reveal complex dynamics in grassland in relation to climate and disturbance. Ecol Monographs 75: 545-568.
Hodkinson ID, Webb NR, Coulson SJ (2002) Primary community assembly on land - the missing stages: why are the heterotrophic organisms always there first? J Ecol 90: 569-577.
Isango JA (2007) Stand structure and tree species composition of Tanzania Miombo Woodlands: A case study from Miombo Woodlands of Community Based Forest Management in Iringa District. In: Management of indigenous tree species for ecosystem restoration and wood production in semi-arid Miombo Woodlands in Eastern Africa. MITMIOMBO. Tanzania.
Johnson EA, Miyanishi K (2008) Testing the assumptions of chronosequence in succession. Ecol Lett 11: 419-431.
Kent M, Coker P (1992) Vegetation description and analysis, a practical approach. John Wiley and Sons. New York.
Le Brocque AF (1995) Vegetation and environmental patterns on soils derived from Hawkesbury Sandstone Narrabeen substrata in Ku-ring-gai Chase National Park, New South Wales. Aust J Ecol 20: 229-238. Ludwig JA, Reynolds JH (1988) Statistical ecology: A primer on methods
and computing. John Wiley and Sons. Singapore.
Magurran AE (1988) Ecological diversity and its measurement. Princeton University Press. Princeton, NJ.
Montagnini F, Jordan CF (2005) Tropical forest ecology: The basis for conservation and management. Springer. Berlin.
Myster RW, Malahy MP (2008) Is there a middle way between permanent plots and chronosequences? Canadian J For Res 38: 3133-3138. Simbolon H, Siregar M, Wakiyama S, Sukigara N, Abe Y, Shimizu H
(2003) Impacts of dry season and forest fire 1997-1998 episodes on mixed Dipterocarp Forest at Bukit Bangkirai, East Kalimantan. Berita Biologi 6: 737-747.
Taylor BW (1957) Plant succession on recent volcanoes in Papua. J Ecol 45: 233-243.
Thornton I (2007) Island colonization the origin and development of island communities. Ecological Reviews. Cambridge University Press. Cambridge.
Tsuyuzaki S (1991) Species turnover and diversity during early stages of vegetation recovery on the volcano Usu, northern Japan. J Veg Sci 2: 301-306.
Valessini F (2009) NBIO528 multivariate techniques and community ecology: Course handout. Centre for Fish and Fisheries Research Murdoch University. Perth.
van Steenis CGGJ (1972) The mountain flora of Java. E.J Brill. Leiden. Walker LR, Clarkson BD, Silvester WB, Clarkson BR (2003)
Colonization dynamics and facilitative impacts of a nitrogen-fixing shrub in primary succession. J Veg Sci 14: 277-290.
Walker RL, del Moral R (2003) Primary succession and ecosystem rehabilitation. Cambridge University Press. Cambridge.
Walker TW, Syers JK (1976) The fate of phosphorus during pedogenesis. Geoderma 15: 1-19.