Effect of sources and doses of sulfate on soybean crop
1 Liliane Oliveira Lopes2, Márcio Cleto Soares de Moura3,Sammy Sidney Rocha Matias4, Ricardo dos Santos Lopes2, Marcos Paulo Rodrigues Teixeira2
INTRODUCTION
Although the sulfur (S) uptake by plants is lower, when compared to phosphorous (P), the sulfur requirement of crops varies significantly, depending on the species and expected yield, at times exceeding that of P, as is the case of soybean, which is more demanding than maize, because of its higher protein content (Broch et al. 2011, Tiecher et al. 2013).
Soybean [Glycine max (L.) Merrill] is an
economically important species for the Brazilian agriculture. The country is one of the world’s largest
ABSTRACT
RESUMO
soybean producers, second only to the United States of America, with a production reaching 96.50 million metric tons, when compared to the 106.86 million metric tons recorded in the USA, for the 2015/2016 growing season (Conab 2016). This is the result of a variety of factors, including climate, soil, management, pests, diseases and application of fertilizers, which account for 25-36 % of the final cost. Thus, a proper management may increase yields and, consequently, production (Guareschi et al. 2008). Despite the low fertility of its soil, the Brazilian Savannah region has suitable climate conditions for
1. Manuscript received in Feb./2017 and accepted for publication in Aug./2017 (http://dx.doi.org/10.1590/1983-40632016v4745394).
2. Universidade Federal do Piauí, Bom Jesus, PI, Brasil. E-mails: [email protected], [email protected],
[email protected]. Crop demands for the macronutrient sulfur (S) are
similar or greater than those for phosphorous. However, S is often overlooked in the management of crop fertilization. This study aimed to evaluate the effect of sources and doses of S on
soybean cultivation under field conditions.A randomized block
design, with 4 replications, was used.The treatments were
arranged in a factorial scheme with one additional treatment (3 x 5 + 1), totaling 64 experimental units. Sources (elemental sulfur, single superphosphate and agricultural gypsum) and doses (20 kg ha-1, 40 kg ha-1, 60 kg ha-1, 80 kg ha-1 and
100 kg ha-1) of S were used, in addition to one control (without
fertilizer).The following parameters were assessed: plant height
at flowering, 1,000-seed weight, yield and agronomic efficiency, which were affected by the doses and sources of S; number of pods per plant, only affected by the sources of S; and number of pods with 3 seeds, with no statistical difference for any of the treatments. The highest yield recorded was 1,927 kg ha-1,at the
dose of 80 kg ha-1 of S for gypsum, and the greatest agronomic
efficiency was observed for the single superphosphate, at the dose of 20 kg ha-1 of S.
KEYWORDS:Glycine max; sulfur;grain yield.
Efeito de fontes e doses de sulfato na cultura da soja
As exigências de culturas agrícolas para o macronutriente enxofre (S) são similares ou superiores às de fósforo. Apesar disso, muitas vezes, o S não é incorporado ao manejo da adubação de culturas. Objetivou-se avaliar, em condições de campo, o efeito
de fontes e doses de S na cultura da soja.O delineamento foi em
blocos ao acaso, com 4 repetições.Os tratamentos foram dispostos
em esquema fatorial com um tratamento adicional (3 x 5 + 1),
totalizando 64 unidades experimentais.Foram utilizadas fontes
(enxofre elementar, superfosfato simples e gesso agrícola) e doses (20 kg ha-1, 40 kg ha-1, 60 kg ha-1, 80 kg ha-1 e 100 kg ha-1) de S,
mais um controle (sem fertilizante).Foram avaliados os seguintes
parâmetros: altura da planta no florescimento, massa de 1.000 grãos, produtividade e eficiência agronômica, as quais foram influenciadas pelas doses e fontes de S; número de vagens por planta, que somente foi influenciado pelas fontes; e número de vagens com 3 grãos, que não se diferenciou estatisticamente em nenhum tratamento. A maior produtividade foi de 1.927 kg ha-1, na dose 80 kg ha-1 de S
para o gesso, e a maior eficiência agronômica foi observada para o superfosfato simples, na dose de 20 kg ha-1 de S.
PALAVRAS-CHAVE: Glycine max; enxofre;produtividade
297 Effect of sources and doses of sulfate on soybean crop
soybean farming, as well as a flat terrain, which facilitates mechanization (Almeida et al. 2011, Neves et al. 2013).
The literature defines nutritional efficiency in a number of different ways, but the most common components are the nutrient uptake and nutrient use efficiency. In annual crops such as soybean, and for the low-fertility soils found in the Brazilian Savannah, the nutrient use efficiency is more important than uptake efficiency. However, both characteristics should be incorporated, in order to increase nutritional efficiency (Fageria 1998).
The application of fertilizers or isolated nutrients (source only), as opposed to compounds, may provide better returns for farmers. As such, the introduction of sulfur as an isolated nutrient for crops is a new approach for research, although recent studies have analyzed different sources and doses of S (Rheinheimer et al. 2005, Richart et al. 2006, Broch et al. 2011, Chien et al. 2011, Karimizarchi et al. 2014). Moreover, it is important to underscore that S acts directly on essential amino acids, and that its absence delays plant growth, as well as the synthesis of proteins present in seeds (Broch et al. 2011).
Although about 70 % of the global sulfur production is obtained from elemental S (Lopes et al. 2010), the major sources used directly in agriculture are single superphosphate, ammonium sulfate and gypsum (calcium sulfate) at 12 %, 24 % and 15 %, respectively. Single superphosphate is favored for
its high solubility in water, with a S-SO42- content
varying 8-12 %, making it easily available to crops, when compared to sources such as elemental S (Broch et al. 2011, Heydarnezhad et al. 2012).
Elemental S may be an option, due to its high content of S (85-99 %). An example of fertilizer on the market with this concentration is Sulfururgan, with 90 % of elemental S. However, its release is slow in the soil, with respect to other fertilizers containing S, as it needs to undergo an oxidation reaction in the soil to become available, being
transformed into SO42-. This reaction causes a small
acidification around the fertilizer particle, slightly reducing the pH of the soil, and this reduction may be effective in the dissolution of essential nutrients, causing these nutrients to be released for absorption in the rhizosphere area of the plant (Heydarnezhad et al. 2012, Karimizarchi et al. 2014).
The macronutrient sulfur (S-SO42-), present in
agricultural gypsum, has been used in fertilization
programs, but its efficiency in allowing a nutrient displacement underground promotes a nutrient availability throughout the soil profile, favoring the movement of some nutrients to deeper layers and increasing soil Ca and S levels (Pauletti et al. 2014).
In this respect, the present study aimed to assess the effect of sources and doses (broadcast application) of S on soybean cultivation, in the Brazilian Savannah.
MATERIAL AND METHODS
The experiment was conducted under field conditions, during the 2015/2016 growing season, in a farm at the Serra do Quilombo region, in Bom Jesus, Piauí state, Brazil (09º15’17”S, 44º47’72”W and altitude of 630 m). The predominant soil in the study area is a Dystrophic Yellow Latosol (Oxisol), deep and well-drained, with a flat relief (Santos et al. 2013). The monthly rainfall for the 2015/2016 growing season and the average for the region in the
last 30 years are shown in Figure 1 (Bdmet 2016).
The results of soil chemical analysis at a depth of 0-0.2 m, before the experiment, were: pH
(H2O) = 5.83; OM = 17.58 g dm-3; P (Mehlich) =
12.54 mg dm-3; K = 0.12 cmol
c dm-3; Ca = 1.5 cmolc dm-3;
Mg = 0.85 cmolc dm-3; S-SO
4
2- = 1.10 mg dm-3; Al =
0.01 cmolc dm-3; H + Al = 2.38 cmol
c dm-3; CEC = 4.85 cmolc dm-3; and V = 51 %. In terms of composition,
the soil consists of 17 %, 76 % and 7 %of clay, sand
and silt, respectively, and is classified as sandy.
Figure 1. Monthly rainfall at Fazenda Colorado, in Bom Jesus, Piauí state, Brazil, from October 2015 to May 2016, and average rainfall over the last 30 years (1986-2016).
Source: Bdmet (2016).
Months
Oct Nov Dec Jan Feb Mar Apr May
Ra
in
fa
ll
(m
m
)
0 50 100 150 200 250 300 350 400
incorporated into the soil. In the 2013/2014 growing
season, 200 kg ha-1 of potassium chloride were applied
by broadcasting at 30 days, before planting soybean,
in addition to 250 kg ha-1 of triple superphosphate
along the planting rows. In the 2014/2015 season,
350 kg ha-1 of NPK (00:12:30) fertilizer were applied
by broadcasting at 20 days before planting (DBP),
with additional 230 kg ha-1 of triple superphosphate
along the planting rows.
A randomized block design, with 4 replications, was used. The treatments were arranged in a 3 x 5 + 1 factorial scheme, evaluating the effects of two or more treatments at the same time, as well as an additional treatment (control), i.e., three sulfur treatments [elemental sulfur (90 % of S), single superphosphate (10 % of S) and gypsum (15 % of S)], five doses of S (20 kg ha-1, 40 kg ha-1, 60 kg ha-1,
80 kg ha-1 and 100 kg ha-1) and a control (without
sulfate fertilization). Each plot was divided into four quadrants, using a rope, and the fertilizer was applied by broadcasting at 30 DBP. Each plot contained six 5.0-m-long rows, and the area of each plot was obtained by disregarding two rows on each side and allowing a 1.0-m border around the edge, forming a study area of 5.4 m2 per plot.
The soybean cultivar used in the experiment was the ST 920 RR, with planting carried out in January 2016, using a seeder/fertilizer calibrated for
16 plants m-1 and spacing of 0.45 m. With respect to
fertilizer, at 40 DBP, 180 kg ha-1 of potassium chloride were distributed (broadcast application), followed
by 220 kg ha-1 of NPK (10:49:00) in the furrows
at the time of planting. At 15 days after planting (DAP), manual thinning was performed, to maintain
a population of 9 plants m-1 in the experimental area,
totaling 200,000 plants ha-1.
The crop treatments and phytosanitary management of the plots were in line with the procedures adopted for commercial soybean crops, including the pest and disease monitoring, chemical weed control and application of insecticides, fungicides and plant hormones.
Plant height at flowering was assessed at 60 days after emergence (DAE) (phenological growth stage R2), by randomly selecting 10 plants from the study area of each plot and measuring their length, in meters, from the ground to the end of the main stem.
plants exhibited mature pods. The average yield was assessed by weighing the grains harvested in the study area of the plot and extrapolating the values recorded to kg ha-1.
The number of pods per plant, number of pods with 3 seeds and 1,000-seed weight were also evaluated at harvesting. For evaluating the number of pods per plant and number of pods with 3 seeds, 10 plants were randomly selected at harvesting, in order to calculate the average for each plot.
Yield data were used to determine the agronomic efficiency, as proposed by Fageria (1998), which is an indicator of the yield (grains, in the case of annual crops) per unit of nutrient applied, in this case sulfur, calculated using the following equation: AE = (SYwf - STwof)/(ANa), where:
AE = agronomic efficiency (kg kg-1); SYwf = seed
yield (kg ha-1) with fertilizer; SYwof = seed yield
(kg ha-1) without fertilizer; ANa = amount of nutrient
applied (kg ha-1).
The data were submitted to analysis of variance and, in the event of differences between treatments on the application of the F-test, regression analysis was performed for S doses, while the sources were compared using the Skott-Knott test (p < 0.01 or p < 0.05). All the statistical calculations were carried out using the Sisvar and R softwares.
RESULTS AND DISCUSSION
The analysis of variance (Table 1) for plant height at flowering, number of pods per plant, number of pods with 3 seeds, 1,000-seed weight and yield made it possible to assess the statistically significant
effect (p≤ 0.01) of sources, doses, sources * doses
and control * factorial design, in relation to yield. The plant height at flowering showed the same significant effect in yield variables, except for the sources * doses interaction, which was not significant. The 1,000-seed
weight was significant (p ≤ 0.01) for sources and
doses, and the number of pods per plant was significant
(p≤ 0.05) for the variable source, but the number of
299 Effect of sources and doses of sulfate on soybean crop
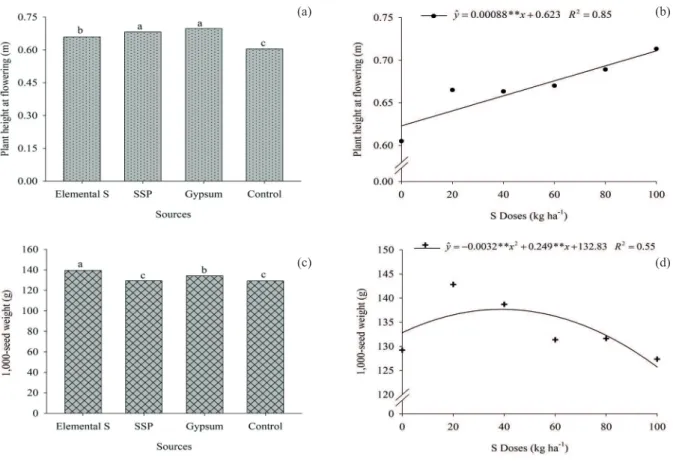
(Figure 2a). The plant height at flowering response to the doses studied is represented by the linear model, with values ranging 0.60-0.72 m (Figure 2b). The plant height at flowering values were lower for the elemental sulfur treatment than for gypsum, possibly because the elemental S present in the fertilizer used here must undergo oxidation in the soil and be converted into SO2-, in order to be available to plants, and is therefore released into the soil more slowly
than in gypsum and single superphosphate (Chien et al. 2011). However, the single superphosphate and gypsum sources contain other elements in their composition, i.e., the single superphosphate contains P and gypsum Ca, and there may also be an additive effect between S and P (Salvagiotti at al. 2017).
The variable 1,000-seed weight differed statistically, in relation to sources (Figure 2c), with the highest weights recorded for elemental sulfur
ns,* and ** Not significant and significant at p < 0.05 and p < 0.01, respectively, according to the Scott-Knott test.
Source of variation DF Yield (kg ha-1) PHF (m) Mean squaresNPP (unit) NP3S (unit) 1000SW (g)
Block 3 3,013.788ns 0.00064ns 47.990ns 0.011ns 34.547ns
Source 2 222,765.388** 0.00730** 90.738* 0.007ns 497.759**
Dose 4 45,192.335** 0.00539** 26.485ns 0.039ns 469.048**
Source * dose 8 62,312.766** 0.00069ns 34.595ns 0.009ns 84.028ns
Control * Factorial design 1 118,477.263** 0.02119** 3.725ns 0.091ns 99.807ns
Residue 45 2,993.340 0.00089 19.328 0.021 52.585
Total 63 22,016.209 0.00167 25.105 0.021 97.043
Mean 1,613.554 0.667 33.405 2.467 133.524
CV (%) 3.29 4.61 12.44 5.98 5.41
Table 1. Summary of analysis of variance results for yield, plant height at flowering (PHF), number of pods per plant (NPP), number of pods with 3 seeds (NP3S) and 1,000-seed weight (g) (1000SW), in relation to treatments and their interactions.
Figure 2. Plant height at flowering (a and b) and 1,000-seed weight (c and d), in relation to sulfur sources and doses, respectively. SSP: single superphosphate.
(a)
(c) (d)
difference for this variable in soybean crops. A significant effect (p < 0.05) on 1,000-seed weight between S doses, where the best fit to the data was the quadratic model, indicating a decline in the 1,000-seed weight with a rise in the sulfur dose and peak weight at
a maximum dose of 39 kg ha-1, is shown in Figure 2d.
A higher sulfur dose did not increase the 1,000-seed weight. Although Richart et al. (2006) reported a rise in sulfur concentration in the soil with increased sulfur doses, this did not occur in the present study, likely due to sulfur leaching, since S levels in the soil were very low, i.e., below the minimum level of sustainable nutrition for sulfur (5.0 mg dm-3).
The number of pods per plant differed according to the sources used, with single superphosphate producing higher number of pods per plant values and non-significant values for number of pods with 3 seeds (Figures 3a and 3c), contrasting with what was observed by Richart et al. (2006) and Carvalho et al. (2011), who found no difference for these variables in soybean crops. There was no statistical difference between S doses for the number of pods per plant and number
(2012), phenotypic and genetic correlations and path analysis indicated that the number of pods per plant has a more favorable effect on soybean seed yield.
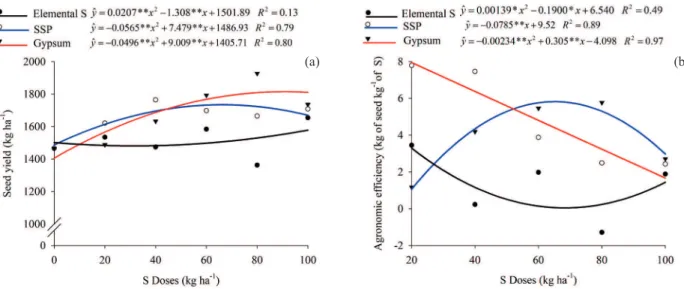
Yield was influenced by both sulfur sources and doses. Researches carried out in other regions of the country also found that different sources and doses of sulfur may affect the soybean crop yield (Broch et al. 2011, Pauletti et al. 2014).
The results observed for yield confirm that the soybean crop responded to the application of S doses and sources (Figure 4a). The equations found showed a quadratic fit to the three sources used (single superphosphate, gypsum and elemental
S), with maximum yield reached at 66.2 kg ha-1,
91.0 kg ha-1 and 31.6 kg ha-1 of S, respectively.
Seed yield varied 1,363-1,927 kg ha-1, at a dose of
80 kg ha-1 of S, for elemental S and gypsum. These
results corroborate those of Broch et al. (2011),
who used 40 kg ha-1 of S from gypsum, elemental
S and single superphosphate, and found statistically equal soybean yields, with all treatments exhibiting
an average yield above 3,100 kg ha-1. By contrast,
Figure 3.Number of pods per plant(a and b) and pods with 3 seeds (c and d), for different doses and sources of sulfur fertilizer.
SSP: single superphosphate.
(a)
(d) (c)
301 Effect of sources and doses of sulfate on soybean crop
Rampim et al. (2013) studied the effect of gypsum on available P and S levels in the Paraná state and found no significant difference for soybean yield.
The results for yield (Figure 4a) differed from those recorded by Rheinheimer et al. (2005), who
found that SO4
2- doses up to 60 kg ha-1, via single superphosphate, do not affect crop yield. The results obtained here are in accordance with those by Caires et al. (2011), Rampim et al. (2011) and Pauletti et al. (2014), who observed that the application of gypsum positively affected the soybean growth.
The yield obtained in all the treatments was above the average stipulated by the Brazilian Crop Supply Agency, for the 2015/2016 growing season (Conab 2016), where the average yield for the
Piauí state was 1,143 kg ha-1, representing a 58 %
decline, in relation to the previous season, due to adverse weather conditions in the state. In general, the average yield in the present study was below that observed in other studies in the same region of the Piauí state (Leite et al. 2015, Bohn et al. 2016). The S application using single superphosphate produced a greater agronomic efficiency (Figure 4b), particularly at a dose of 20 kg ha-1, with a 7.8 kg gain in soybean grains for every kilogram of S applied in the area. By contrast, gypsum produced higher agronomic efficiency at sulfur doses of 60-80 kg ha-1. This result can be explained by the fact that sulfate-based sulfur sources, such as gypsum, are more efficient in the initial years of cultivation, whereas the efficiency of elemental sulfur sources increases over the years (Heydarnezhad et al. 2012, Stamford et al. 2015).
The higher performance of soybean crop fertilized with single superphosphate and gypsum may also be explained by the additional nutrients (P and Ca, respectively) provided by these fertilizes.
Single superphosphate has 21 % of P2O5, while
gypsum has 32% of CaO. The addition of P and Ca by these fertilizers may explain the higher performance of soybean, in terms of yield and agronomic efficiency (Figure 4), when compared to the fertilization with elemental S (Salvagiotti et al. 2012 and 2017).
CONCLUSIONS
1. Plant height at flowering, 1,000-seed weight and yield are influenced by doses and sources of S, whereas the number of pods per plant is only affected by the source, and the number of pods with 3 seeds shows no statistical difference; 2. The additive effect of P and Ca present in the
single superphosphate and gypsum, respectively, may have increased yield, relatively to elemental sulfur;
3. The highest agronomic efficiency is recorded for
single superphosphate at a dose of 40 kg ha-1 of S.
ACKNOWLEDGMENTS
The authors are grateful to the Coordenação de Aperfeiçoamento de Pessoal de Nível Superior (Capes), for the grants awarded, and to Nerison Pedro Bohn, for his contributions on the farm.
Figure 4.Soybean yield (a) and agronomic efficiency (b) for different doses of sulfur. SSP: single superphosphate.
ALMEIDA, R. D. et al. Divergência genética entre cultivares de soja, sob condições de várzea irrigada, no sul do Estado do Tocantins. Revista Ciência Agronômica, v. 42, n. 1, p. 108-115, 2011.
BANCO DE DADOS METEOROLÓGICOS PARA ENSINO E PESQUISA (Bdmet). Série histórica. Dados mensais. Bom Jesus (PI). 2016. Brasília, DF: Instituto Nacional de Meteorologia, 2016.
BOHN, N. P. et al. Identificação de cultivares de soja para a região sudoeste do Cerrado piauiense. Revista Agro@mbiente On-line, v. 10, n. 1, p. 10-16, 2016. BROCH, D. L. et al. Produtividade da soja no Cerrado influenciada pelas fontes de enxofre. Revista Ciência Agronômica, v. 42, n. 3, p. 791-796, 2011.
CAIRES, E. F. et al. Surface application of gypsum in low acidic Oxisol under no-till cropping system. Scientia Agricola, v. 68, n. 2, p. 209-216, 2011.
CARVALHO, E. R. et al. Fertilizante mineral e resíduo orgânico sobre características agronômicas da soja e nutrientes no solo. Revista Ciência Agronômica, v. 42, n. 4, p. 930-939, 2011.
CHIEN, S. H. et al. Comparison of ammonium sulfate with other nitrogen and sulfur fertilizers in increasing crop production and minimizing environmental impact: a review. Soil Science, v. 176, n. 7, p. 327-335, 2011. COMPANHIA NACIONAL DE ABASTECIMENTO (Conab). Acompanhamento da safra brasileira: grãos: safra 2016/2017. 2 º levantamento. Brasília, DF: Conab, 2016.
FAGERIA, N. K. Otimização da eficiência nutricional na produção das culturas. Revista Brasileira de Engenharia Agrícola e Ambiental, v. 2, n. 1, p. 6-16, 1998.
GUARESCHI, R. F. et al. Adubação fosfatada e potássica na semeadura e a lanço antecipada na cultura da soja cultivada em solo de Cerrado. Semina: Ciências Agrárias, v. 29, n. 4, p. 769-774, 2008.
HEYDARNEZHAD, F. et al. Influence of elemental sulfur and sulfur oxidizing bacteria on some nutrient deficiency in calcareous soils. International Journal of Agriculture and Crop Science, v. 12, n. 4, p. 735-739, 2012.
KARIMIZARCHI, M. et al. Elemental sulphur application and sweet maize (Zea mays L.) response in a high pH soil of Malaysia. Malaysian Journal of Soil Science, v. 18, n. 1, p. 75-86, 2014.
LEITE, W. S. et al. Estimativas de parâmetros genéticos e correlações entre caracteres agronômicos em genótipos de soja. Nativa, v. 3, n. 4, p. 241-245, 2015.
V.; STIPP, S. R. Boas práticas para uso eficiente de
fertilizantes: nutrientes. Piracicaba: IPNI-Brasil, 2010. p. 283-305.
NEVES, J. A. et al. Agronomic performance of soybean genotypes in low latitude in Teresina - PI, Brazil. Journal of Agricultural Science, v. 5, n. 3, p. 243-253, 2013. NOGUEIRA, A. P. O. et al. Análise de trilha e correlações entre caracteres em soja cultivada em duas épocas de semeadura. Bioscience Journal,v. 28, n. 6, p. 877-888, 2012.
PAULETTI, V. et al. Efeitos em longo prazo da aplicação de gesso e calcário no sistema de plantio direto. Revista Brasileira de Ciência do Solo, v. 38, n. 2, p. 495-505, 2014. RAMPIM, L. et al. Fósforo e enxofre disponível, alumínio trocável e fósforo remanescente em Latossolo Vermelho submetido ao gesso cultivado com trigo e soja. Semina: Ciências Agrárias, v. 34, n. 4, p. 1623-1638, 2013. RAMPIM, L. et al. Atributos químicos de solo e resposta do trigo e da soja ao gesso em sistema semeadura direta. Revista Brasileira de Ciência do Solo, v. 35, n. 5, p. 1687-1698, 2011.
RHEINHEIMER, D. S. et al. Resposta de culturas à aplicação de enxofre e a teores de sulfato num solo de textura arenosa sob plantio direto. Ciência Rural, v.35, n. 3, p. 562-569, 2005.
RICHART, A. et al. Disponibilidade de fósforo e enxofre para a cultura da soja na presença de fosfato natural reativo, superfosfato triplo e enxofre elementar. Revista Brasileira de Ciência do Solo, v. 30, n. 4, p. 695-705, 2006. SALVAGIOTTI, F. et al. Identifying sulfur deficient fields by using sulfur content; N:S ratio and nutrient stoichiometric relationships in soybean seeds. Field Crops Research, v. 135, n. 1, p. 107-115, 2012.
SALVAGIOTTI, F. et al. N:P:S stoichiometry in grains and physiological attributes associated with grain yield in maize as affected by phosphorus and sulfur nutrition. Field Crops Research, v. 203, n. 1, p. 128-138, 2017.
SANTOS, H. G. dos. et al. Sistema brasileiro de
classificação de solos. Brasília, DF: Embrapa, 2013.
STAMFORD, N. P. et al. Effect of gypsum and sulfur with Acidithiobacillus on soil salinity alleviation and on cowpea biomass and nutrient status as affected by PK rock biofertilizer. Scientia Horticulturae, v. 192, n. 1, p. 287-292, 2015.