*
Abstract
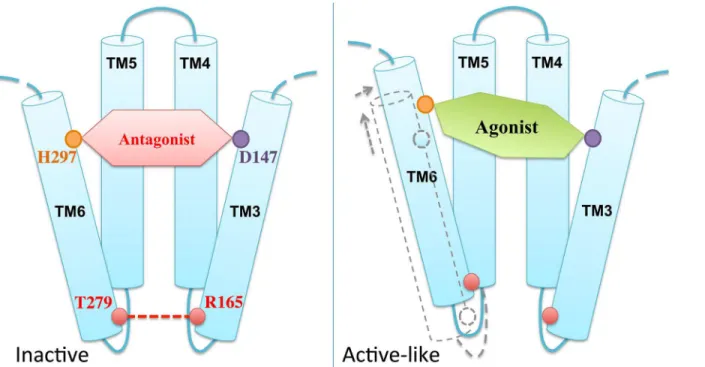
Atomistic descriptions of theμ-opioid receptor (μOR) noncovalently binding with two of its prototypical morphinan agonists, morphine (MOP) and hydromorphone (HMP), are investi-gated using molecular dynamics (MD) simulations. Subtle differences between the binding modes and hydration properties of MOP and HMP emerge from the calculations. Alchemi-cal free energy perturbation Alchemi-calculations show qualitative agreement within vitro experi-ments performed in this work: indeed, the binding free energy difference between MOP and HMP computed by forward and backward alchemical transformation is 1.2±1.1 and 0.8±0.8 kcal/mol, respectively, to be compared with 0.4±0.3 kcal/mol from experiment. Comparison with an MD simulation ofμOR covalently bound with the antagonistβ-funaltrexamine hints to agonist-induced conformational changes associated with an early event of the receptor’s activation: a shift of the transmembrane helix 6 relative to the transmembrane helix 3 and a consequent loss of the key R165-T279 interhelical hydrogen bond. This finding is consistent with a previous proposal suggesting that the R165-T279 hydrogen bond between these two helices indicates an inactive receptor conformation.
Introduction
Opioid drugs, such as morphine, are widely used in clinics for the treatment of acute, postoper-ative, and chronic pain. Owing to their exceptional analgesic properties, they are consistently among the most commonly prescribed drugs nowadays [1]. However, although frequently highly effective, opioids consumption in a regular basis leads to the appearance of undesirable side effects, such as constipation or respiratory depression, which limit their clinical applicabil-ity. Moreover, their usage often leads to addiction, tolerance and withdrawal [2]. This poses a major problem for the use of the existing opioids in clinics, complicating dosing regimens for patients and strongly restricting the prescription of these drugs [3,4].
OPEN ACCESS
Citation:Cong X, Campomanes P, Kless A, Schapitz I, Wagener M, Koch T, et al. (2015) Structural Determinants for the Binding of Morphinan Agonists
to theμ-Opioid Receptor. PLoS ONE 10(8):
e0135998. doi:10.1371/journal.pone.0135998
Editor:Yaakov Koby Levy, Weizmann Institute of Science, ISRAEL
Received:April 13, 2015
Accepted:July 28, 2015
Published:August 17, 2015
Copyright:© 2015 Cong et al. This is an open access article distributed under the terms of the
Creative Commons Attribution License, which permits unrestricted use, distribution, and reproduction in any medium, provided the original author and source are credited.
Data Availability Statement:All relevant data are within the paper and its Supporting Information files.
Funding:This work has been funded by the European Union Seventh Framework Programme
(FP7/2007-2013,http://ec.europa.eu/research/fp7)
Opioid compounds exert their analgesic and intense rewarding effects by acting upon opioid receptors expressed on the plasma membrane of neuronal cells. These receptors, as members of the class A seven transmembrane (TM) G-protein coupled receptors (GPCRs) superfamily, are specialized in transmitting stimuli from the extracellular environment to the cytoplasm [5]. According to their preferential interaction with endogenous opioid peptides, opioid receptors are divided in four different types: the nociceptin/orphanin FQ peptide receptor, and the classicalμ-,δ- andκ-opioid receptors [6–8]. In spite of their relatively high sequence identity [9], they present a very specific functional outcome, each receptor being responsible for distinct pharmacological effects. In particular,μ-opioid receptors (µORs) in the peripheral and central nervous system mediate pain perception. They are the primary target of exogenous analgesics such as morphine and other prototypical opioid drugs [10]. Both beneficial and adverse phar-macodynamic effects of classical morphine-like drugs are attributable to the activation ofμORs [11]. They may be separable by using biased ligands [12]. Indeed, it has been demonstrated in a large number of studies that different ligands, while acting on the same receptor, can stimulate and inhibit GPCRs signaling through several intracellular pathways differentially, not simply stimulating or inhibiting all pathways to the same extent. This phenomenon, termed functional selectivity or biased signaling [13,14], is a key concept in GPCRs signaling, in general, and through opioid receptors, in particular. These receptors can signal selectively through G-pro-tein andβ-arrestin pathways in a ligand-specific manner [12,15,16].
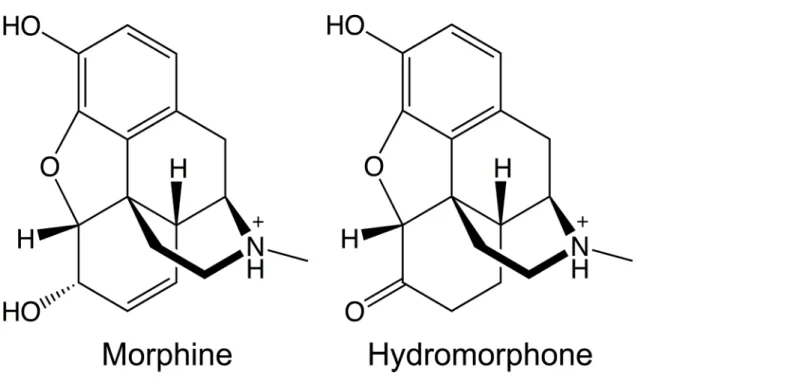
Characterizing opioid-μOR interactions may help to understand how different compounds can trigger distinct downstream responses and cause the selective activation of particular sig-naling and regulatory pathways. This knowledge can be in turn exploited to develop novel potent analgesics lacking some of the undesirable properties of current opioids by activating specificμOR signaling pathways. Within this perspective, here we investigate the binding determinants and energetics of two prototypical opioid agonists, morphine (MOP) and hydro-morphone (HMP), toμOR. The two agonists’functional activities at the receptor differ. The EC50values for cAMP (G-protein mediated responses) and forβ-arrestin2 (Table 1) point to
3~4-fold increase in the potency of HMP relative to MOP [17]. By contrast, the agonists’ struc-tural features (Fig 1) and binding affinities forμOR are very similar (Table 1). In this paper, we report structural features of the two agonists’binding modes, along with the agonist-induced conformational changes inμOR. These changes might be present in the early steps toward an active state of the receptor.
Our calculations are based on the X-ray structure of mouseμOR covalently bound withβ -funaltrexamine (β-FNA), a semisynthetic opioid antagonist derived from morphine, resolved at 2.8 Å resolution (PDB entry: 4DKL) [18]. MouseμOR shares 94% sequence identity with humanμOR. Therefore, the 3D structure of mouseμOR provides an excellent model for investigatingμOR-ligand interactions. We find that MOP and HMP bind toμOR with subtle differences that may account for their different binding affinities, which are consistent within
vitroexperiments performed here.
Table 1. EC50(nM) cAMP andβ-arrestin2 values for MOP and HMP on humanμOR [17], as well as the
binding affinities of the two agonists forμOR.
Ki(nM) EC50cAMP EC50β-arrestin2
MOP 8.0±3.6 50 501
HMP 4.0±0.8 16 126
The binding affinities are measured in this study (see“Materials and Methods”for details).
doi:10.1371/journal.pone.0135998.t001 have any additional role in the study design, decision
to publish, or preparation of the manuscript. The specific roles of these authors are articulated in the 'author contributions' section.
Materials and Methods
Computational details
Structural models of the agonists in complex withμOR. We started from the X-ray
structure of mouseμOR [18]. The structure contains a T4 lysozyme replacing the third intra-cellular loop (IL3), which is part of the putative G-protein binding epitope on class A GPCRs [19]. We constructed the missing IL3 using homology modeling by Modeller 9.9 [20]. In total 20,000μOR models were generated, from which the one with the lowest Discrete Optimized Protein Energy (DOPE) score [20] was selected. The water molecules in the X-ray structure were preserved during the homology-modeling step. The NQ-Flipper [21] and H++ [22] web-servers were used to examine the asparagine and glutamine side-chain rotamers and to predict the histidine side-chain protonation states, respectively. MOP and HMP were built and docked into the orthosteric binding site ofμOR using MOE 2012.10 [23]. The protonation state of the side-chain residues formingμOR was estimated by the Protonate3D algorithm [24]. The ter-tiary amines of the ligands were protonated as they should be at physiological pH (Fig 1) and rotatable bonds were allowed to rotate. Docking was realized using an induced fit procedure that allows taking into account the flexibility of the protein side-chains located in the binding pocket. The electrostatic solvation energy was used to score the resulting binding modes using a generalized born/volume integral method [25]. From the top-ranked 25 modes of each ligand, we selected the mode in best agreement with available experimental data (seeS1 Filefor details).
Embedding in membrane and solvation.. The DOWSER program [26] was used to detect and prefill possible hydrophilic cavities inside the MOP-μOR, HMP-μOR andβ-FNA-μOR complexes. The complexes were oriented according to the OPM (Orientations of Proteins in Membranes) database [27] and then embedded in a bilayer of 1-Palmitoyl-2-oleoyl-sn-glycero-3-phosphocholine (POPC), the most abundant phospholipid in animal cell membranes [28]. We used the‘Stockholm Lipids’parameters that have been shown to be compatible with Fig 1. Molecular structures of morphine and hydromorphone.
AMBER force fields [29], and the POPC bilayer configuration pre-equilibrated in water at 303 K [30]. The embedding was performed using the Inflategro2 program [31]. Each system was then immersed in a periodic 64×67×113 Å3box, which ensured a distance always larger than
20 Å between adjacent images of the protein during the simulation. The systems were solvated in explicit water and neutralized with 0.15 M NaCl, resulting in ca. 8,430 water molecules, 23 Na+and 37 Cl-ions. Each system consisted of ca. 42,700 atoms in total.
Molecular Dynamics simulations. Energy minimizations and MD simulations were car-ried out using Gromacs 4.6 [32]. The TIP3P water model [33], the Åqvist parameters [34], and the Amber99SB_ILDN force field [35] were used for the water molecules, the ions, and the pro-tein, respectively. As for the parameters of the ligands, we calculated their partial atomic char-ges at the DFT level with the HF/6-31Gbasis set using Gaussian 09 [36]. The obtained
electrostatic potential was fitted by the RESP program [37] in Amber11 to generate atomic point charges (provided inS2 File). The other parameters were taken from the General Amber force field (GAFF) [38] to build the topology of the ligands (S2 File). The ligand-μOR com-plexes underwent 1,000 steps of steepest-descent energy minimization with 5,000 kcalmol-1
Å-2harmonic positional restraints on the protein-ligand complex, followed by 2,500 steps of steepest-descent and 2,500 steps of conjugate-gradient minimization without restraints. Then, the systems were gradually heated to 300 K in 6 steps of 100-ps MD simulations (from 2 K to 60 K, 120 K, 180K, 240 K and 300 K). The velocities were generated consistent with a Maxwell-Boltzmann distribution at the corresponding temperature. Each system underwent 5 ns equili-bration and 0.8-μs production MD simulations in the NPT ensemble (P= 1 bar,T= 300 K) by using the Andersen-Parrinello-Rahman barostat [39,40] and the Nose-Hoover thermostat [41]. Semi-isotropic pressure coupling was applied to allow the simulation box in thez-axis (perpendicular to the lipid bilayer) to vary independently of thex-yplane. The LINCS algo-rithm [42] was employed to constrain all the bond lengths. Van der Waals and short-range electrostatic interactions were cut off at 12 Å. Long-range electrostatic interactions were com-puted using the Particle Mesh Ewald summation (PME) [43] method with a Fourier grid spac-ing of 1.2 Å. A 2-fs time step was used in the MD calculations. Usspac-ing the same procedure, 0.5-μs additional MD simulations for each system were obtained starting from different initial velocities.
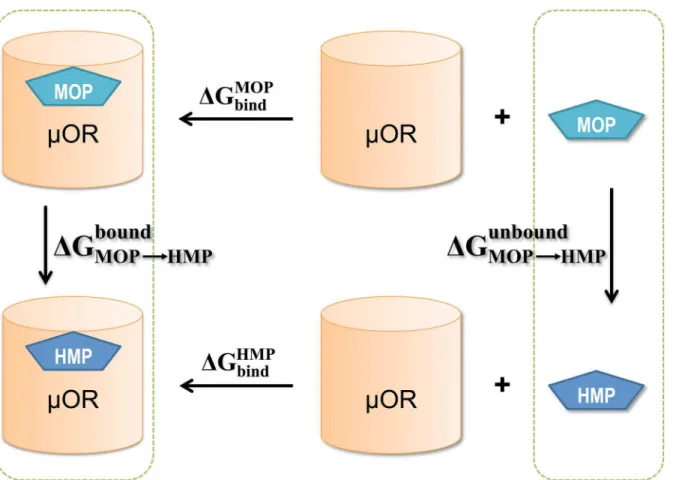
Free energy calculations. Alchemical free energy perturbation (FEP) methodologies were employed to estimate the difference in the binding free energy toμOR,ΔΔGbind, between MOP
and HMP. Using the thermodynamic cycle inFig 2,ΔΔGbindfrom MOP to HMP can be
calcu-lated as the free energy difference between two alchemical pathways: the transformation of MOP to HMP while bound toμOR, and that of MOP to HMP in solution (unbound). We per-formed alchemical transformation from MOP to HMP andvice versa.
The transformations in solution (the unbound state) started from the agonists pre-equili-brated in a periodic 50×50×50 Å3box containing ca. 4,120 water molecules and a Cl- counter-ion. The force field parameters and the simulation procedure were the same as those used above. For each agonist, 5 ns pre-equilibration MD was carried out. The transformations of the agonists bound toμOR (the bound state) were started from representative configurations obtained from a cluster analysis of the agonist-μOR trajectories using g_cluster in Gromacs tools [44] and the Gromos method [45].
The transformations from one agonist (A) to the other (B) were performed in the following steps: (i) charge annihilation by scaling the electrostatic potential energy of A, in 30 steps (Δλ=
0.025 for theλvalues from 0 to 0.25 and from 0.8 to 1, andΔλ= 0.05 for theλvalues from 0.25
to 0.8); (ii) decoupling the van der Waals interactions and transforming A into B in 25 steps (Δλ= 0.01 for theλvalues from 0 to 0.05, andΔλ= 0.05 for theλvalues from 0.05 to 1); and
sameλvalues as those in (i)). The simulations in the unbound state at eachλvalue included
5,000 steps of steepest descent energy minimization and 5,000 steps L-BFGS energy minimiza-tion, 200 ps NVT (T= 300 K) equilibration, 1 ns NPT (P= 1 bar,T= 300 K) equilibration and 10 ns NPT (P= 1 bar,T= 300 K) production run with dH/dλcollection every 10 steps. The
temperature was controlled via Langevin dynamics and the pressure, Andersen-Parrinello-Rahman barostat [39,40]. The simulations in the bound state were performed in the same manner except that the timescales in this case were: 500 ps NVT equilibration, 5 ns NPT equili-bration and 10 ns NPT production run.
The free energies of the steps involved in the transformations were calculated using the Ben-nett’s acceptance ratio method (BAR) [46] implemented in Gromacs 4.6. BAR combines the information normally used for forward and reverse free energy perturbations. The free energy difference of a transformation is a sum over those ofnsuccessiveλvalues,DG¼Xn 1
i¼0 dGi, in
whichδG
iis computed iteratively according to
h½1þe bðUliþ1ðxiÞ UliðxiÞ dGiÞ 1i
li ¼ h½1þe
bðUliþ1ðxiþ1Þ Uliðxiþ1ÞþdGiÞ 1i liþ1;
whereUis the potential energy as a function of the system’s configuration,x.
Fig 2. The thermodynamic cycle for computing the free energy difference between MOP and HMP upon binding toμOR:DDGbind¼DGMOP bind DGHMP
bind¼DG bound
MOP!HMP DG unbound
Experimental details
HumanμOR binding assay. The humanμOR binding assay was performed as homogeneous
SPA-assay (scintillation proximity assay) using the assay buffer 50 mM TRIS-HCl (pH 7.4) supplemented with 0.052 mg/ml bovine serum albumin (Sigma-Aldrich Co., St. Louis, MO). The final assay volume (250μl/well) included 1 nM of [N-allyl-2,3-3H]naloxone as ligand (Per-kinElmer Life Sciences, Inc. Boston, MA, USA), and either test compound in dilution series or 25μM unlabeled naloxone for determination of unspecific binding. The test compound was diluted with 25% DMSO in H2O to yield a final 0.5% DMSO concentration, which also served
as a respective vehicle control. The assay was started by adding wheat germ agglutinin coated SPA beads (GE Healthcare UK Ltd., Buckinghamshire, UK), which had been preloaded with humanμOR membranes (PerkinElmer Life Sciences, Inc. Boston, MA, USA). After incubation for 90 minutes at RT and centrifugation for 20 minutes at 500 rpm the signal rate was mea-sured by means of a 1450 Microbeta Triluxβ-counter (PerkinElmer Life Sciences/Wallac,
Turku, Finland). Half-maximal inhibitory concentration (IC50) values reflecting 50% displace-ment of [3H]naloxone-specific receptor binding were calculated by nonlinear regression
analy-sis and Ki values were calculated by using the Cheng-Prusoff equation [47].
Results and Discussion
The initial binding modes of MOP and HMP obtained from docking are very similar (seeS1 Filefor details). During 0.8μs MD simulations, the transmembrane domain ofμOR remain rel-atively rigid (CαRMSF ranging from 0.4 Å to 1.5 Å) while, as expected, the loop regions
ofμOR display larger fluctuations (CαRMSF ranging from 1.0 to 7.1 Å) (S1 Fig). The largest fluctuations occur in the modeled IL3, the region where a T4-lysozyme is located in the X-ray structure of the receptor, for the case of the HMP-μOR complex (S1 Fig). The CαRMSD ofμOR transmembrane domain are 1.7±0.3 Å, 1.3±0.2 Å and 1.2±0.1 Å in the MOP-μOR, HMP-μOR andβ-FNA-μOR complexes, respectively, well below the resolution of the X-ray structure (S2 Fig). MOP and HMP mostly maintain their initial docking mode, whileβ-FNA
well preserves its binding mode in the X-ray structure, the salt-bridge with D147 being pre-served during the timescale of all the MD simulations. The RMSD of the ligand non-hydrogen atoms are 3.3±0.4 Å, 2.0±0.4 Å and 1.6±0.2 Å for MOP, HMP andβ-FNA, respectively (S2 Fig).
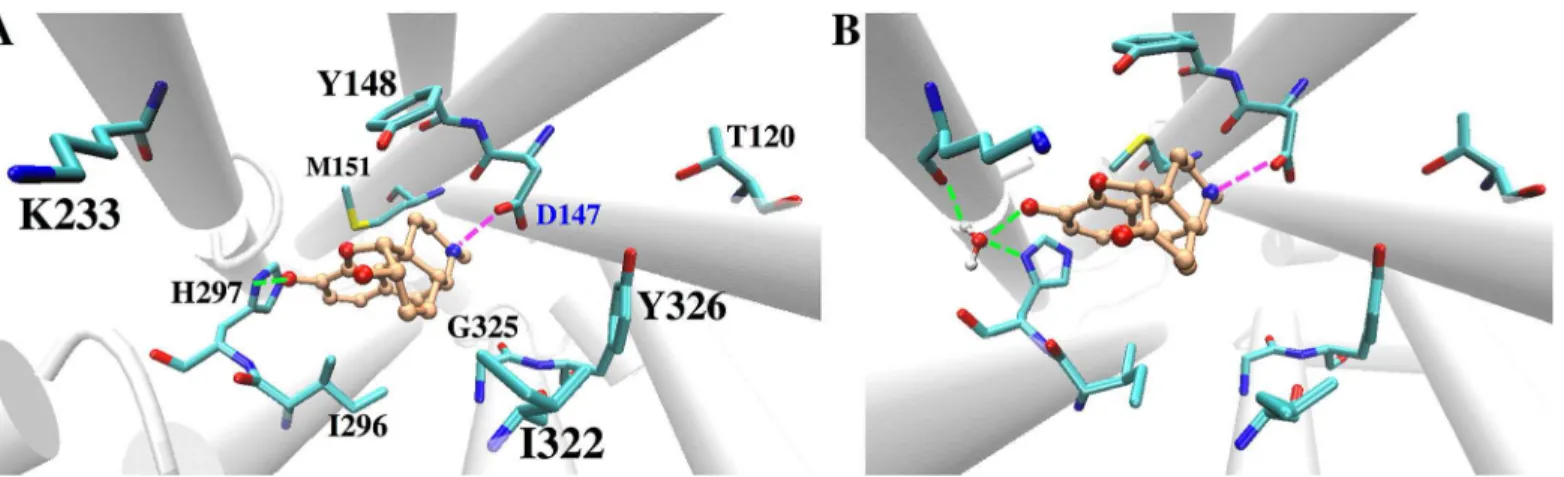
G325 and places the ligand closer to I322, resulting in slightly different HMP-μOR hydropho-bic contacts from those between MOP and the receptor (seeTable 2). In addition, the flip of the W293 side chain allows more water molecules to enter the binding cavity below HMP (i.e. opposite to the extracellular side). After W293 flips, 15±2 water molecules are present inside the cavity of HMP-µOR, to be compared with 10±2 in MOP-μOR (S3 File). The different degrees of hydration are statistically significant, as indicated by normalized histograms and Welch’st-test on the data (S3 File). Additional 0.5-μs MD simulations of MOP-μOR and HMP-μOR, starting from different initial velocities, reproduce the above-observed differences Fig 3. Representative structure of the MD simulations for (A) the MOP-μOR and (B) the HMP-μOR complexes obtained from clustering analysis. The ligand carbon atoms are in orange. H-bonds and salt-bridges are shown in green and magenta dashed lines, respectively. For clarity hydrogen atoms of the ligands and theμOR residues are not shown. H297 is monoprotonated at the Nεatom.
doi:10.1371/journal.pone.0135998.g003
Fig 4. Arrangements of aromatic residues at theμOR orthosteric binding site upon binding with (A) MOP and with (B) HMP.
of the H-bond pattern, the W293 side chain orientation, the van der Waals contacts and the hydration in the binding cavity (S3 File).
In addition, our MD simulations show the impact of agonist binding on the flexibility of the extracellular loop 3 (EL3). MOP binding is associated with conformational changes in this loop (Fig 5). Notably, the presence of MOP in the active site pocket causes W318 side chain to move away from the ligand after 470 ns, which allows E310 in EL3 to form salt-bridge interactions with K233 that reduces EL3 mobility (Fig 5).
Therefore, our MD simulations confirm the key role of D147 and H297 in binding opioid ligands [48–50] and illustrate subtle differences in the binding mode of MOP and HMP, which may account for the slightly difference in their binding affinity. Indeed, HMP accommodates in the binding pocket slightly differently from MOP, maintaining a larger propensity of water-mediated H-bonds with H297 and K233 rather than a direct H-bond with H297. HMP also leads to slightly higher hydration in the binding pocket than MOP.
Next, we calculate the relative binding affinities of MOP and HMP toμOR using alchemical free energy perturbation. This approach is highly suitable for these complexes as the ligands involved in the alchemical transformation are structurally and chemically similar (Fig 1) and, therefore, one ligand can smoothly and gradually be transformed into the other. Moreover, the salt-bridge between the positively charged basic nitrogen atom of the morphinan drugs and the negatively charged D147 is preserved during our simulations. It acts as an anchor, which limits ligand diffusion and allows adequately sampling of all the relevant drug conformations inside the active site cavity. This fact significantly reduces the statistical error associated to this kind of calculations. We critically evaluate the convergence of the computed transformation by examining the hysteresis resulting from the FEP calculations of both the forward (MOP to HMP) and the reverse (HMP to MOP) transformations. This turns out to be very satisfactory Table 2. Minimum distances between both morphinan drugs (MOP and HMP) and selected protein residues.
I296 M151 G325 I322
MOP 2.4±0.2 2.2±0.2 2.4±0.3 3.3±0.5
HMP 2.4±0.2 2.3±0.2 5.0±0.3 2.7±0.2
Distances are given inÅand averaged over thefinite temperature MD trajectories.
doi:10.1371/journal.pone.0135998.t002
Fig 5. Conformational change ofμOR EL3 observed in the case of MOP binding.E310 in EL3 forms a salt-bridge with K233 (magenta dashed lines), which remains until the end of the simulation.
complexes. In particular, the H-bond pattern emerged from both forward and reverse alchemi-cal transformations is consistent with that in the standard MD simulations, i.e. water-mediated H-bonds between HMP and H297, and direct H-bond between MOP and H297 (S3 Fig). As in the MD, the W293 side chain orientation differs in the complexes with HMP and with MOP during the alchemical free energy perturbation (S3 File). Therefore, the forward and backward alchemical transformations further corroborate the findings emerging from the MD that the differences in the H-bond patterns, the van der Waals contacts and the W293 side chain orien-tations are significant and are not statistical fluctuations. Instead, the aforementioned EL3 con-formational changes observed in the MD simulations of MOP-μOR are not present in the alchemical transformations. Thus, this feature is possibly due to statistical fluctuations and may contribute insignificantly to the ligand binding affinity.
Despite the relatively large standard deviations of our free energy calculations, the calculated and measured differences in binding affinity are in qualitative agreement. However, because these differences are very small and are close to being non-significant, these results must be interpreted with caution. Exhaustive computational studies on multiple ligands, such as those in refs. [51,52] for the glutamate receptor, would be required to establish quantitative conclu-sions on ligand-μOR energetics.
Finally, we compare the two agonists withβ-FNA. The three ligands feature very similar polycyclic ring skeletons and a common salt bridge with D147. However,β-FNA shows
differ-ent H-bond pattern: two water molecules mediate the ligand’s H-bonds with H297 and K233, which are preserved throughout the two independent MD simulations. Such pattern is not retained in either of the two agonists (Fig 6). This is likely due to the covalent bond betweenβ -FNA and K233, which constraints the antagonist’s location and mobility in the binding pocket.
We close this section by comparing the available experimental structural information on the antagonist-bound receptor with the structural predictions emerging from our simulations. In the X-ray structure of the antagonistβ-FNA covalently bound toμOR [18]–so far the only structure for this receptor–R165 in TM3 forms a H-bond with T279 in TM6 (Fig 6) [18], which turns out to be very stable during the MD simulation (lifetime 89%). By contrast, the presence of the two agonists in our simulations cause a loss of this key H-bond (lifetime<2% in both cases) along with a translational shift of TM6 with respect to TM3 (Fig 6). TM6 moves toward TM5 and, more, to the extracellular side. The CαRMSDs of TM6 with respect to the
end of TM3, conserved across ~70% of class A GPCRs [54]; (iii) the R165-T279 H-bond may stabilize the receptor in an inactive state [18,53], similar to the role of the so-called‘ionic lock’–a salt bridge in the equivalent position between TM3 and TM6 in rhodopsin [55]; (iv) previous structural studies have suggested an activation mechanism across GPCRs based on a global toggle switch mechanism involving similar movements of TM6: this helix would move toward TM5 while increasing its separation from TM3 [56]. A common activation mechanism has been proposed for class A GPCRs based on a number of X-ray structures of active and inac-tive GPCRs [57]. The mechanism involves a significant outward movement of the intracellular end of TM6. Hence, the relatively small movement between this helix and TM3 observed here might be an early event toward the activation.
Comparison of the structural determinants at the active site suggests that H297 at TM6 plays an important role in the agonist-induced shift of TM6. H297 forms direct or water-mediated H-bonds as well as van der Waals interactions with the two agonists, consistent with its role as an
“anchor”for opioids binding toμOR [50]. However, the agonists stabilize the residue in a position that is rather shifted relative to that in theβ-FNA-μOR complex (Fig 6). Hence, we suggest that the ligand-H297 interaction is a key factor for the displacement of TM6 relative to TM3 (Fig 7).
Conclusions
In the present work, we investigated the binding characteristics of two morphinan agonists (MOP and HMP) toμOR by molecular simulations. Comparison is made with a simulation of the antagonistβ-FNA covalently bound toμOR. An atomistic description of the ligand-recep-tor interactions was obtained using 3.9-μs MD simulations and 1.7μs alchemical free energy perturbation calculations. The MOP binding mode obtained here is consistent with previous 5.6μs long MD simulations [58]. Our simulations point to the crucial role of D147 and H297, which anchor the agonists via highly stable salt-bridge and H-bond interactions, respectively. Fig 6. Superimposition of representative MD structures obtained by cluster analysis (seeMaterials and Methods) for (A) MOP-μOR and (B) HMP-μOR onto the X-ray structure ofβ-FNA-μOR [18].Dashed lines indicate H-bonds.
MOP forms a direct H-bond with H297 whereas HMP forms water-mediated H-bonds with H297, both of which differ from the H-bond pattern ofβ-FNA. HMP also forms
water-medi-ated H-bonds with K233. The two agonists form slightly different van der Waals contacts with residues W293, I322 and G325. W293 side chain adopts distinct orientations upon MOP and HMP binding. The HMP-bound pocket is slightly more hydrated than in the MOP-bound one. These subtle differences in the agonists’binding mode likely account for the small difference in their binding affinity, which is here measuredin vitroand calculated with alchemical free energy perturbation. Both agonists alter the relative position between TM3 and TM6 of the receptor, likely via their interactions with H297 in TM6. The alteration disrupts the R165-T279 H-bond between TM3 and TM6 that has been suggested to stabilize the receptor in an inactive conformation in the X-ray structure [18]. By contrast, in the simulation ofβ-FNA-μOR the rel-ative position between TM3 and TM6 as well as the R165-T279 H-bond remains similar to those in the X-ray structure [18].
In conclusion, this study characterizes the structural features accounting for the two ago-nists’different affinities, and more importantly identifies the key agonist-receptor interactions that likely promote receptor activation.
Supporting Information
S1 Fig. RMSF ofμOR Cαatoms during the MD simulations of MOP-μOR (blue) and
HMP-μOR (orange).
(TIFF)
S2 Fig. RMSD ofμOR Cαatoms (blue) and of the ligand non-hydrogen atoms (red) with
respect to the initial structure during the 0.8μs MD simulations of (left) MOP-μOR,
(mid-dle) HMP-μOR and (right)β-FNA-μOR.
(TIFF)
Fig 7. Schematic model of the agonist-inducedμOR conformational change into an active-like state.
S3 Fig. H-bond patterns between the agonists andμOR residue H297: direct (blue) and
water-mediated (red) H-bonds. (A)The dominant H-bond patterns during the MD simula-tions for MOP-μOR and HMP-μOR. The number of bridging water molecules in these H-bonds is plotted in(B, C)as a function of simulation time in the two independent MD simula-tions (lasting 0.8μs and 0.5μs, respectively), and in(D)during the course of the forward and backward alchemical transformations.
(TIFF)
S4 Fig. RMSD ofμOR TM6 Cαatoms in the case of MOP bound (blue), HMP bound
(orange) andβ-FNA bound (green) with respect to those in the X-ray structure.
(TIFF)
S1 File. MOP and HMP binding modes selected from docking.
(PDF)
S2 File. Partial charges and atom types of the ligands used in the MD simulations.
(PDF)
S3 File. Differences between MOP-μOR and HMP-μOR in the W293 side chain orientation,
the hydration inside the binding cavity and the van der Waals contacts.
(PDF)
Acknowledgments
The authors acknowledge the Jülich-Aachen Research Alliance (JARA, Germany) and the Jülich Supercomputing Center (Jülich, Germany) for computing recourses.
Author Contributions
Conceived and designed the experiments: P. Carloni AK MW. Performed the experiments: XC P. Campomanes AK IS MW TK. Analyzed the data: XC P. Campomanes AK MW. Wrote the paper: XC P. Campomanes AK IS TK P. Carloni.
References
1. Kuehn BM. Prescription drug abuse rises globally. Jama-Journal of the American Medical Association. 2007; 297(12):1306–. doi:10.1001/jama.297.12.1306PMID:WOS:000245212600005.
2. Christie MJ. Cellular neuroadaptations to chronic opioids: tolerance, withdrawal and addiction. British Journal of Pharmacology. 2008; 154(2):384–96. doi:10.1038/bjp.2008.100PMID:
WOS:000255755900011.
3. Ross S, Peselow E. The Neurobiology of Addictive Disorders. Clinical Neuropharmacology. 2009; 32 (5):269–76. doi:10.1097/WNF.0b013e3181a9163cPMID:WOS:000270662300007.
4. Bailey CP, Connor M. Opioids: cellular mechanisms of tolerance and physical dependence. Current Opinion in Pharmacology. 2005; 5(1):60–8. doi:10.1016/j.coph.2004.08.012PMID:
WOS:000226957400010.
5. Stevens RC, Cherezov V, Katritch V, Abagyan R, Kuhn P, Rosen H, et al. The GPCR Network: a large-scale collaboration to determine human GPCR structure and function. Nature Reviews Drug Discovery. 2013; 12(1):25–34. doi:10.1038/nrd3859PMID:WOS:000312987000013.
6. Lord JA, Waterfield AA, Hughes J, Kosterlitz HW. Endogenous opioid peptides: multiple agonists and receptors. Nature. 1977; 267(5611):495–9. Epub 1977/06/09. PMID:195217.
7. Brownstein MJ. A brief history of opiates, opioid peptides, and opioid receptors. Proc Natl Acad Sci U S A. 1993; 90(12):5391–3. Epub 1993/06/15. PMID:8390660; PubMed Central PMCID: PMC46725. 8. Mollereau C, Parmentier M, Mailleux P, Butour JL, Moisand C, Chalon P, et al. ORL1, a novel member
14. Rominger DH, Cowan CL, Gowen-MacDonald W, Violin JD. Biased ligands: pathway validation for novel GPCR therapeutics. Current Opinion in Pharmacology. 2014; 16:108–15. doi:10.1016/j.coph. 2014.04.002PMID:WOS:000338094300015.
15. Kenakin T. Functional Selectivity and Biased Receptor Signaling. Journal of Pharmacology and Experi-mental Therapeutics. 2011; 336(2):296–302. doi:10.1124/jpet.110.173948PMID:
WOS:000286309800001.
16. Lamberts JT, Traynor JR. Opioid Receptor Interacting Proteins and the Control of Opioid Signaling. Current Pharmaceutical Design. 2013; 19(42):7333–47. PMID:WOS:000329431900002.
17. DeWire SM, Yamashita DS, Rominger DH, Liu GD, Cowan CL, Graczyk TM, et al. A G Protein-Biased Ligand at the mu-Opioid Receptor Is Potently Analgesic with Reduced Gastrointestinal and Respiratory Dysfunction Compared with Morphines. Journal of Pharmacology and Experimental Therapeutics. 2013; 344(3):708–17. doi:10.1124/Jpet.112.201616PMID:ISI:000315192500017.
18. Manglik A, Kruse AC, Kobilka TS, Thian FS, Mathiesen JM, Sunahara RK, et al. Crystal structure of the mu-opioid receptor bound to a morphinan antagonist. Nature. 2012; 485(7398):321–6. Epub 2012/03/ 23. doi:10.1038/nature10954PMID:22437502; PubMed Central PMCID: PMC3523197.
19. Rasmussen SGF, DeVree BT, Zou YZ, Kruse AC, Chung KY, Kobilka TS, et al. Crystal structure of the beta(2) adrenergic receptor-Gs protein complex. Nature. 2011; 477(7366):549–U311. doi:10.1038/ Nature10361PMID:ISI:000295320900031.
20. Eswar N, Webb B, Marti-Renom MA, Madhusudhan MS, Eramian D, Shen MY, et al. Comparative pro-tein structure modeling using Modeller. Curr Protoc Bioinformatics. 2006;Chapter 5:Unit 5 6. Epub 2008/04/23. doi:10.1002/0471250953.bi0506s15PMID:18428767.
21. Weichenberger CX, Sippl MJ. NQ-Flipper: recognition and correction of erroneous asparagine and glu-tamine side-chain rotamers in protein structures. Nucleic Acids Research. 2007; 35:W403–W6. doi:10. 1093/nar/gkm263PMID:WOS:000255311500075.
22. Gordon JC, Myers JB, Folta T, Shoja V, Heath LS, Onufriev A. H++: a server for estimating pK(a)s and adding missing hydrogens to macromolecules. Nucleic Acids Research. 2005; 33:W368–W71. doi:10. 1093/nar/gki464PMID:WOS:000230271400074.
23. Molecular Operating Environment (MOE) 2012.10. 1010 Sherbooke St. West, Suite #910, Montreal, QC, Canada, H3A 2R7: Chemical Computing Group Inc.; 2013.
24. Labute P. Protonate3D: Assignment of ionization states and hydrogen coordinates to macromolecular structures. Proteins. 2009; 75(1):187–205. doi:10.1002/Prot.22234PMID:ISI:000263546600016. 25. Labute P. The generalized Born/volume integral implicit solvent model: Estimation of the free energy of
hydration using London dispersion instead of atomic surface area. J Comput Chem. 2008; 29 (10):1693–8. doi:10.1002/Jcc.20933PMID:ISI:000257038200018.
26. Zhang L, Hermans J. Hydrophilicity of cavities in proteins. Proteins-Structure Function and Genetics. 1996; 24(4):433–8. doi:10.1002/(Sici)1097-0134(199604)24:4<433::Aid-Prot3>3.0.Co;2-FPMID:ISI: A1996UF55700004.
27. Lomize MA, Lomize AL, Pogozheva ID, Mosberg HI. OPM: Orientations of proteins in membranes data-base. Bioinformatics. 2006; 22(5):623–5. doi:10.1093/Bioinformatics/Btk023PMID:
ISI:000235604400018.
28. Tattrie NH, Bennett JR, Cyr R. Maximum and Minimum Values for Lecithin Classes from Various Bio-logical Sources. Can J Biochem Cell B. 1968; 46(8):819–&. PMID:ISI:A1968B639900015.
30. Jambeck JPM, Lyubartsev AP. Derivation and Systematic Validation of a Refined All-Atom Force Field for Phosphatidylcholine Lipids. J Phys Chem B. 2012; 116(10):3164–79. doi:10.1021/Jp212503e PMID:ISI:000301509500014.
31. Schmidt TH, Kandt C. LAMBADA and InflateGRO2: Efficient Membrane Alignment and Insertion of Membrane Proteins for Molecular Dynamics Simulations. J Chem Inf Model. 2012; 52(10):2657–69. doi:10.1021/Ci3000453PMID:ISI:000310043800018.
32. Van der Spoel D, Lindahl E, Hess B, Groenhof G, Mark AE, Berendsen HJC. GROMACS: Fast, flexible, and free. J Comput Chem. 2005; 26(16):1701–18. doi:10.1002/Jcc.20291PMID:
ISI:000233021400004.
33. Jorgensen WL, Chandrasekhar J, Madura JD, Impey RW, Klein ML. Comparison of Simple Potential Functions for Simulating Liquid Water. J Chem Phys. 1983; 79(2):926–35. doi:10.1063/1.445869 PMID:ISI:A1983QZ31500046.
34. Aqvist J. Ion Water Interaction Potentials Derived from Free-Energy Perturbation Simulations. J Phys Chem-Us. 1990; 94(21):8021–4. PMID:ISI:A1990EE48600009.
35. Lindorff-Larsen K, Piana S, Palmo K, Maragakis P, Klepeis JL, Dror RO, et al. Improved side-chain tor-sion potentials for the Amber ff99SB protein force field. Proteins. 2010; 78(8):1950–8. doi:10.1002/ Prot.22711PMID:ISI:000277767700012.
36. Frisch MJ, Trucks GW, Schlegel HB, Scuseria GE, Robb MA, Cheeseman JR, et al. Gaussian 09, Revi-sion A.02. Wallingford CT2009.
37. Wang JM, Cieplak P, Kollman PA. How well does a restrained electrostatic potential (RESP) model per-form in calculating conper-formational energies of organic and biological molecules? J Comput Chem. 2000; 21(12):1049–74. doi:10.1002/1096-987x(200009)21:12<1049::Aid-Jcc3>3.0.Co;2-FPMID:
ISI:000088366200003.
38. Wang JM, Wolf RM, Caldwell JW, Kollman PA, Case DA. Development and testing of a general amber force field. J Comput Chem. 2004; 25(9):1157–74. doi:10.1002/Jcc.20035PMID:
ISI:000221624200007.
39. Andersen HC. Molecular-Dynamics Simulations at Constant Pressure and-or Temperature. J Chem Phys. 1980; 72(4):2384–93. PMID:ISI:A1980JK06800026.
40. Parrinello M, Rahman A. Polymorphic Transitions in Single-Crystals—a New Molecular-Dynamics Method. J Appl Phys. 1981; 52(12):7182–90. PMID:ISI:A1981MT07800024.
41. Nose S, Klein ML. Constant Pressure Molecular-Dynamics for Molecular-Systems. Mol Phys. 1983; 50 (5):1055–76. doi:10.1080/00268978300102851PMID:ISI:A1983RW97600012.
42. Hess B, Bekker H, Berendsen HJC, Fraaije JGEM. LINCS: A linear constraint solver for molecular sim-ulations. J Comput Chem. 1997; 18(12):1463–72. doi:10.1002/(Sici)1096-987x(199709)18:12<1463:: Aid-Jcc4>3.0.Co;2-HPMID:ISI:A1997XT81100004.
43. Darden T, Perera L, Li LP, Pedersen L. New tricks for modelers from the crystallography toolkit: the par-ticle mesh Ewald algorithm and its use in nucleic acid simulations. Struct Fold Des. 1999; 7(3):R55–
R60. doi:10.1016/S0969-2126(99)80033-1PMID:ISI:000079411100003.
44. Hess B, Kutzner C, van der Spoel D, Lindahl E. GROMACS 4: Algorithms for highly efficient, load-bal-anced, and scalable molecular simulation. J Chem Theory Comput. 2008; 4(3):435–47. doi:10.1021/ Ct700301qPMID:ISI:000254277900007.
45. Daura X, Gademann K, Jaun B, Seebach D, van Gunsteren WF, Mark AE. Peptide folding: When simu-lation meets experiment. Angew Chem Int Edit. 1999; 38(1–2):236–40. 10.1002/(Sici)1521-3773 (19990115)38:1/2<236::Aid-Anie236>3.0.Co;2-M. PMID:ISI:000078230400061.
46. Kirkwood JG. Statistical mechanics of fluid mixtures. J Chem Phys. 1935; 3(5):300–13. doi:10.1063/1. 1749657PMID:ISI:000201218900011.
47. Cheng Y, Prusoff WH. Relationship between the inhibition constant (K1) and the concentration of inhibi-tor which causes 50 per cent inhibition (I50) of an enzymatic reaction. Biochemical pharmacology. 1973; 22(23):3099–108. Epub 1973/12/01. PMID:4202581.
48. Surratt CK, Johnson PS, Moriwaki A, Seidleck BK, Blaschak CJ, Wang JB, et al.-Mu Opiate Receptor
—Charged Transmembrane Domain Amino-Acids Are Critical for Agonist Recognition and Intrinsic Activity. Journal of Biological Chemistry. 1994; 269(32):20548–53. PMID:ISI:A1994PB31700054. 49. Serohijos AWR, Yin SY, Ding F, Gauthier J, Gibson DG, Maixner W, et al. Structural Basis for
mu-Opi-oid Receptor Binding and Activation. Structure. 2011; 19(11):1683–90. doi:10.1016/J.Str.2011.08.003 PMID:ISI:000296999700019.
56. Schwartz TW, Frimurer TM, Holst B, Rosenkilde MM, Elling CE. Molecular mechanism of 7TM receptor activation—A global toggle switch model. Annual Review of Pharmacology and Toxicology. 2006; 46:481–519. doi:10.1146/Annurev.Pharmtox.46.120604.141218PMID:ISI:000235981300017. 57. Tehan BG, Bortolato A, Blaney FE, Weir MP, Mason JS. Unifying Family A GPCR Theories of
Activa-tion. Pharmacol Therapeut. 2014; 143(1):51–60. doi:10.1016/J.Pharmthera.2014.02.004PMID: ISI:000335622800005.
![Table 1. EC 50 (nM) cAMP and β-arrestin2 values for MOP and HMP on human μOR [17], as well as the binding affinities of the two agonists for μOR.](https://thumb-eu.123doks.com/thumbv2/123dok_br/16350696.189539/2.918.298.866.953.1015/table-camp-arrestin-values-human-binding-affinities-agonists.webp)

![Fig 6. Superimposition of representative MD structures obtained by cluster analysis (see Materials and Methods) for (A) MOP-μOR and (B) HMP- HMP-μOR onto the X-ray structure of β-FNA-HMP-μOR [18]](https://thumb-eu.123doks.com/thumbv2/123dok_br/16350696.189539/10.918.59.846.114.496/superimposition-representative-structures-obtained-analysis-materials-methods-structure.webp)