Insulin Fibrillation Process: A Study by High and Low
Resolution Spectroscopy
Victor Banerjee1., Rajiv K. Kar2., Aritreyee Datta2
, Krupakar Parthasarathi3, Subhrangsu Chatterjee2, Kali P. Das1*, Anirban Bhunia2*
1Department of Chemistry, Bose Institute, Kolkata, India,2Biomolecular NMR and Drug Design Laboratory, Department of Biophysics, Bose Institute, Kolkata, India, 3Department of Microbiology, National University of Singapore, Singapore, Singapore
Abstract
A non-toxic, nine residue peptide, NIVNVSLVK is shown to interfere with insulin fibrillation by various biophysical methods. Insulin undergoes conformational changes under certain stress conditions leading to amyloid fibrils. Fibrillation of insulin poses a problem in its long-term storage, reducing its efficacy in treating type II diabetes. The dissociation of insulin oligomer to monomer is the key step for the onset of fibrillation. The time course of insulin fibrillation at 62uC using Thioflavin T fluorescence shows an increase in the lag time from 120 min without peptide to 236 min with peptide. Transmission electron micrographs show branched insulin fibrils in its absence and less inter-fibril association in its presence. Upon incubation at 62uC and pH 2.6, insulin lost somea-helical structure as seen by Fourier transformed infra-red spectroscopy (FT-IR), but if the peptide is added, secondary structure is almost fully maintained for 3 h, though lost partially at 4 h. FT-IR spectroscopy also shows that insulin forms the cross beta structure indicative of fibrils beyond 2 h, but in the presence of the peptide,a-helix retention is seen till 4 h. Both size exclusion chromatography and dynamic light scattering show that insulin primarily exists as trimer, whose conversion to a monomer is resisted by the peptide. Saturation transfer difference nuclear magnetic resonance confirms that the hydrophobic residues in the peptide are in close contact with an insulin hydrophobic groove. Molecular dynamics simulations in conjunction with principal component analyses reveal how the peptide interrupts insulin fibrillation.In vitrohemolytic activity of the peptide showed insignificant cytotoxicity against
HT1080 cells. The insulin aggregation is probed due to the inter play of two key residues, PheB24and TyrB26monitored from molecular dynamics simulations studies. Further new peptide based leads may be developed from this nine residue peptide.
Citation:Banerjee V, Kar RK, Datta A, Parthasarathi K, Chatterjee S, et al. (2013) Use of a Small Peptide Fragment as an Inhibitor of Insulin Fibrillation Process: A Study by High and Low Resolution Spectroscopy. PLoS ONE 8(8): e72318. doi:10.1371/journal.pone.0072318
Editor:Eugene A. Permyakov, Russian Academy of Sciences, Institute for Biological Instrumentation, Russian Federation ReceivedMay 21, 2013;AcceptedJuly 10, 2013;PublishedAugust 29, 2013
Copyright:ß2013 Banerjee et al. This is an open-access article distributed under the terms of the Creative Commons Attribution License, which permits unrestricted use, distribution, and reproduction in any medium, provided the original author and source are credited.
Funding:This work was supported partially by CSIR (fellowship No. 09015(0358)/2008-EMR-I to VB) and partially funded by Institutional fund (to KP and AB). The funders had no role in study design, data collection and analysis, decision to publish, or preparation of the manuscript.
Competing Interests:The authors have declared that no competing interests exist. * E-mail: [email protected] (AB); [email protected] (KPD)
.These authors contributed equally to this work.
Introduction
Protein fibrillation is one of the important physiological processes that have been linked to development of many pathological conditions, affecting the quality of life for mankind [1]. Alzheimer’s disease, Prion-associated encephalopathies, Hun-tington’s disease, Type II diabetes, Parkinson’s disease and many more diseases have been linked to protein fibrillation [2,3]. During the fibrillation process globular proteins undergo structural perturbation followed by a series of structural transitions leading to the formation of insoluble fibrils, containingb-cross sheet like structure [4]. Excessive deposition/accumulation of stable, ordered and amorphous protein aggregates are collectively called amyloid fibrils [5]. Deposition of excessive stable, ordered and amorphous protein aggregates in organs and tissues lead to crucial biological dysfunctions and deleterious pathological symptoms [6]. Researches till date have explored the fact that despite the diversity in sequence homology, the protein fibrils share similar formation pathways and similar morphologies. However, the exact
biochemical/biophysical pathways and mechanism of protein fibrillation are yet to be fully understood [7,8].
Insulin, a 51-residue protein hormone, is central for regulation of blood-glucose level [9]. Due to its propensity to undergo stress induced conformational changes leading to various aggregated forms including amyloid fibrils, it has become the subject of intense study not only as a model fibril forming system but also as the insulin instability issue that reduces the efficacy of insulin therapy against type II diabetes [10–12]. The pathological fingerprints of fibrillar insulin have been reported with amyloid deposits in patients with diabetes and in normal ageing [13–15]. Once such a deposition takes place, it is mostly irreversible, and may lead to deleterious physiological conditions [16]. It has been reported that soluble oligomers formed at the pre-fibrillar state produces most toxic effects [17–19]. Thus, research aiming to delay or inhibit the fibrillation process of insulin can prove to be of great therapeutic value.
routed via natural source or synthetic pathways are generally termed as amyloid inhibitors. The idea behind such anti-amyloid agent is to inhibit the creation of amyloidogenic aggregate and/to arrest the amyloid construction. Insulin consists of two polypeptide chains (Chain A –21 residues; Chain B –30 residues) held together by two disulphide bonds. The solution state of insulin contains a mixture of different oligomeric species including hexamer, tetramer, dimer and monomer [22]. Chain A consists of two helical sections: A2–A8 and A13–A20, whereas Chain B includes a region of extended structure B1–B8, helical section B9–B19, a turn B20–B23 and a terminal extended b-strand B24–B28 [9]. Dissociation of insulin oligomer into monomer facilitates the fibrillation process [10–11]. The existence of the conformational intermediates that serve as the precursor for formation of the active nuclei, ultimately culminating into the fibrils is also crucial. Recent work from our laboratory has shown that trifluoroethanol a small molecule could delay the fibrillation of insulin by interfering with the oligomer to monomer dissociation step [23]. Based on these findings, it appears logical to target such steps in order to prevent or slow down the fibrillation process.
Peptides consisting of natural amino acids can be considered as advantageous, as they are devoid of many drawbacks and thus preferred as therapeutics. In the present study we are reporting a nine-residue peptide, NK9 (NIVNVSLVK), which delays the fibrillation process of insulin even in sub-stoichiometric ratio. NK9 is adopted from the middle of the SARS corona virus E-protein primary sequence [24], initially chosen serendipitously. Generally, the polypeptide fragments that have property of self-recognition are important for design of peptide based anti-amyloidogenic agents [25]. The factors, like peptide length and selectivity with respect to L-or D-analogues of peptides, are more crucial according to many groups [26–30]. Peptides constituting hydro-phobic residues are known to execute inhibition of oligomerization in several biologically important proteins [31–33]. NK9 has beta-sheet breaker-hydrophobic residues, like Ile, Val and Leu. The present study helps us to understand the probable mechanism of action for delaying of fibrillation process, where NK9 interferes with the nucleation phase of insulin to decrease the toxicity of the overall process. There are reports that showed different peptides are involved in delaying and/or inhibition of fibrillation process in proteins without giving any significant experimental evidence or emphasis over the cause of the phenomena [27–29]. The experimental evidence that NK9 binds with insulin molecule is derived with the help of fluorescence anisotropy experiment. The molecular interaction of peptide with insulin was monitored by means of nuclear magnetic resonance (NMR) spectroscopy and modeled using molecular dynamics simulation [34–35] and validated using saturation transfer difference (STD) NMR experiment [36–37]. The study helps us understanding the interaction of the peptide with insulin and the underlying mechanism for delaying of fibrillation process.
Results and Discussion
General strategies for prevention of insulin fibrillation One of the early strategies was to increase the stability of insulin by suitable formulation for long-term storage [38]. Since the fibrillation proceeds via dissociation of insulin oligomers into the monomers, strategies for prevention of insulin fibrillation also included among other things promotion of self-association to prevent dissociation into monomer. This was the rationale behind the use of metal ions like Zn2+
or Ca2+
to stabilize the hexameric structure [39–40]. Another approach to stabilize insulin was to promote the native hydrophobic interactions and/or to block
unwanted interactions. Polyhydroxy compounds such as carbohy-drates and glycerol prohibited water penetration into the hydrophobic core promoting native hydrophobic interactions [41–42].
Amphiphilic block co-polymers of polyhydroxy compounds, cyclodextrin and lecithin reduced unwanted hydrophobic interac-tions by engaging the exposed hydrophobic groups and thus acted as amyloid inhibitors [43–44]. Recent studies have explored small molecules such as benzofuranone derivatives and quercetin interfered with the dissociation of the oligomeric insulin to monomer and also destabilized preformed insulin fibril [45–46]. Recent studies from our laboratory also showed that trifluor-oethanol (TFE) on binding with insulin trimer prevented the appearance of soluble oligomers, believed to be the most toxic product of fibrillation [23].
Use of small peptides for delaying insulin fibrillation has also been reported recently, although molecular details of the interaction of the peptide with insulin remain elusive [47]. We have chosen this 9 residue peptide NK9, which also slows down the insulin fibrillation process. We made a detailed spectroscopic characterization of the fibrillation process of insulin as a function of time and also attempted to get molecular details of the interaction of the peptide with insulin to understand the mechanism of delaying the fibril formation.
Monitoring of insulin fibrillation kinetics in presence of NK9 via Thioflavin T (ThT) fluorescence
Thioflavin T (ThT) is a dye that preferentially binds to amyloid-like fibrils thereby causing substantial enhancement in its fluorescence emission intensity [48]. Time course of insulin fibrillation in the presence and absence of NK9 was monitored using ThT fluorescence (Figure 1A). Fluorescence measurements were carried out for 7 hr at 62uC. As usual, the ThT fluorescence remains negligible for a considerable period of time (lag time) followed by sharp increase, which eventually leveled off. The lag time for insulin fibrillation is 120 min. NK9 delayed the fibrillation process of insulin in a concentration dependant manner. Even 50mM concentration of NK9, where molar ratio of insulin to NK9 is 1:0.14, showed the delaying effect in fibrillation process. At 175mM concentration of NK9 (1:0.5 molar ratio), the lag time of fibrillation process was 236 minutes. The lag time increased as NK9 concentration increased (Table S1). However, the lag time remained unchanged after a point in NK9 concentration. Figure 1 also depicts the difference in binding of ThT to insulin fibrils in the absence and presence of NK9 as evident from the difference in the final fluorescence emission intensity values.
of NK9 seems to be over in 30 min incubation. Addition of NK9 after 30 min thus did not affect the fibrillation kinetics, but affected only the texture of the fibril possibly by interacting with post nucleation structural intermediates.
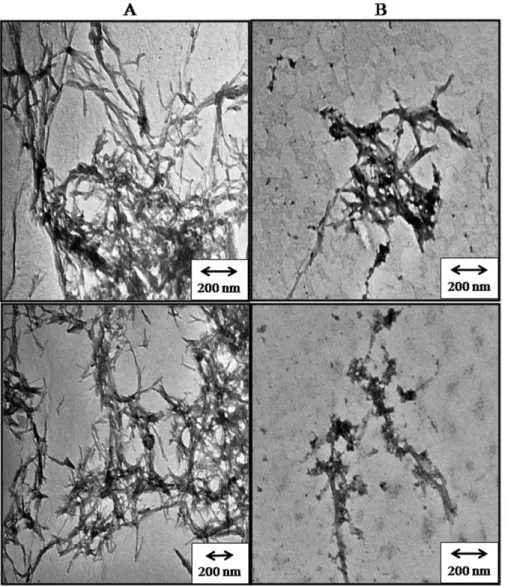
was confirmed by electron micrograph images of insulin fibrils in presence and absence of NK9 (Figure 2). TEM data shows that insulin fibrils in absence of NK9 are branched and those in presence of NK9 are less associated (Figure 2). Nevertheless, the apparent rate constant for fibril growth phase remained almost the same in every case. This indicates that NK9 only delayed the association process in the pre-fibrillar nucleation phase and it does not kinetically affect the post nucleation process leading to fibril growth, although it does have an impact on fibril morphology.
Circular dichroism spectral changes of insulin during fibrillation in presence of NK9
A change in the secondary structure of proteins to crossb-sheet structure is the hall mark of fibril formation [49]. We investigated the changes in the secondary structure of insulin in the absence and presence of NK9 with the help of circular dichroism (CD) spectroscopy. Insulin, a helical protein, shows dual minima at 222 nm and 208 nm that are the characteristics of all major helical proteins. Figure 3A and 3B are the Far UV-CD spectra of insulin at different time points of incubation in the absence as well as presence of NK9, respectively. With the increase in the time of
incubation, the negative ellipticity values at 222 nm and 208 nm also decrease, which indicates increased order in the secondary structure of insulin. In order to have a quantitative analysis of the change in secondary structure of insulin during fibrillation process, we have de-convoluted the far UV-CD data with the help of CDNN software. After 100 min of incubation, the helix content of insulin decreased to 39% with little increase inb-sheet structure. Whereas, the secondary structure of insulin in presence of NK9, remained almost unchanged for 180 min of incubation. At 240 min of incubation, helix content of insulin in presence of NK9 decreased only to 42%. This implies that NK9 helps insulin to retain its secondary structure for a prolonged period of time. Appearance of insoluble aggregates makes it difficult to continue the CD measurement beyond 100 min of incubation for insulin alone and 240 min of incubation, for insulin in presence of NK9. Nevertheless, NK9 does not have a well-defined structure even in the presence of insulin (Figure 3C).
Figure 2. Negative-staining transmission electron micrographs: (A) Bovine insulin and (B) Bovine insulin in presence of NK9.Molar ratio of NK9 to insulin is 1:1. Insulin fibrils were grown at pH 2.6 and temperature 62uC for 8 hours. Scale bars,200 nm.
Effect of NK9 on the secondary structural changes during insulin fibrillation: FT-IR study
FT-IR has been used to study secondary structure of proteins for decades [47,50–53]. It is particularly sensitive to changes ofb -sheet content in proteins [43]. Being anahelical protein insulin has a characteristic peak at,1654 cm21in its amide I contour. On conversion into amyloid like fibrils, the peak shifts to 1628 cm21, which is the hallmark of cross b-sheet structure formation [54]. Figure 3 shows FT-IR spectra of insulin measured at various intervals of incubation. Plot of A1628/A1654against time of incubation (Figure 4) showed very small changes in the ratio and
spectral shape take place for the first 2 h of incubation. The transition involving significant increases in the A1628/A1654ratio was observed after 2 h of incubation, and it persisted for 4 h. This is the cause of steady increase in intensity at 1628 cm21, with a concomitant decrease in intensity at 1654 cm21(Figure 4). This change reflects the formation of crossbsheet structure in insulin at the expense of its helical content. Insulin in presence of NK9 retains its secondary structure for 4 h of incubation (Figure 4). A1628/A1654 ratio at 4.5 h of incubation showed a much lower value as compared to the ratio in case of insulin alone after 4 h of incubation (Figure 4). This observation indicates that NK9 slowed down the stepwise changes in insulin secondary structure during the process of fibrillation. The amount of helical content left and b-sheet content increased after formation of mature fibril was calculated using the multi curve fitting program of origin 6.0 software (Figure S1). Curve fitting analysis showed that insulin in the presence and absence of NK9 has similar percentages ofa -helix and b-sheet content (Figure 4). Although NK9 delays the fibrillation process of insulin, mature fibrils of insulin have,60% b-sheet content irrespective of NK9 presence.
Size exclusion chromatographic study of insulin in presence of NK9 during Fibrillation
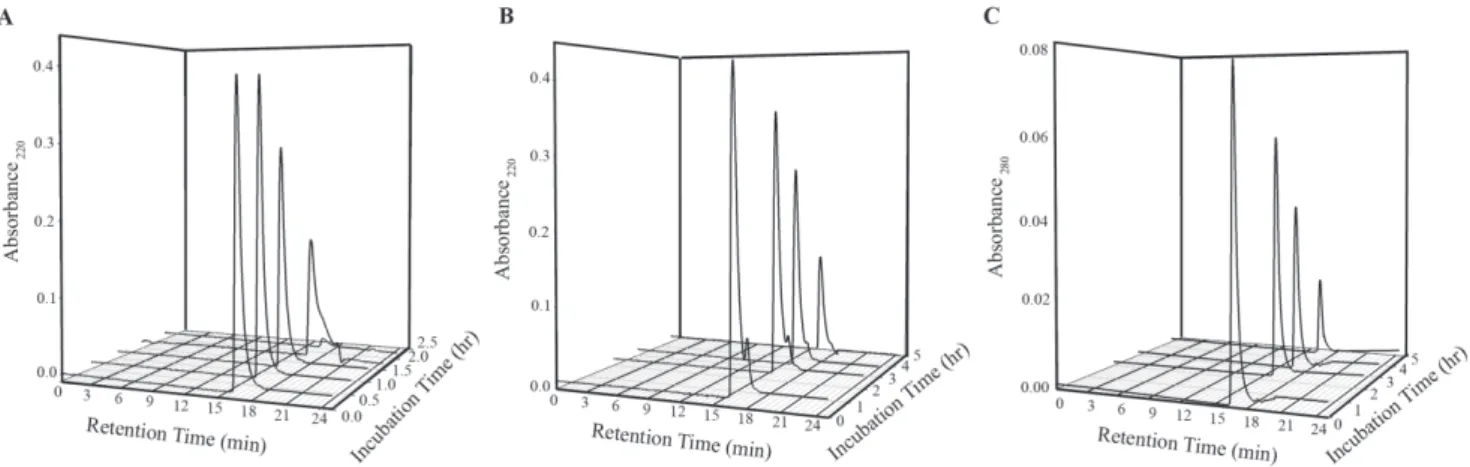
The association states of insulin in the presence and absence of NK9 were determined by the size exclusion chromatography using TSKgel SuperSW2000 HPLC column. The column was pre-calibrated using size exclusion marker proteinsb-amylase, ADH, BSA, carbonic anhydrase, lysozyme, and ribonuclease. The calibration data fitted nicely into a linear equation (correlation coefficient, R2= 0.98). Since incubation of insulin samples for fibrillation experiment were done using citrate phosphate buffer of pH 2.6, the HPLC column was equilibrated with this buffer for experiment with insulin. It was confirmed by using BSA and lysozyme that both proteins retained their globular shape as retention time at this acidic pH did not significantly change from those at pH 7.0 (data not shown). Aliquots of insulin solution at different time points of incubation were centrifuged at 40006g force to remove visible turbidity. Supernatant was loaded on to the HPLC column. Prior incubation of insulin in citrate phosphate buffer showed a retention time of 16.9 ml (Figure 5A). This retention time corresponds to the trimeric structure of insulin that corroborates well with earlier findings by Banga and co-workers [39]. Retention time of insulin remained unchanged for 1.5 hr with concomitant decrease in its absorbance value. The increase in incubation time up to 2 hr, shifted the retention time of insulin to 17.9 min that corresponds to the monomeric insulin. After 2 hr of incubation, fluorescence emission intensity just started to increase (Figure 1) implying that active nucleus of insulin fibrils was formed just after 2 hr of incubation. The size exclusion chromatography data shows that the building block of this active nucleus is a monomer of insulin. This conclusion is in agreement with the literature data as well [55].
Insulin incubated with NK9 (1:1 molar ratio) showed two distinct retention times, one was at 16.9 min and another one was at 18.1 min. The first peak could be due to Insulin-NK9 complex and the latter for NK9 alone (Figure 5B). Since NK9 does not contain any tryptophan residue there was no peak appeared at 18.1 min when absorbance values were taken at wavelength 280 nm (Figure 5C). This also confirms that the peak appeared at 18.1 min was for NK9 alone. Since NK9 is a short peptide, binding with insulin does not have any significant influence on molecular mass and on the retention time of insulin. Consequent-ly, the retention time of insulin-NK9 complex is identical with that of insulin alone. As incubation time proceeds, the absorbance Figure 3. Effect of NK9 binding over secondary structure of
insulin during insulin fibrillation monitored by circular dichro-ism. Selected buffer subtracted far-UV CD spectra of (A) Insulin (B) Insulin in presence of NK9 (NK9 spectra at these selected time points were subtracted from insulin NK9 spectra). (C) Far UV-CD spectra of NK9 in presence and absence of insulin (Insulin spectra was subtracted from NK9 insulin spectra). The concentration of insulin and NK9 both were 350mM (insulin:NK9 = 1:1). During the measurement the samples were diluted to 50mM.
Figure 4. Conformational changes during insulin fibrillation as detected by FT-IR.Time dependent FT-IR spectra of insulin (2.0 mg/ml in D2O) in absence (A) and presence (B) of NK9 in 62uC and pD 2.6. Amide-I band were acquired in the 1700–1600 cm21range at a resolution of 2 cm21. Each spectrum is an average of 32 scans and subtracted from solvent spectrum. Panel C shows the ratio of absorbance ofb-sheet peak at 1628 cm21
to helical peak at 1654 cm21. Filled square represents insulin and open circle represents insulin in presence of NK9. Panel D shows percentage ofa
-helix andb-sheet present in native and fibrillar insulin in presence and absence of NK9. The molar ratio of insulin to NK9 is 1:1. doi:10.1371/journal.pone.0072318.g004
value at both retention time points decreased. This indicates that the insoluble part of insulin, contain the NK9 peptide. Since there was not much change in retention time of insulin-NK9 complex during 5 hr of incubation, it is understood that NK9 stabilizes the associated trimeric state of insulin.
Association state of insulin during fibrillation in presence NK9
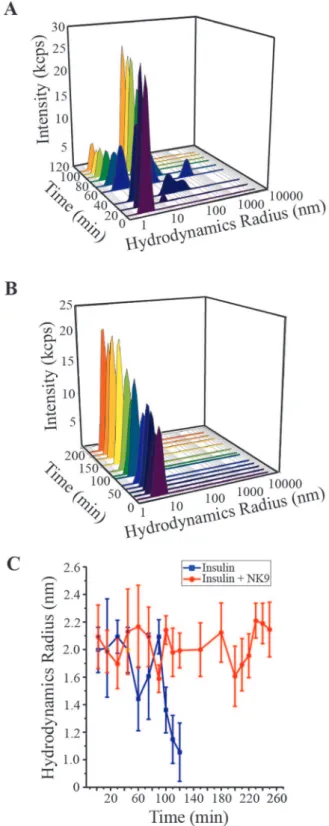
Dynamic light scattering experiment showed that the hydrody-namic radius of insulin in the presence and absence of NK9 was 2.1 and 2.0 nm, respectively, that corresponds to the trimeric state of insulin (Figure 6). After 30 min of incubation, insulin associated to form a large oligomer of 24 nm in size along with its trimeric association state (Figure 6A). As the time of incubation increased, population of 24 nm sized oligomer increased and retained up to 120 min of incubation. Though, the intensity scattered by the higher oligomer is more than the trimeric association state of insulin, the percentage of trimeric insulin is much more than that of the higher oligomer. This observation is also evident from our size exclusion chromatography data. After 100 min of incubation, insulin trimer disintegrates and forms insulin monomer of 1.3 nm (Figure 6). This is believed to be the building block of active nucleus of the fibrillation process [56]. Insulin in presence of NK9 shows hydrodynamic radii of 2.1 nm indicating the trimeric association state. This 0.1 nm increase is within experimental error, so we cannot say that this increment is due to binding with a 9 residue peptide. However, subtle change in conformation of insulin bound with NK9 is reflected due to the increase in scatting intensity as the incubation time increases (Figure 6B). Insulin in the presence of NK9 retained its trimeric state up to 240 minutes of incubation (Figure 6C). However, after 240 min of incubation, insulin started to form visible precipitates and renders the DLS experiment unsuitable to be conducted for further time points.
Fluorescence anisotropy (FA) analysis of the interaction of NK9 with insulin
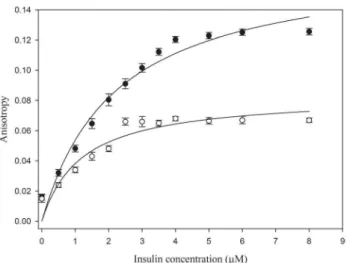
Fluorescence anisotropy (FA) is a useful technique to study the binding interaction of a fluorescently labeled ligand with proteins. Theoretically, as the interaction between the ligand and the protein increases, rotational diffusion of the ligand decreases, that results in increase in anisotropy [57]. In Figure 7 as the concentration of insulin increases, the anisotropy also increases rapidly in the initial part of the curve. Thus, in the beginning, the added protein was immediately bound to NK9. The increase in anisotropy became smaller and finally reached a plateau. The plateau reflects anisotropy of the saturated insulin NK9 complex. This experiment was carried out at two different temperatures (25uC and 37uC) to validate the binding of NK9 with insulin at higher temperature. Anisotropy experiment at 25uC shows the plateau beyond an insulin concentration of 4mM, which implies
almost 2:1 binding of NK9 to insulin. Whereas, anisotropy experiment at 37uC showed plateau beyond 2mM concentration of insulin implying almost 4:1 binding of NK9 to insulin. Binding curves were obtained with apparent Kd values of 2.2mM and 1.2mM for binding to insulin at 25uC and 37uC, respectively. Gibbs free energy change for this association process was found to be 232.2 and235.1 KJ.mol21 at 25uC and 37uC respectively. This observation clearly indicates that the rate of insulin-NK9 complex formation increases at elevated temperatures.
Figure 6. Intensity particle size distribution spectra of bovine insulin: (A) Absence and (B) Presence of 350mM NK9 (NK9 : insulin = 1:1).Each spectrum is an average of 36 scans. The figure shows the results of dynamic light scattering analysis as a function of incubation time. Panel C shows hydrodynamic radius of 350mM insulin, in presence and absence of NK9 at different times of incubation at fibrillation inducing environment. Filled square represents insulin and open circle represents insulin in presence of NK9. Each DLS measurement is an average of 36 scans and the error bar represents the standard deviation of those 36 measurements.
Identification of probable binding site of NK9 with insulin by STD NMR and cluster analysis
To obtain the structural insight of NK9-insulin complex, transferred NOESY experiment was performed (Figure S1). The peptide in absence and presence of insulin was predominantly characterized by intra residue and sequential NOEs between backbone proton and side chain proton resonances (Figure S1), clearly indicating that the peptide is highly flexible in solution state and does not adopt any folded conformation in presence of insulin. This result is in very good agreement with our CD data of NK9 in the context of insulin (Figure 3C). To understand the localization of NK9 in insulin we employed one dimensional proton STD NMR which is a powerful and very specific technique to identify the epitope of a ligand is in close proximity with the receptor [37]. Briefly, selective saturation to the receptor is transferred to the bound ligand via spin diffusion, without affecting the ligand signal alone. Therefore, from the difference spectrum (off resonance – on resonance) we obtain the distance information or the epitope of the ligand bound to the macromolecule. Excess of ligand compared to its receptor is used in the STD experiments to achieve effective magnetization transfer from the receptor to the ligand at its bound state (Figure 8). The strong STD effect was observed for the methyl groups of NK9 in presence of insulin (Figure 8B) but there was no STD effect in the absence of insulin (Figure 8C). Although it is difficult to pin point the aliphatic hydrophobic amino acid residue due to significant overlap of the methyl group signals, it could be from any or all of the residues from I2, V3, V5, L7 and V8 closely interacting with insulin. The I2cand CbHs of V3/V5/V8 of NK9 show moderate STD effects (Figure 8B). The CaHs of NK9 are very close in proximity to the water signal. Interestingly, the CaH of S6 and L7 showed very weak STD signals (Figure 8B). Taken together, STD data qualitatively suggest a close association of hydrophobic amino acid residues with insulin (Figure 8B).
Molecular modeling is used to get structural insights of insulin-NK9 complex. Figure 8D shows the docked model, where insulin-NK9 is found to be in close proximity within the molecular patch between N-ter and helical portion of chain B. The key residues of insulin found to be involved in contact with NK9 are PheB1, ValB2, GlnB3, LeuB6, HisB10 and LeuB17. In contrast, only the few residues of
chain A, namely LeuA13, TyrA14and GluA17showed proximity to the residues of NK9. The docking model is in very good agreement with the STD NMR result, where all the methyl groups, I2, V3, V5 and L7 of NK9 are in hydrophobic groove, formed by the aliphatic residues of chain A and chain B of insulin. The N1 residue of NK9 is close to HisB5, suggesting formation of salt bridges or hydrogen bond. The model also suggests interaction between N4 of NK9 and GlnB3 of insulin by either hydrogen bond or salt bridges and hydrogen bond between K9 of NK9 and TyrA14of insulin. Probable fibrillation site of insulin and insulin NK9 complex was also identified using BioLuminate software (Figure S2).
Interaction within insulin-NK9 complex in explicit conditions; trajectory analysis
The physical behavior of the peptide (NK9) with macro-molecule (insulin) during the 100 ns MD simulation was accessed by Root Mean Squared deviation (RMSD), Radius of Gyration (Rg), Root Mean Square fluctuations (RMSF) and Principal Component Analysis (PCA).
Figure 9A shows all-atom RMSD for individual chains of insulin and NK9. The dynamicity of the complex seems to be stable and unaltered even after 20 ns. The N-terminus of the chain B enforces a wide range of dynamicity. The docked model designates the location of NK9 binding just in between the N-ter and helical region of chain A. The fluctuation in chain B is tuned and regulated by NK9, restricting the fibril formation. The RMSD plot for chain A is found to be unaffected in the simulation course. There is no observation regarding the loss of secondary structure in any chain of insulin that corresponds to the stability of whole structure. The Rg as shown in Figure 9B, correlates nicely with the RMSD data points. The minute increase in Rg is genuine and can be attributed to the absence of crystal packing in the micro-canonical ensemble of simulation, but the large increment can be correlated to the interaction with NK9. The disulfide bridges of insulin are found to be well conserved at low pH simulation, indicating one of the reasons for the stability regarding rms deviation and gyration radius of chain A. The results discussed for RMSD and Rg plot can be more clearly explained with the help of RMSF fluctuations for both chain A and B (Figure 9C). The fluctuation with respect to the Ca atoms of chain A residues are small except for TyrA14, which is found to be in contact with Lys9 of NK9. The observed mean fluctuation of 2.5 A˚ is attributed to cation-ptype interaction between these two residues. The RMSF for chain B shows a major fluctuation corresponding to LysB29and AlaB30residues which are in the N-terminal region.
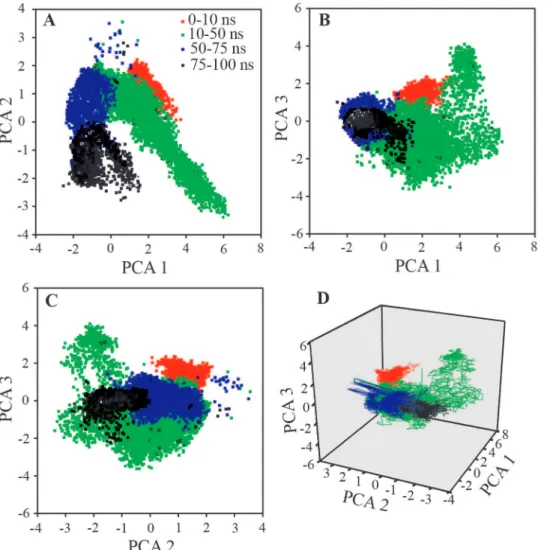
PCA is one of the important tools to describe the stochastic movement of macromolecular system. All the conformations sampled for simulation, were analyzed in terms of linear relationships between atomic motions using the first three prime eigenvectors. The correlation scatter plots link the motions of ‘related’ fluctuations with those of ‘total’ fluctuations in the system, and are directly related to their biophysical properties. Figure 10 shows the projections of first three principal components. All scatter data-points were categorized by color codes to give an approximation of the path followed by insulin-NK9 complex in the simulation time course. The scatter point corresponding to 10– 50 ns shows the time portion of simulation where the complex adopted many of the conformational changes for finding favorable interaction between chain B and NK9. Interestingly, the atomic fluctuations seem to have converged in the next phase of analysis (50–75 ns) and were almost conserved as for global minima in the phase 75–100 ns. PCA helps to concluding that the structural Figure 7. Fluorescence anisotropy titration of insulin.
conformations as obtained beyond 75 ns is more close to stable conformation at low pH conditions.
REMD simulation gives certain insight based upon the temperature platform. The replicas, which actually mimic the amyloid form, are checked at low pH 2.0 and at the temperatures 330 K and 335 K. The trajectories were found to be stable for chain B. Interestingly, the replica exchange study confirms that the conformational switch based on temperature variation does not cross the energy barrier to reach the form defined as amyloid plaque. This is the reason the replicas do not show disordered deviation plots (Figure S3).
In vitrohemolysis and cytotoxicity assay of NK9 peptide
In vitro hemolysis assay evaluates hemoglobin release in the
plasma as an indicator of red blood cell lysis following exposure to the drug or agent under consideration. It is an accurate and sensitive method for predicting hemolytic activity of a drug. The study of hemolytic activity of NK9 peptide showed less than 0.5% hemolysis for the various concentrations of peptide assayed up to a final concentration of 250mM (Figure 11). Percentage hemolysis
was measured with respect to 1% Triton X 100 sample taken as a control, which was considered to exhibit 100% hemolysis. The experiment was conducted in three biological replicates and similar results were obtained in each case. Cytotoxicity assay of NK9 peptide on HT1080 cell line was also performed for an analysis of its effects on live cells post treatment. No significant (less than 5%) cytotoxicity was observed towards HT1080 cell line for the different concentrations being tested going up to a final
concentration of 50mM. 0.5% Triton X 100 was used as a control, which exhibited only 20% viability. Cytotoxicity was measured by calculating the percentage of viable cells at each concentration of NK9 peptide relative to the control sample without peptide, which was considered to have 100% viability. The experiment was repeated in 4 replicates and yielded similar results. These data clearly indicate that the peptide, NK9 is non-toxic and the lead compound(s) from this peptide sequence can pave way to develop of new generation anti-diabetic drugs.
Materials and Methods
The protein, insulin and pure peptide, NK9 studied in this project were purchased from Sigma (St. Louis, MO) and GL Biochem (Shanghai, China), respectively. The molecular weight of the peptide was confirmed by ESI mass spectrometry.
Human samples
Human blood from healthy volunteers was collected using approved protocol from the Human Ethics committee, Bose Institute, Kolkata. Blood was drawn by experienced clinical technician after obtaining written consent from the volunteers and the hemolytic assay was performed with prior approval of the protocol from the said committee.
Preparation of samples
Bovine insulin was dissolved in 50 mM citrate phosphate buffer of pH 2.6. The concentration of sample solution was determined Figure 8. STD NMR Spectrum.(A) Reference spectrum of NK9 in presence of insulin at a molar ratio of insulin:NK9 = 1:100. (B) STD NMR spectrum of same sample showing the resonance transfer within the binding epitope of insulin. The experiments were performed at 298 K with 2 sec of saturation time (on resonance = 7.3 ppm; off resonance = 40 ppm). (C) STD spectrum of NK9 alone (on resonance = 7.3 ppm; off resonance = 40 ppm). (D) The docking model of insulin-NK9 complex correlated of the STD NMR data.
by measuring the absorbance at 276 nm using extinction co-efficient of insulin as 0.91 (mg/ml) 21.cm21 [56]. The buffer solutions were degassed for 15 min with vigorous stirring and filtering through 0.22mm disk membrane immediately before use. The degassing process was done with an objective to avoid any interference of dust and micro bubbles in the experiments. Thioflavin T (ThT) was dissolved in mili Q water and its concentration was determined from its absorbance at 412 nm using the molar extinction co-efficient of 36,000 M21cm21[57].
Kinetics of fibrillation process
ThT fluorescence of each sample was monitored in 2 mm path length cuvette incubating at 62uC temperature in Hitachi F 4500 spectrofluorometer. Excitation and emission wavelengths were set
for measurement as 450 nm and 485 nm, respectively. Insulin concentration in the cuvette was 2 mg/ml and that of ThT was 25mM. In order to have reproducibility of results, all the ThT date are average of three measurements. The kinetic profile was analyzed by curve fitting into Boltzmann equation (a sigmoidal function) using Origin software v.6.0.
Analysis of secondary structure of insulin during different stages of fibrillation by CD spectroscopy
The far-UV CD spectrum was recorded at 25uC for wavelength range of 200–250 ns on a JASCO-810 Spectropolarimeter using a rectangular cell of 1 mm path length. Insulin solution (2 mg.ml21) at pH 2.6 was incubated in a water bath at 62uC. Aliquots of insulin solution were taken out at different time of incubation and diluted to 0.3 mg.ml21. To eliminate contributions of NK9 in the Insulin NK9 mix system, NK9 also was separately incubated and aliquots were taken out at different time instants of incubation to measure the CD spectra and then subtracted with the Insulin NK9 CD spectra at respective time points. A buffer spectrum was also subtracted with each spectrum to eliminate contribution of the contributions of buffer. The CD results were expressed in terms of Mean Residue Ellipticity (MRE).
Monitoring of secondary structure of insulin during fibrillation by FT-IR spectroscopy
For FT-IR measurement, incubated insulin solution (50ml) was taken in microcon filter device fitted with a 3-kDa cut-off membrane and diluted with,200ml heavy water (D2O) of pD 2.6. The sample was centrifuged at 40006g for 8 to 10 min to bring the volume down to ,50ml. It was further diluted with ,200ml D2O and centrifuged again. This deuterium exchange process was repeated for 3–4 times. Finally, the D2O exchanged insulin (solution/suspension, 15ml) was placed between two CaF2 windows separated by a 50mm thick teflon spacer. FT-IR scans were collected in the range of 1600–1700 cm21at a resolution of 2 cm21using a Spectrum 100 FT-IR spectrometer (Perkin Elmer). Spectrum of D2O at pD 2.6 was collected and subtracted from each sample spectrum. Fourier self-deconvolution was used to resolve overlapping bands in the FT-IR spectrum. Curve fitting of the original amide I contours was performed using Microcal Origin 6.0 multi peak fit programme. Assignment of amide I bands were done according to the literature data [58]. The percentage of each secondary structure was computed to be the fractional area of the corresponding peaks, divided by the sum of the areas of all the peaks in amide I band. Curve fitting of FT-IR data was done with the help of origin 6.0 software using multi curve fit programme.
Transmission Electron Microscopy (TEM)
Imaging of fibril samples was done by using a transmission electron microscope (Technai G2 sprit BioTWIN, FEI) with an acceleration voltage of 80 kV. Aliquots (10ml) of insulin solution were placed on the copper grid coated with carbon film (300 meshes, Agar Scientific, Stansted, UK). After 30 s, two drops containing 10ml of 2% uranyl acetate (Agar Scientific) were placed on the grid. The excess water was removed carefully with filter paper and the grid was left to dry in air.
Measurement of hydrodynamics radius (RM) of insulin oligomers by DLS
The stock insulin solution was filtered through 0.2mm disk membrane and then diluted to a final concentration of 2.0 mg/ml. The experiments were performed at pre-adjusted temperature of Figure 9. A 100 ns MD simulation results for insulin-NK9
complex. (A) RMSD plot for chain A and B of insulin and NK9. (B) Radius of gyration for chain A and B of insulin. (C) Root mean square fluctuation of individual residues corresponding to chain A and B of insulin. Various color codes are used to distinguish each chain in the plot.
62˚C, at which fibrillation took place over a time period of 4 h. Size of the insulin in the early stages of the fibrillation were measured by dynamic light scattering (DLS) employing a Zetasizer Nano S (Malvern Instruments). DLS technique measures the time dependent fluctuation in the intensity of scattered light that occurs because of the motion of the particles. The analysis of these fluctuations enables the determination of the translational diffusion coefficients (D) of particles, which can be transformed to a size distribution. The value of D is obtained from the fitting of the experimental values of the time correlation function g2(t) according to the Equation 1.
g2(t)~A½1zB exp(2Dq2t) ð1Þ
where,tis the time, A is the baseline of the correlation function, B is the intercept of the correlation function, q = (4 n/l) sin (h/2)] is the scattering vector, n is the refractive index of the solution,lis the wavelength of the laser, andhis the scattering angle. A 4-mW He–Ne laser (633 nm) with a fixed detector angle ofh= 173uwas used. The time-dependent autocorrelation function was acquired every 60 s, with ten acquisitions for each run. Each data is an average of three such acquisitions.
Size exclusion chromatography
Size exclusion chromatography was performed using TSKgel SuperSW2000 column from Tosoh. The column was run on a waters 1525 HPLC system at a flow rate of 0.35 ml.min21with dual mode detection at 280 and 220 nm. The column was equilibrated with 25 mM citrate phosphate buffer to obtain a stable base line. After that 20ml of 2.0 mg/ml insulin solutions at different incubation times was first centrifuged and then superna-tant of the solution was loaded on the column to see the association state of insulin in presence and absence of NK9. Markers such as: b amylase, ADH, BSA, carbonic anhydrase, lysozyme and ribonuclease were run in 25 mM phosphate buffer pH 7.2. However, these proteins retain their globular shape at low pH condition, which was confirmed by BSA and lysozyme. Both BSA and lysozyme maintained their retention volume at pH 2.6 (data not shown).
Fluorescence anisotropy measurement
Steady-state anisotropy was recorded with a Hitachi model F-4500 spectrofluorometer equipped with a polarization accessory. Excitation of FITC labeled NK9 was done at 453 nm. The fluorescence anisotropy (A) values were obtained using the expression as of Equation 2.
Figure 10. Principal component analysis (PCA) considering the essential dynamics of prime three eigenvectors viz. PCA1, PCA2 and PCA3.
A~(IVVG|IVH)=(IVVz2|G|IVH) ð2Þ
where, IVVand IVHare the vertically and horizontally polarized components of probe (emission wavelength 526 nm) with excita-tion by vertically polarized light at 453 nm. G is the sensitivity factor of the instrument. The excitation and emission slits were set to 5 nm. The FITC tagged NK9 concentration was 10mM, whereas insulin concentration was varied between 0.5 to 8mM. The curve data were fitted using one site binding model of SigmaPlot software v.10.0. according to the Equation 3.
y~Bmax|fx=ðKdzxÞg ð3Þ
where, Bmax is the maximum value of anisotropy during the binding process and Kdis the dissociation constant of insulin NK9 complex. These experiments were carried out at 25uC and 37uC temperatures.
NMR experiments
All NMR spectra were recorded on a BRUKER AVANCE III 500 spectrometer, equipped with pulse field gradients. Data acquisition and processing were performed with Topspin software suite (BRUKER). Two-dimensional TOCSY and NOESY spectra of NK9 were acquired in buffer solutions containing 10% D2O at pH 2.6 with a peptide concentration of 1 mM. The mixing times for TOCSY and NOESY experiments were set to 80 ms and 400 ms, respectively at 298 K using DSS (2,2- Dimethyl-2-silapentane-5-sulfonate sodium salt) as an internal chemical shift reference. A series of one-dimensional proton NMR spectra were acquired by stepwise additions of various concentrations of insulin from a stock solution of 1 mM. The peptides/insulin complexes were carefully monitored. Two-dimensional transferred NOESY (trNOESY) experiments were carried out at a Peptides/insulin
molar ratio of 12:1 at 298 K. Three different NOESY mixing times; 100, 150 and 200 ms were recorded with 456 increments in
t1 and 2 K data points in t2. The spectral width was normally 12 ppm in both dimensions. After 16 dummy scans, 120 scans were recorded per t1 increment. After zero filling in t1, 4K (t2) 61K (t1) data matrices were obtained. NMR data analysis were carried out using the program SPARKY (T. D. Goddard and D. G. Kneller, University of California, San Francisco).
For saturation transfer difference (STD) NMR experiments, insulin and NK9 were dissolved in a buffer containing 99.9% D2O and lyophilized for at least three times. The pH was adjusted to 2.6. The STD NMR experiments were recorded on a Bruker Avance III 500 spectrometer equipped at a temperature of 298 K. The STD-NMR spectra were obtained at a molar ratio of insulin:NK9 = 1:100 with 3 K scans and selective saturation of insulin resonances either at 20.5 or at 7.3 ppm (40 ppm for reference spectra) using a series of 40 Gaussian-shaped pulses (49 ms, 1 ms delay between pulses), for a total saturation time of 2 s. Subtraction was performed between off and on resonance spectra by phase cycling, leads to the difference spectrum that contains signals arising from the saturation transfer. It is noteworthy to mention that one-dimensional proton NMR spectrum of insulin showed broad lines at low pH (pH 2.6) and the corresponding STD NMR spectrum (on resonance either 20.5 or 7.3 ppm and off resonance 40 ppm) showed very successful saturation transfer across the protein (data not shown). On the other hand, the free peptide, NK9 do not show any STD effects saturating at the same frequency as the complex. Data processing was performed using TOPSPIN program suite.
Structure prediction of NK9
The starting structure of peptide NK9 for theoretical studies was built using tLeap module of amber. A short minimization was applied for clearing all the steric clashes in the linear starting structure using Amber99SB force field [59]. The coordinates of NK9 were then processed in Desmond MD system for further structure prediction. Simulated annealing (SA) protocol was applied in explicit solvent condition over NK9-peptide for Figure 11. Hemolytic and cytotoxity assay of NK9 peptide.(A) Percentage hemolysis of NK9 peptide on human red blood cells exhibiting less than 0.5% hemolysis for different concentrations (25, 50, 100, 150, 200 and 250mM) of peptide been tested. Blank corresponds to untreated red blood cells (without peptide). The positive control for this experiment was 1% Triton X 100. (B) Percentage viability of HT1080 cells upon treatment with varying concentrations (5, 10, 25 and 50mM) of NK9 peptide showing less than 5% cytotoxicity in each case, against untreated cells taken as blank. The positive control for this experiment was 0.5% Triton X 100.
obtaining structural ensembles. The various temperature scales defined in SA are: 10 K–30 ps:100 K–100 ps:300 K–200 ps:400 K– 300 ps:400 K–500 ps:300 K–1000 ps. The frames are saved at an interval of 4.8 ps. Python script, ‘‘Clustering of Conformers’’ (Schro¨dinger, LLC) was used for analysis. The clustering of conformers was done based on the atom-positional root-mean-square difference (RMSDifference).
Docking studies
Coordinates of insulin heterodimer was obtained from Protein Data Bank (2zp6.pdb). The crystal structure was processed in Protein Preparation Wizard, for rectifying any problem in bond order, overlapping atoms and missing atoms. The water molecules in the crystal structure were kept with an objective that they might show important favorable interactions in subsequent theoretical studies. The macromolecule was further optimized by an iterative process for H-bonding network by re-orienting hydroxyl groups, amide groups of Asn and Gln and choosing appropriate states and orientation of imidazole ring of His residues. The protein was energy minimized before it was processed for docking. Docking protocol as implemented in PatchDock [60] (http://bioinfo 3d.cs.tau.ac.il/PatchDock/) was utilized to search possible binding orientation of peptide over insulin. Validation of docked structure was confirmed using STD-NMR. Two interacting models which were in good agreement with STD NMR data were adopted for further MD simulation studies in explicit solvent condition.
Molecular dynamics (MD) simulation studies
All the simulation studies have been carried out with Amber ff99SB force field in Desmond [61]. The preparation of interacting complex of insulin-NK9 was done at low pH conditions (pH 2.0). Thus, appropriate atomic protonation states were preserved for the micro-canonical system under the force-fields. The macomolecular complex was solvated with 10 A˚ boundaries from edge in orthorhombic boundary conditions, using TIP3P water models and neutralized with appropriate counter ions [62]. The system was first subjected first to energy minimization with 4000 steps of steepest descent and then to the default relaxation protocol, as present in Desmond MD system. To understand the mechanism of fibrillation delay of insulin by NK9 and to get the structural insight of interactions, MD simulation was performed upto 100 ns time period. NPT ensemble was chosen as micro-canonical system for the biomolecular simulation, with 1 bar pressure and constant temperature of 300 K, controlled using a relaxation time of 1 ps. Electrostatic forces were computed by using Gaussian Split Ewald method [63]. RESPA integrator was used with a 6 fs time step for long-range Coulomb interactions and 2 fs time step for all remaining interactions [64]. M-SHAKE algorithm was used to constraint the bond lengths to hydrogen [65]. The real-space part of the electrostatic and Lennard-Jones interactions was cut off at 10A˚ . The trajectories were saved at an interval of 5 ps for analysis.
Principal component analysis (PCA)
Principal component analysis (PCA), which is also known as essential dynamics, is a valuable tool to extract and large-scale correlated atomic motions of a system from simulation trajectory. PCA provides an opportunity to estimate the dominant mode of structural motion and thus the molecular motions can be judged on the basis of either instability or stability. All the data points for PCA analysis were extracted from simulation trajectory using GROMACS program [66]. Trajectory of Desmond simulation was converted into GROMACS format by using VMD. The
eigenvector contributed by all atoms; corresponding to collective motion, were extracted using g_anaeig program. The time evolution of collective coordinates for protein backbone (insulin-NK9 complex) during simulation were projected and analyzed.
Replica exchange molecular simulation (REMD)
We have tried to explore the forms of interactions in the insulin-NK9 complex with the aid of scaling of REMD values for the complex over the period of 8 ns tuning the system temperature. A total of sixteen replicas were run under umbrella sampling as to simulate the insulin-NK9 complex over temperature landscape, viz. 310, 315, 320, 325, 330, 335, 340, 345, 350, 355, 360, 365, 370, 375, 385 and 395 K. The solvation dimensions and ensemble parameters were set similar to the explicit MD simulation studies.
Aggregation site prediction
The probable prone for the aggregation was predicted using BioLuminate suite [67]. Insulin and complex models from simulation snapshots acquired the appropriate protonation state (pH,2.0). The parameters for aggregation site prediction were set to 1.0 A˚ for surface grid spacing, 1.8 A˚ for probe radius to be used over the van der Waals surface in order to create Connolly surface, 4 A˚ as cutoff radius for finding hydrophobic neighbors, 1.5 A˚2as to specify maximum solvent-accessible surface area for a residue to be regarded as buried.
Hemolytic assay
Fresh human blood was centrifuged at 40006g for 10 min and the cell pellet was washed thrice and re-suspended in 10 mM PBS at pH 7.4 to obtain a final concentration of 16109 erythrocytes/ ml. Equal volumes of erythrocytes were incubated with varying concentrations of NK9 peptide with shaking at 37uC for 1 hr. Samples were then subjected to centrifugation at 3500 g for 10 min at 4uC. RBC lysis was measured at different peptide concentrations by taking absorbance at an OD of 540 nm. Complete hemolysis (100%) was determined using 1% Triton X 100 as a control. Hemolytic activity of the NK9 peptide was calculated in percentage using the following Equation 4.
H~100| OpOb
OmOb
ð Þ ð4Þ
where, Opis the optical density of given peptide concentration, Ob is the optical density of buffer and Om is the optical density of Triton X 100.
In vitrocytotoxicity assay
Cell line used in this experiment was HT1080, a human fibro sarcoma cell line obtained from ATCC. Cells were maintained in Dulbecco’s modified Eagle’s medium (DMEM) containing Peni-cillin, Streptomycin, Gentamycin and Amphotericin B. For setting up a microwell culture, cells from a frozen stock were spread on a 100 mm dish in DMEM and incubated for 24 hr at 37uC, 5% CO2, 100% relative humidity. Cells were then brought into suspension with 0.02% Trypsin, washed with phosphate buffered saline and re-suspended in DMEM. Samples of cell suspension (500ml) were plated on to 24 well plates at an initial confluency of
30% and grown till it reached 40 to 50%. Varying concentration of peptide was added going up to a maximum concentration of 50mM and incubated at 37uC, 5% CO2for 44 hr. Cell number was determined by staining cells with addition of 100ml of
and air dried. The plates were scanned at 620 nm on a Thermo Scientific Varioskan Flash multimode micro plate reader. An average of 50 absorbance readings taken at different points on each well was measured. Percentage viability of cells was calculated using Equation 5.
Percentage viability~
½O:D of treated cells=O:D of untreated control cells|100ð5Þ
Conclusions
In this work, we have developed a nine residue biocompatible peptide, NK9 that is found to interrupt the insulin fibrillation process. Using Thioflavin T fluorescence, we observed that NK9 delays the fibrillation process of insulin in a dose dependent manner. In situ, addition of NK9 into the incubating insulin
solution decreases the rate of fibrillation process by slowing down the nucleation process, even at a sub-molar ratio. The insulin fibrils formed in presence of NK9 are morphologically different from those formed in its absence. NK9 is found to stabilize native-like secondary structure of insulin thus delaying its dissociation into monomer, which is a precursor for the fibril nucleus. NK9 does interfere with the nucleation process. Fluorescence anisotropy measurement confirms binding of NK9 with insulin with micro-molar affinity and the free energy of binding decreased with increase in temperature indicating hydrophobic nature of the interactions. STD NMR revealed that CcHs of I2, CbHs of V3, V5 and V8 residues of NK9 are in close proximity to insulin. MD simulation results are in agreement with the binding behavior of insulin with NK9. For the insulin-NK9 complex, aggregation site was found to be LeuA13and LeuA16. As per the docked model and simulation trajectory, NK9 was found to be in close proximity of LeuA13, TyrA14and GluA17. Simulation result indicates that only a few hydrophobic residues of NK9 prevent the solvent perturbation influencing insulin fibrillation. Probable fibrillation site of insulin was also identified using BioLuminate software. Such study may provide clue to develop next generation peptides and other organic therapeutics that can be tuned to prevent protein fibrillation.
Supporting Information
Figure S1 Spectral assignment (trNOESY spectrum) and sequential walk of NK9 bound to insulin.
(TIF)
Figure S2 Prediction of probable aggregation site; using BioLuminate for (A) insulin, (B) insulin-NK9 starting complex, (C) NK9 complex at 25 ns, (D) insulin-NK9 complex at 50 ns, (E) insulin-insulin-NK9 complex at 75 ns, (F) insulin-NK9 complex at 100 ns.
(TIF)
Figure S3 Replica Exchange Molecular Dynamics (REMD) run over insulin-NK9 complex for a time scale of 8ns.(A and C) RMSD plot for chain A, chain B of insulin and NK9 from 5th replica (330 K) and 6th replica (335 K). (B and D) Temperature variation plots for the trajectories of 5th and 6th replica. (E) Overview of 16 replicas for insulin-NK9 complex which shows the exchange of replicas over the temperature platform in the simulation time course.
(TIF)
Supporting Information S1 Supporting Information. (DOC)
Table S1 Kinetic parameters of insulin fibrillation. (DOC)
Acknowledgments
The Central Instrument Facility (CIF) of Bose Institute is greatly acknowledged for providing all the instrument facilities. KPD and AB would like to thank Professor Swati Gupta Bhattacharya, Bose Institute for providing the laboratory facilities to perform the hemolytic assay experiments in her laboratory. SC would like to thank Department of Science and Technology, the Government of India for the Ramanujan Fellowship. VB like to thank Mr. Dipak Chandra Konar of Chemistry Department for his technical assistance. AD thanks CSIR, Govt. of India for JRF. We thank Professor Rajagopal Chattopadhyaya, Bose Institute, Kolkata for critical reading of the manuscript.
Author Contributions
Conceived and designed the experiments: VB RKK AD AB SC KPD. Performed the experiments: VB RKK AD AB KP. Analyzed the data: VB RKK AD AB KPD. Contributed reagents/materials/analysis tools: AB SC KPD. Wrote the paper: VB RKK AD AB SC KPD.
References
1. Morris AM, Watzky MA, Finke RG (2009) Protein aggregation kinetics, mechanism, and curve-fitting: A review of the literature. Biochem. Biophys. Acta. 1794: 375–397.
2. Chiti F, Dobson CM (2006) Protein misfolding, functional amyloid, and human disease. Annu. Rev. Biochem. 75: 333–366.
3. Sipe JD, Cohen AS (2000) Review: History of the amyloid fibril. J. Struct. Biol. 130: 88–98.
4. McLaurin J, Yang DS, Yip CM, Fraser PE (2000) Review: Modulating factors in Amyloid-bfibril formation. J. Struct. Biol. 2000. 130: 259–270.
5. Uversky VN (2008) Amyloidogenesis of natively unfolded proteins. Curr. Alzheimer Res. 5: 260–287.
6. Alvarado MR, Merkel JS, Regan L (2000) A systematic exploration of the influence of the protein stability on amyloid fibril formation in vitro. Proc. Natl. Aca. Sci.USA 97: 8979–8984.
7. Sunde M, Serpell LC, Bartlam M, Fraser PE, Pepys MB, et al. (1997) Common core structure of amyloid fibrils by synchrotron X-ray diffraction. J. Mol. Biol. 273: 729–739.
8. Nelson R, Sawaya MR, Balbirnie M, Madsen AØ, Riekel C, et al. (2005) Structure of the cross-beta spine of amyloid-like fibrils. Nature 435: 773–778. 9. Chang X, Jorgensen AM, Bardrum P, Led JJ (1997) Solution structures of the
R6 human insulin hexamer. Biochemistry 36: 9409–9422.
10. Brange J, Andersen L, Laursen ED, Meyn G, Rasmussen E (1997) Toward understanding insulin fibrillation. J. Pharm. Sc. 86: 517–525.
11. Ahmad A, Millett IS, Doniach S, Uversky VN, Fink AL (2003) Partially folded intermediates in insulin fibrillation. Biochemistry 42: 11404–11416.
12. Ahmad A, Uversky VN, Hong D, Fink AL (2005) Early events in the fibrillation of monomeric insulin. J. Biol. Chem. 280: 42669–42675.
13. Yumlu S, Barany R, Eriksson M, Rocken C (2009) Localized insulin-derived amyloidosis in patients with diabetes mellitus: a case report. Hum Pathol. 40:1655–1660.
14. Shikama Y, Kitazawa J, Yaqihashi N, Uehara O, Murata Y, et al. (2010) Localized amyloidosis at the site of repeated insulin injection in a diabetic patient. Intern Med. 49:397–401.
15. Dische FE, Wernstedt C, Westermark GT, Westermark P, Pepys MB, et al. (1988) Insulin as an amyloid-fibril protein at sites of repeated insulin injections in a diabetic patient. Diabetologia 31:158–161.
16. Pekar AH, Frank BH (1972) Conformation of proinsulin. A comparison of insulin and proinsulin self-association at neutral pH. Biochemistry 11: 4013– 4016.
17. Bucciantini M, Giannoni E, Chiti F, Baroni F, Formigli L, et al. (2002) Inherent toxicity of aggregates implies a common mechanism for protein misfolding diseases. Nature 416:507–511.
19. Lambert MP, Barlow AK, Chromy BA, Edwards C, Freed R, et al. (1998) Diffuson, nonfibrillar ligands derived from Abeta1-42 are potent central nervous system neurotoxins. Proc Natl Acad Sci 95:6448–6453.
20. Ha¨rd T, Lendel C (2012) Inhibition of amyloid formation. J. Mol. Biol. 421: 441–65.
21. Sciarretta KL, Gordon DJ, Meredith SC (2006) Peptide-based inhibitors of amyloid assembly. Methods Enzymol. 413: 273–312.
22. Brange J, Dodson GG, Edwards DJ, Holden PH, Whittingham JL (1997) A model of insulin fibrils derived from the x-ray crystal structure of a monomeric insulin (despentapeptide insulin). Proteins 27: 507–516.
23. Banerjee V, Das KP (2012) Modulation of pathway of insulin fibrillation by a small molecule helix inducer 2,2,2-trifluoroethanol. Colloids and Surf. B: Biointerfaces 92: 142–150.
24. Snijder EJ, Bredenbeek PJ, Dobbe JC, Thiel V, Ziebuhr J, et al. (2003) Unique and conserved features of genome and proteome of SARS-coronavirus, an early split-off from the coronavirus group 2 lineage. J. Mol. Biol. 331: 991–1004. 25. Tan Z, Shang S, Danishefsky SJ (2011) Rational development of a strategy for
modifying the aggregatibility of proteins. Proc. Natl. Acad. Sci. USA 108: 4297– 4302.
26. Zhou A, Stein PE, Huntington JA, Sivasothy P, Lomas DA, et al. (2004) How small peptides block and reverse serpin polymerisation. J. Mol. Biol. 342: 931– 941.
27. Chalifour RJ, McLaughlin RW, Lavoie L, Morissette C, Tremblay N, et al. (2005) Stereoselective interactions of peptide inhibitors with the beta-amyloid peptide. J. Biol. Chem. 278: 34874–34881.
28. Permanne B, Adessi C, Saborio GP, Fraga S, Frossard MJ, et al. (2002) Reduction of amyloid load and cerebral damage in a transgenic mouse model of Alzheimer’s disease by treatment with a beta-sheet breaker peptide. FASEB J. 16: 860–862.
29. Pochan DJ, Schneider JP, Kretsinger J, Ozbas B, Rajagopal K, et al. (2003) Thermally reversible hydrogels via intramolecular folding and consequent self-assembly of a de novo designed peptide. J. Am. Chem. Soc. 125: 11802–11803. 30. El-Agnaf OM, Paleologou KE, Greer B, Abogrein AM, King JE, et al. (2004) A strategy for designing inhibitors of alpha-synuclein aggregation and toxicity as a novel treatment for Parkinson’s disease and related disorders. FASEB J. 18: 1315–1317.
31. Hua QX, Weiss MA (2004) Mechanism of insulin fibrillation: the structure of insulin under amyloidogenic conditions resembles a protein-folding intermedi-ate. J. Biol. Chem. 279: 21449–21460.
32. Pastor MT, Esteras CA, Lo´pez PM (2005) Design of model systems for amyloid formation: lessons for prediction and inhibition. Curr. Opin. Struct. Biol. 15: 57–63.
33. Viet MH, Ngo ST, Lam NS, Li MS (2011) Inhibition of aggregation of amyloid peptides by beta-sheet breaker peptides and their binding affinity. J. Phys. Chem. B 115: 7433–7446.
34. Clore GM, Gronenborn AM (1982) Theory and applications of the transferred nuclear overhauser effect to the study of the conformations of small ligands bound to proteins J. Mag. Res. 48: 402–417.
35. Mayer M, Meyer B (1999) Characterization of ligand binding by saturation transfer difference NMR spectroscopy Angew. Chem. Int. Ed. 38: 1784–1788. 36. Bhunia A, Bhattacharjya S, Chatterjee S (2012) Applications of saturation transfer difference NMR in biological systems. Drug Discovery Today 17: 505– 513.
37. Brange J, Langkjaer L, Havelund S, Vølund A (1992) Chemical stability of insulin. 1. Hydrolytic degradation during storage of pharmaceutical prepara-tions. Pharm. Res. 9: 715–726.
38. Brange J, Havelund S, Hommel E, Sørensen E, Ku¨hl C (1986) Neutral insulin solutions physically stabilized by addition of Zn2+
. Diabetic Med. 3: 532–536. 39. (1982) US Pharmacopoeial Convention: Rockville, MD, pp. 96–105. 40. Katakam M, Banga AK (1995) Aggregation of insulin and its prevention by
carbohydrate excipients. PDA J. Pharm. Sc. Tech. 49: 160–165.
41. Blackshear PJ, Rohde TD, Palmer JL, Wigness BD, Rupp WM, et al. (1983) Glycerol prevents insulin precipitation and interruption of flow in an implantable insulin infusion pump. Diabetes Care 6: 387–392.
42. Grau U, Saudek CD (1987) Stable insulin preparation for implanted insulin pumps. Laboratory and animal trials. Diabetes 36: 1453–1459.
43. Thurow H, Geisen K (1984) Stabilisation of dissolved proteins against denaturation at hydrophobic interfaces. Diabetologia 27: 212–218.
44. Brewster ME, Hora MS, Simpkins JW, Bodor N (1991) Use of 2-hydroxypropyl-beta-cyclodextrin as a solubilizing and stabilizing excipient for protein drugs. Pharm. Res. 8: 792–795.
45. Rabiee A, Ebrahim A, Navidpour L, Morshedi D, Ghasemi A, et al. (2011) Benzofuranone derivatives as effective small molecules related to insulin amyloid fibrillation: a structure-function study. Chem. Biol. Drug Des. 78: 659–666. 46. Wang JB, Wang YM, Zeng CM (2011) Quercetin inhibits amyloid fibrillation of
bovine insulin and destabilizes preformed fibrils. Biochem. Biophys. Res. Comm. 415: 675–679.
47. Landreh M, Stukenborg JB, Willander H, So¨der O, Johansson J, et al. (2012) Proinsulin C-peptide interferes with insulin fibril formation. Biochem. Biophys. Res. Comm. 418: 489–493.
48. Ban T, Hamada D, Hasegawa K, Naiki H, Goto Y (2003) Direct observation of amyloid fibril growth monitored by thioflavin T fluorescence. J. Biol. Chem. 278: 16462–16465.
49. Pocker Y, Biswas SB (1980) Conformational dynamics of insulin in solution. Circular dichroic studies. Biochemistry 19: 5043–5049.
50. Dong A, Matsuura J, Allison SD, Chrisman E, Manning MC, et al. (1996) Infrared and circular dichroism spectroscopic characterization of structural differences between beta-lactoglobulin A and B. Biochemistry 35: 1450–1457. 51. Das KP, Choo LP, Petrash MJ, Surewicz WK (1999) Insight into the secondary
structure of non-native proteins bound to a molecular chaperone alpha-crystallin: an isotope edited infrared spectroscopic study. J. Biol. Chem. 274: 33209–33212.
52. Surewicz WK, Mantsch HH, Chapman D (1993) Determination of protein secondary structure by Fourier transform infrared spectroscopy: a critical assessment. Biochemistry 32: 389–394.
53. Banerjee V, Das KP (2013) Interaction of silver nanoparticles with proteins: A characteristic protein concentration dependent profile of SPR signal. Collods Surf B Biointerfaces 111:71–79.
54. Bouchard M, Zurdo J, Nettleton EJ, Dobson CM, Robinson CV (2000) Formation of insulin amyloid fibrils followed by FTIR simultaneously with CD and electron microscopy. Protein Science 9: 1960–1967.
55. Vestergaard B, Groenning M, Roessle M, Kastrup JS, van de Weert M, et al. (2007) A helical structural nucleus is the primary elongating unit of insulin amyloid fibrils. PLoS Biology 5: e134.
56. Nielsen L, Khurana R, Coats A, Frokjaer S, Brange J, et al. (2001) Effect of environmental factors on the kinetics of insulin fibril formation: elucidation of the molecular mechanism. Biochemistry 40: 6036–6046.
57. Wang S, Zhang C, Nordeen SK, Shapiro DJ (2007) In vitro fluorescence anisotropy analysis of the interaction of full-length SRC1a with estrogen receptors alpha and beta supports an active displacement model for coregulator utilization. J. Biol. Chem. 282: 2765–2775.
58. Wi S, Pancoska P, Keiderling TA (1998) Predictions of protein secondary structures using factor analysis on Fourier transform infrared spectra: effect of Fourier self-deconvolution of the amide I and amide II bands Biospectroscopy 4: 93–106.
59. Hornak V, Abel R, Okur A, Strockbine B, Roitberg A, et al. (2006) Comparison of multiple Amber force fields and development of improved protein backbone parameters. Proteins 65: 712–725.
60. Schneidman DD, Inbar Y, Nussinov R, Wolfson HJ (2005) PatchDock and SymmDock: servers for rigid and symmetric docking. Nucleic Acids Research 33: W363–W367.
61. Desmond Molecular Dynamics System, version 2.2 (2009) D. E. Shaw Research, New York, NY. Maestro-Desmond Interoperability Tools, version 2.2, (2009) Schro¨dinger, New York, NY.
62. Jorgensen WL, Chandrasekhar J, Madura JD, Impey RW, Klein ML (1983) Comparison of simple potential functions for simulating liquid water. J. Chem. Phys. 79: 926–935.
63. Shan Y, Klepeis JL, Eastwood MP, Dror RO, Shaw DE (2005) Gaussian split Ewald: A fast Ewald mesh method for molecular simulation. J. Chem. Phys. 122: 54101.
64. Tuckerman M, Berne BJ, Martyna GJ (1992) Reversible multiple time scale molecular dynamics. J. Chem. Phys. 97: 1990–2001.
65. Vincent K, Gunsteren WF, Hu¨nenberger PH (2001) A Fast SHAKE Algorithm to Solve Distance Constraint Equations for Small Molecules in Molecular Dynamics Simulations J. Comput. Chem. 22: 501–508.
66. Spoel DVD, Lindahl E, Hess B, Groenhof G, Mark AE, et al. (2005) GROMACS: Fast, flexible, and free. J. Comput. Chem. DOI: 10.1002/ jcc.20291.