Development of a Chirp Stimulus PC-Based Auditory
Brainstem Response Audiometer
Ali AL-Afsaa1,2 & Soegijardjo Soegijoko2
1
Homs Health Care Department; Homs-Syria. E-mail:[email protected]
2
Biomedical Engineering Program, Department of Electrical Engineering, Institut Teknologi Bandung. Jalan Ganesha 10, Bandung 40132, Indonesia. Phone/Fax
(62)-22-2534117; E-mail: [email protected].
Abstract. Hearing losses during infancy and childhood have many negative future effects and impacts on the child life and productivity. The earlier detection of hearing losses, the earlier medical intervention and then the greater benefit of remediation will be. During this research a PC-based audiometer is designed and, currently, the audiometer prototype is in its final development steps. It is based on the auditory brainstem response (ABR) method. Chirp stimuli instead of traditional click stimuli will be used to invoke the ABR signal. The stimulus is designed to synchronize the hair cells movement when it spreads out over the cochlea. In addition to the available hardware utilization (PC and PCI board), the efforts confined to design and implement a hardware prototype and to develop a software package that enables the system to behave as ABR audiometer. By using such a method and chirp stimulus, it is expected to be able to detect hearing impairment (sensorineural) in the first few days of the life and conduct hearing test at low frequency of stimulus. Currently, the intended chirp stimulus has been successfully generated and the implemented module is able to amplify a signal (on the order of ABR signal) to a recordable level. Moreover, a NI-DAQ data acquisition board has been chosen to implement the PC-prototype interface.
Keywords: ABR audiometer, audiometry, chirp stimulus, Hearing impairments, low frequency hearing test, PC-based audiometer, sensorineural disorder, Under-fives Hearing test.
1 Introduction
nervous system and can have harmful effects on social, emotional, cognitive, and academic development. Moreover, delayed identification and management of severe to profound hearing impairment may impede the child's ability to adapt his life in a hearing world or in the deaf community.
Audiometer is an equipment used to test the hearing system functionality and hearing acuity. ABR is one of several available methods to detect hearing dysfunctions. The ABR-based audiometers differ as the stimulus type they use differs. One or more of stimulus types (click, pure tone, pips, train pulse,.. etc) is used in available ABR audiometer. Different stimulus characteristics give different ABR audiometer hence each laboratory has its own specifications and characteristics and the manufacturers approve their product in comparison with behavioral method that is the traditional and most precise method for hearing impairment detection (Michael et, 1987; ANSI working group, 1998). Up to date, audiologists using available ABR audiometers are: first unable to detect hearing losses, disorders, and difficulties at frequency less than 1kHz. It is because they use audiometers based on click stimulus to invoke recordable ABR response. Second, they are unable to distinguish severe-profound hearing losses in the range of 85-95 dB HL (hearing level) from those in the more profound ranges of 100-120 dB HL, especially at 500 Hz. Third, they can conduct functional tests of the hearing system (normal or abnormal function) but not anatomy test (no indications to site of lesion). Chirp stimulus will be used throughout this research because it has already found that it can invoke ABR signal as good as the ABR signal of other kind of stimuli (Wegner, Dau and Kollmeier). Chirp stimulus is designed to synchronize the hair cells movement over the cochlea. It is in a way that forces the hearing cell to fire their electrical potential simultaneously. The acoustic stimuli stimulate the under test hearing system invoking ABR biopotenial. The standard EEG surface electrodes located on the scalp will pick up the acoustic evoked response. Then ABR will be conditioned and prepared analogically to fit the PC interface. The ABR data extraction and the advanced data process will be conducted by means of signal processing techniques.
as possible. It is to have the full remediation advantage of the developing sensory system and to prevent or minimize the adverse effects.
The previous hearing test experiment has been conducted by using MatLab software and the Creative SB-Live card as a data acquisition board. The experiment failed to extract and record ABR signal because of the control shortage over the invoked ABR of repeated stimulus. An NI-DAQ data acquisition board from National Instruments is currently the prototype-computer interface. To use NI-DAQ board properly, prototype modifications have been conducted. Hence this article discusses the result of the recent progress of the conducted experiments.
At the end of research, it is expected to be able to record ABR signal over the whole frequency range (250 to 8000Hz). The recorded ABR is expected to include information related to the whole activated sensory hair cell in the cochlea.
2
ABR Audiometers and Audiometry
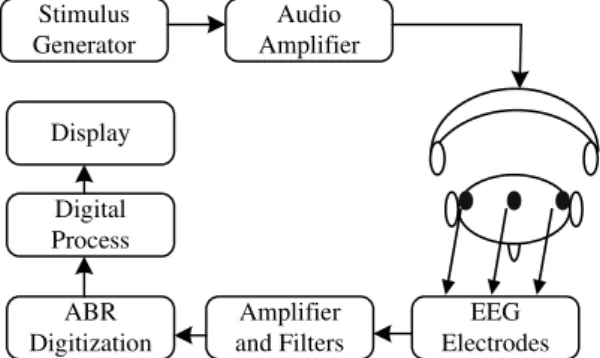
Audiometry is the process in which the audiologist conducts sensorineural hearing test by using an audiometer. Figure 1 shows a very simplified block diagram of ABR audiometer that works as follows. A stimulus generator generates audible stimuli of specific characteristics and repetition rate. An audio amplifier amplifies the generated stimuli to the level that produces user-selected loudness measured in decibel.
Audio Amplifier Stimulus
Generator
Amplifier and Filters ABR
Digitization
EEG Electrodes Digital
Process Display
Figure 1 A simplified general block diagram of ABR audiometer.
A headset fixed to the patient head delivers the audible stimuli to the ear under test. Each stimulus evokes its own ABR potential that appears on the scalp. Standard EEG surface electrodes located on the scalp pick up the invoked ABR signal. ABR signal on the scalp of 0.1-10μvpp amplitude and has frequency
1990). Picked up potentials are amplified, filtered, and conditioned analogically to attenuate environmental noise and the undesired biopotential components and enhance the required ABR signal. The signal is then digitized and processed digitally to extract ABR potential to be displayed and recorded.
3
Ear Anatomy and Hearing Mechanism
The ear can be divided, anatomically, into three parts they are: the outer, middle and inner ear. Very simply, the outer ear function is sound collection and localization. Its auditory canal ends at the tympanic membrane that changes the air pressure (sound) into mechanical vibration. The middle ear consists of three bones (malleus, incus and stapes) as shown in figure 2. It transmits the mechanical vibration of the tympanic membrane into the inner ear converting it into pressure wave in the fluid. The inner ear (cochlea) transduces sound vibrations in the fluid into electrical potential to be transmitted into the brain through the auditory nerve.
Malleus Incus
Hair Cells Oval Window
Stapes
Scala Tympani
Basilar Membrane Scala Vestibuli
Tectorial Membrane
Tympanic Membrane
Figure 2 A simple representation of the cochlear and sound wave path (from Department of Anatomy, Tutorial, 2000).
frequency-sensitivity, the cochlea can be divided into different regions; each is sensitive to a different frequency (E.Glassock, Jackson, and Forrest Josey, 1987).
4
Research Methodology
Auditory Brainstem Response (ABR) signal has a few micro volts amplitude, i.e.0.1 to 10μVp-p. It will be picked up on the scalp where there exist other biopotential activities. They form the background noise. They have frequency components that fall in the same range as ABR components, but have minimum amplitude of the same order and greater. The environmental noise (especially 50Hz of power lines) is the other source of noise. It has greater amplitude and may strongly interfere with acquired ABR signal.
In contrast to noise signals, ABR potential is time-locked because it appears as a result of stimulating the hearing system by an acoustic stimulus. Hence the averaging method becomes our reasonable choice to extract ABR signal from its background noise and to reduce the effect of other environmental noise signals that interfere randomly. ABR will be extracted by averaging 1000 stimulated ABRs at repetition rate of 2 stimuli per second. An analog high pass filter will effectively attenuate the 50 Hz noise and additional digital high pass filter will be to decrease the 50 Hz and its second and third harmonics.
Chirp stimulus characteristics will be designed to synchronize the hair cells movement leading to concurrent biopotentals that come from the all frequency-sensitive regions of cochlea. Simultaneous firing of biopotentials is based on the different travel-time of different frequencies through different liquids. This is going to increase the amplitude and the information contents of stimulated ABR and can be useful to get regional cochlear information.
5
System Design and Implementation
Figure 3 shows a block diagram of the implemented and under development system. It consists of Personal Computer, PCI Data Acquisition Board, and Amp&Control Circuit, Analog Process, and Power Supply (is not shown in the figure) modules. The PC uses a PCI data acquisition board (PCI 6024-E Ni-DAQ) to communicate with developed hardware.
d
*
*
*
He a*
El e c tr o d e s set Aud-Amp Left Ear Aud-Amp Reft Ear Control Circuit S/WAmp & control circuit PCI NI-DAQ Analog Output Object Digital I/O Object Analog Input Object
Analog process ( acquisition circuit ) High Pass Filter Fc=50Hz Final Circuit of Amplification Band Pass Filter Fc=0.2-3kHz Preamplifier CMR-Circuit
Figure 3 Block diagram of realized PC-based ABR Audiometer. The PCI NI-DAQ board is presented outside the PC for clarity purpose.
In addition to control command generation, chirp stimulus generation, and user interface windows, the MatLab software will be used to conduct the required signal processing techniques to extract ABR signal information and to display and print the results
6 Experimental
Results
The developed hardware prototype consists of three printed circuit boards (PCB). They are, as shown in figure 3, the acquisition circuit PCB, Aud-Amp & control circuit PCB, and power supply which not included in figure 3. The functionality of each circuit on those boards has been verified separately. Additional circuits, such as Trigger Circuit and Function Generator circuit (shown in figure 5), have been added for experimental purpose.
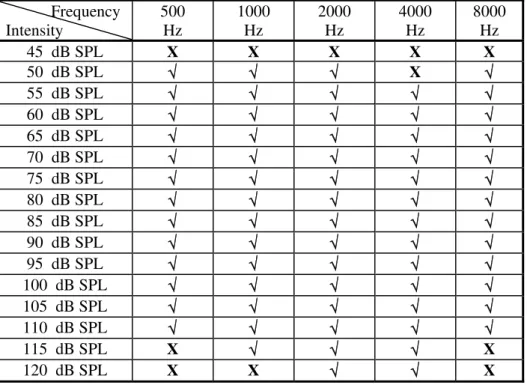
The control circuit has been designed an implemented to, automatically, apply the acoustic stimuli to the intended left/right ear and to select the suitable electrode set that picks up the stimulated response to be recorded. The audio amplifier module has been designed and implemented to be able to generate audible sine wave at frequencies 500Hz, 1kHz, 2 kHz, 4 kHz, and 8 kHz. At each frequency the audible intensity of 5 dB SPL increment step ranges between 55 dB SPL to 110 dB SPL. They are the required frequency and intensity values to conduct hearing tests. The laboratory experiment has been conducted in a sound shielded chamber by using the standard TDH-39P headset that is clinically used to conduct hearing test. A Sound level meter (SLM) provided with selective filter is used to measure the audible output of the headset. The chamber noise had been measured before calibration conduction was done. It has value in the range 45 and 47 dB SPL (sound pressure level). The SLM was fixed 2cm away in front of the active headset piece. The signal is software generated and applied through the NI-Daq board to the left/right Audio amplifier to be calibrated as shown in figure 3. The results of laboratory calibration for both audio amplifiers are listed in the table 1. The 50 dB SPL is the minimum intensity that could be produced at all required frequencies except at 4000 Hz where the minimum intensity is 55dB SPL. 110 dB SPL is the highest intensity can be produced at frequencies 500 and 8000Hz while 115 dB SPL is at 1000 Hz and 120 dB SPL at 2000 and 4000 Hz.
Frequency Intensity
500 Hz
1000 Hz
2000 Hz
4000 Hz
8000 Hz
45 dB SPL X X X X X
50 dB SPL √ √ √ X √
55 dB SPL √ √ √ √ √
60 dB SPL √ √ √ √ √
65 dB SPL √ √ √ √ √
70 dB SPL √ √ √ √ √
75 dB SPL √ √ √ √ √
80 dB SPL √ √ √ √ √
85 dB SPL √ √ √ √ √
90 dB SPL √ √ √ √ √
95 dB SPL √ √ √ √ √
100 dB SPL √ √ √ √ √
105 dB SPL √ √ √ √ √
110 dB SPL √ √ √ √ √
115 dB SPL X √ √ √ X
120 dB SPL X X √ √ X
Table 1 Intensity calibration result for both left and right audio amplifiers. The
√ sign means the intensity has been produced while X sign means the intensity cannot be reached.
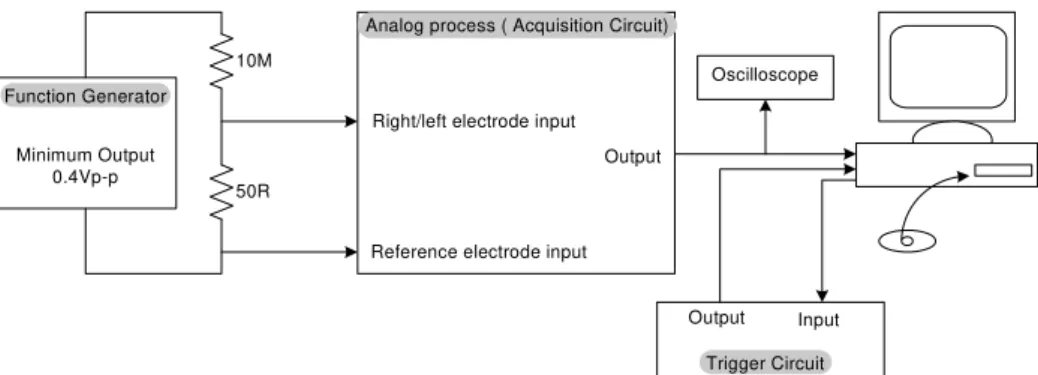
The second step has been conducted, on one side, to verify the Analog Process module ability to amplify signals of order of microvolts by using digital oscilloscope. On the other side it is to ascertain, experimentally, the whole system ability to function as audiometer before starting clinical experiments. To do it the laboratory test arrangement shown in figure 5 has been conducted. The measured output pure sine wave (on digital oscilloscope) of the function generator is minimum 200mVp-p. So the signal has to be attenuated by 100dB to be of 2 μVp-p (to be of same amplitude order as ABR). The experiments have been conducted in unshielded laboratory environment.
Figure 4 The measured response of filtration circuits. Horizontal axis is the frequency in Hz and vertical is the filter’s gain in dB.
10M
50R Function Generator
Minimum Output 0.4Vp-p
Analog process ( Acquisition Circuit)
Right/left electrode input
Reference electrode input Output
Oscilloscope
Trigger Circuit Output Input
Figure 5 Block diagram of the laboratory test arrangement. The PCI NI-DAQ is not presented separately because it is slotted into the PC.
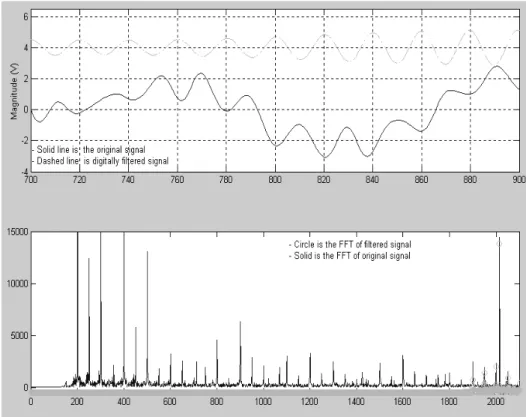
signal by 106 and also shows the low frequency noise effect and how the digital filtration enhances the intended signal.
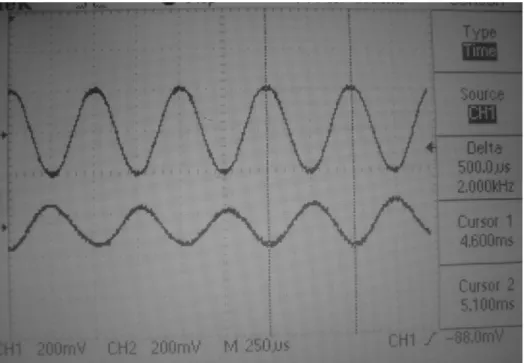
Figure 6 The test circuit input and the Analog Process module output on digital oscilloscope screen. The upper signal is measured at the voltage divider input that has output 10-6 times of its input. The lower signal is the Analog Process module output (200mV/Div). The same time axis (horizontal) is for both signals (250μs/Div).
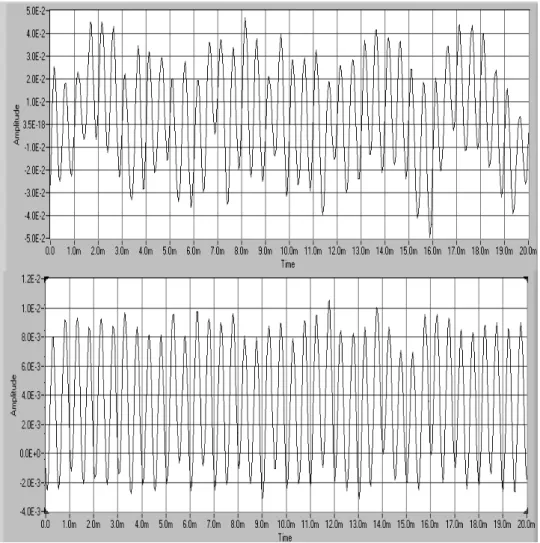
is a 400mVp-p and 2kHz (measured on a digital oscilloscope) at the voltage divider input, and will be around 2 μVp-p (calculated value) at the voltage divider output. The Analog Process module has been set to amplify its input signals by 25*10+3 before they are delivered to the analog input of the Data Acquisition board. The comparison of single picked up signal (figure 8) and the 100 averaged similar (to the single one) signals, clearly, shows that averaging enhanced the signal to noise ratio.
Figure 8 The attenuation effect of averaging method. The signal is acquired for 20ms at sampling rate 25kHz. The upper plot represents single generated and recorded signal. The lower signal represents the result of averaging 100 identical generated signals. The amplitude is measured in volts while the horizontal axis is the time in ms.
Figure 9 Chirp Stimulus. It contains frequencies of 250Hz up to 4000 Hz. Stimulus is generated at sampling rate of 40 kHz. The left plot represents fixed amplitude chirp signal and the right plot represents falling chirp stimulus of the same frequency contents. The vertical Axis is the amplitude in volt and the other is the time in the number of samples.
7
Final Remarks
1. The laboratory tests of Analog Process Module (figures 6,7) clearly reveal that any signal exists at the module input of 2 µV amplitude will be of 2V at the module output (10+6 time amplification). So our ABR biopotential that has amplitude of 0.1 to 10 µV will be recordable and of 0.1 to 10V amplitude at the module output.
2. Simulation of ABR invocation and extraction by using the averaging method revealed signal to noise enhancement as shown in figure 8. The noise is attenuated by around 20dB so there still exist 50 Hz harmonics effects.
3. The 50 Hz harmonics, especially the forth and fifth harmonics, are still have high effects in spite of good signal to noise ratio at the circuit input. This ratio is expected to be worse during clinical hearing test so there will be high necessity for advanced step of digital filtration.
4. The designed chirp stimulus that will be used to invoke the ABR bipotential is successfully generated.
5. Despite of communication flexibility the NI-DAQ board provides, there is still a necessity for additional circuit to improve the system functionality before conducting clinical experiments.
to record and extract ABR at low frequencies. ABR is expected to consist of important information related to the whole cochlear sensorineural elements.
8
References
1.
NIH Consens Statement Online, Early Identification of Hearing Impairment in Infants and Young Children (1993 Mar 1-3).2.
Michael E. Glassock III, M. D., F. A. C. S. & C. Gary Jackson, M. D., F.A.C.S. & Anne Forrest Josey, M. S., C. C. C. A., The ABR Handbook: Auditory Brainstem Response; second edition (1987).3. ANSI working group S3: 76 (published May 1.st 1998): Performance Measures of Micro-processor or Computer Controlled Pure-Tone Audiometers, www.dhsc.com/ WG76.HTM.
4. Oliver Wegner, Torsten Dau & Birger Kollmeier, On The Relationship Between Auditory Evoked Potentials And Psychophysical Loudness,
Arbeitsgruppe Medizinische Physik, Carl von Ossietzky Universitat Oldenburg, Germany. Wegner.doc submitted to World Scientific 21.02.99: 15:59 2/5.
5. Author: Department of Anatomy. Tutorial, Auditory Pathway: Copyright
(c) 2000 University of Bristol http://137.222.110.150/calnet/Aud/page2.htm.
6. Webster & John G. Medical, Instrumentation Application and Design, John willy & Sons-USA (1998).
7. Aston & Richard, Principles of Biomedical Instrumentation and Measurement, Merrill-USA (1990).