www.adv-geosci.net/27/65/2010/ doi:10.5194/adgeo-27-65-2010
© Author(s) 2010. CC Attribution 3.0 License.
Geosciences
Water footprint analysis for the assessment of milk production
in Brandenburg (Germany)
K. Drastig, A. Prochnow, S. Kraatz, H. Klauss, and M. Pl¨ochl
Leibniz-Institute for Agricultural Engineering Potsdam-Bornim, Potsdam, Germany
Received: 19 January 2010 – Revised: 26 April 2010 – Accepted: 13 May 2010 – Published: 7 September 2010
Abstract. The working group “Adaptation to Climate Change” at the Leibniz-Institute for Agricultural Engineer-ing Potsdam-Bornim (ATB) is introduced. This group calcu-lates the water footprint for agricultural processes and farms, distinguished into green water footprint, blue water footprint, and dilution water footprint.
The green and blue water demand of a dairy farm plays a pivotal role in the regional water balance. Considering al-ready existing and forthcoming climate change effects there is a need to determine the water cycle in the field and in housing for process chain optimisation for the adaptation to an expected increasing water scarcity. Resulting investments to boost water productivity and to improve water use effi-ciency in milk production are two pathways to adapt to cli-mate change effects.
In this paper the calculation of blue water demand for dairy farming in Brandenburg (Germany) is presented. The water used for feeding, milk processing, and servicing of cows over the time period of ten years was assessed in our study. The preliminary results of the calculation of the direct blue wa-ter footprint shows a decreasing wawa-ter demand in the dairy production from the year 1999 with 5.98×10⁹L/yr to a wa-ter demand of 5.00×10⁹L/yr in the year 2008 in Branden-burg because of decreasing animal numbers and an improved average milk yield per cow. Improved feeding practices and shifted breeding to greater-volume producing Holstein-Friesian cow allow the production of milk in a more water sustainable way. The mean blue water consumption for the production of 1 kg milk in the time period between 1999 to 2008 was 3.94±0.29 L.
The main part of the consumed water seems to stem from indirect used green water for the production of feed for the cows.
Correspondence to:K. Drastig (kdrastig@atb-potsdam.de)
1 Introduction
The overall goal of the working group “Adaptation to Cli-mate Change” at the Leibniz-Institute for Agricultural En-gineering Potsdam-Bornim (ATB) is to assess the climate change impacts on agricultural farming systems and to iden-tify adaptation measures, investigated on the process chain level in farms – the border of the production area is taken as the limit of the investigated area. On the one hand the pur-pose is to combine a process based hydrological modelling of crops on the mesoscale (e.g. 10 ha). On the other hand a live-stock (e.g. number of cows<200) on the level of an
agricul-tural production system to a validated modelling system for a green-blue water analysis will be modelled. Investigations concerning the water consumption at two farms shall con-firm the calculated results of the approach. The development of simulation models for dairy forage systems began in the early 1980s. The Dairy Forage System Model or DAFOSYM (Rotz, 1989), linked a crop production model with a dairy animal intake as a whole farm approach. The DAFOSYM Model includes the water demand in a rather simple way. We aim to assess the diverted green and blue water consumption and the amount of produced dilution water at the level of an agricultural production system using a prevailed process-based modelling by means of the Water Footprint concept.
1
Fig. 1.The water footprint along a supply chain (Hoekstra et al., 2009).
frequent winter floods, endangered ecosystems and increas-ing ground instability, are likely to outweigh their benefits (IPPC, 2007). For regional agriculture, more detailed sce-narios of the climate development were necessary. Based on three IPCC emission scenarios different regional models (e.g. Gerstengarbe et al., 2003) showed for Germany: it will become warmer, especially in winter, and the annual quan-tity of precipitation will remain relatively constant, with less rainfall in summer and more precipitation in winter. This de-velopment may lead to substantial reductions in primary pro-ductivity, large and widespread increase of irrigation demand resulting in reductions in farm income (Olesen and Bindi, 2004). The resulting effects depend on current climatic and soil conditions, the direction of change and the availability of resources and infrastructure to cope with change. One adaptation strategy can be the modification of water use effi-ciency. The efficiency of a specific crop or a specific housing system varies with climate and agronomic practice (Allen et al., 1998). There are several options for modification of wa-ter efficiency, e.g. the shifting of dairy breeds from the high milk-solids breeds to the greater-volume producing cows. Regarding crops, the sowing date and plant density, supple-mental irrigation, and humus conservation management can be factors to raise water efficiency (Drastig et al., 2010).
Dairy production exists world-wide and is an expand-ing production field. Global production, e.g. cheese, ex-pands faster than consumption. The production rates of but-ter, cheese and whole milk powder are expected to grow worldwide between 1% and 2% per annum, especially in the NON-OECD states (OECD, 2004).
All food production systems have environmental impacts, which can be assessed per unit of output (e.g. kg of milk pro-duced by kg of water input). The most common way to as-sess environmental impacts from a product perspective is the life cycle analysis (LCA) integrating the life cycle impact as-sessment (LCIA). The usually known and used indicator for understanding ecological impacts is the ecological footprint (EF). These approaches include water rather simplistically.
Few studies cover the life cycle of production chains such as the tomato (Anton et al., 2005), rye bread, ham (Weidema, 1995) and Greek beer production (Koroneoset al., 2005). LCA within the dairy industry, from production through
retail sales, showed that the majority of global warming, eutrophication, and acidification potentials occurred during the on-farm production phase (Berlin, 2002; Hogaas Eide, 2002). However, the water related processes of the life cycle of milk production, including drinking water, crop produc-tion, and measured site-specific data from dairies, has not been addressed yet.
Chapagain and Hoekstra (2004) present a water footprint methodology by linking global consumption to local water resources. They investigated the virtual water content of dif-ferent crops, e.g. cotton, tomato, maize, wheat, husked rice and livestock products, e.g. chicken, pork, and beef, and different primary crops with their water footprint concept. They report that the virtual water content of products strongly varies from place to place, depending on climate, technology adopted for farming and corresponding yields. The Water Footprint is defined as the total volume of freshwater that is used to produce the goods and services, consumed by one individual or community or by the business (Hoekstra, 2009). This footprint can be diverted into the three compo-nents: the “blue” water footprint, as water used for irrigation withdrawn from rivers, lakes and aquifers, the “green” water footprint, as water used stemming from precipitation and soil water, and the dilution water footprint as volume of used and thereby polluted water for each component of a supply chain (Fig. 1).
The water footprint concept can be used as an indicator of water use that looks at both direct and indirect water footprint of the feed crop cultivation, the livestock farming, a food processor, a retailer or a consumer.
2 Methodology
Process
assessment
Green-blue water
analysis
Assessment of
adaptation Working group
`Adaptation to
Climate Change´
Water footprint
analysis for the
assessment of
processes in
dairy farms
Fig. 2. Work arrangement; contributions to major research fields are shown in the boxes on the right hand side.
For a detailed description of the water demand on a dairy farm, all elements of the process chain will be assessed. The water input is calculated on the basis of the water footprint analysis following Chapagain and Orr (2008). Here the water consumption is diverted into direct and indirect water con-sumption for the primary crop production, for the feed, drink and service of animals, and the amount of resulting wastew-ater. The crop evapotranspiration requirement will be calcu-lated using a crop coefficient for the respective growth period and reference crop evapotranspiration per day for different underlying soils under actual climate conditions.
– Green water use is assumed to be equal to the precipita-tion and the soil water absorbed by the crop. The crop evapotranspiration requirement will be calculated using different complex approaches.
– Blue water use depends mainly on process water and drinking water consumption.
– The dilution volume of water is depending on national water quality standards. The weight of a pollutant emit-ted into the water system from crop production will de-termine the volume of dilution water.
As a first step in our study a direct blue water footprint used for feeding, drinking, and servicing of the dairy cows in Brandenburg was assessed for the time period from 1999 to 2008. The preliminary results are presented here.
For the calculation of the direct blue water footprint we used the data reported by the Livestock Breeding Report 2008 (Tierzuchtreport, 2008; MLUV, 2008). This data set gives information e.g. about the number of lactating cows and their milk yield for the respective years. The calcula-tion of the water demand for drinking, milk processing, and
1
Fig. 3. Changes in total milk production, cow numbers, and indi-vidual cow milk yield between 1999 and 2008 in Brandenburg (data source: MLUV, 2008).
servicing of the animals was assessed using formulas taken from the Association for Technology and Structures in Agri-culture (KTBL, 2008). Data from literature were used to de-fine the milk yield per cow in a year as well as the mean tem-peratures in the cattle buildings (Table 1). The calculations of the standard process in dairy farming in Brandenburg relate on a cattle building with 180 animal places.
Incorporation of more detailed data and calculation of the indirect water footprint of the feed crop cultivation for the animals will be the next step. Investigations concerning the water consumption of at least two farms shall confirm the calculated results of the approach.
3 Results
Table 1.Input data for the calculation of the water demand for drinking, milk processing, and servicing of the cows in a standard mean sized stable with 189 heads.
Water consuming process Input data Assumed value
Drinking Mean stable temperature [◦] 151
Milk production [kg/day/cow] 263
Mean weight of the cow [kg] 6503
Sodium uptake [g/d/cow] 3.852
Dry matter uptake [kg/day/cow] 17.53
Roughage uptake [%] 703
Number of Milking units 163
Milking places [m2] 291
Milking pit area [m2] 141
Milking chamber area [m2] 161
Number of flushings 51
Volume of milk tank [L] 4500
Number of milkings per day 23
Number of cleaning processes per day 21
Service Water demand high pressure cleaner [L/min] 231
Time demand high pressure cleaner [min] 91
Water demand for disinfection (0.3 to 1.0) [L/m2] 11
Disinfected area [m2] 17641
1KTBL (2008),2Kirchgeßner (2004),3Kraatz and Berg (2009).
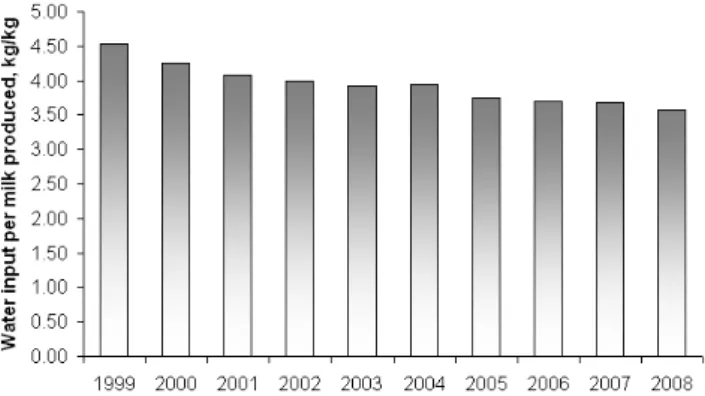
Fig. 4. Direct blue water consumption per kilogram of milk from 1999 to 2008 for dairy production systems in Brandenburg state. The blue water footprint per kilogram of milk excludes the indirect water footprint of the feed crop cultivation for the animals.
increase in productivity since the 1960s. Capper et al. (2009) stated factors that have played into the genetic change. First, the common dairy breeds have been shifted from the high milk-solids breeds (Black Pied Dairy Cattle) to the greater-volume producing Holstein-Friesian cow after 1990. Second, artificial insemination has been widely adopted.
The results obtained for the direct blue water footprint show a decreasing water demand in the dairy produc-tion from 1999 with 5.98×10⁹L/yr to a water demand of 5.00×10⁹L/yr in 2008 in Brandenburg. The mean blue wa-ter consumption for the production of 1 kg milk in the period
between 1999 and 2008 was 3.94±0.29 L. Comparing the de-creased blue water consumption per kg of milk of 2008 with its 1999 equivalent (Fig. 4), it appears that improved feeding practices are more water efficient. Expressed on an outcome basis (per kg of milk, Fig. 3), the water footprint per kg of milk in 2008 is about one fifth lower than in 1999.
We found that the highest blue water consuming process was the supply of the cows with drinking water (Fig. 5). Be-side the drinking water consumption of cows, losses from leaky tubes and watering places may cause a huge loss of drinking water.
4 Results and discussion
The preliminary results of the presented blue water consump-tion used per kg of produced milk show in relaconsump-tion to the literature comparable results. The inventory of two farms in Galicia (Spain) lead to a water consumption of 2.7 L for the production of 1 L raw milk (Hospido et al., 2003) which are comparable with our blue water consumption of 3.58 L for the production of 1 kg milk in the year 2008. Capper et al. (2009) found for the US-American dairy production sys-tems in 1944 and 2007 a decrease of the water consumption from 10.76 L/kg milk to 3.78 L/kg milk in 2007. These re-sults are in line with our calculations.
Fig. 5. Share of water used for the water consuming processes drinking, milk processing, and service for milk production in Bran-denburg in 2008.
assumed for Swedish dairies that water was consumed pri-marily by the cleaning processes at both the farm and the dairy. Following this assumption the amount of water con-sumed by the cattle was not included in their LCA. Resulting from this Høgaas Eide (2002) reported a remarkable lower water use. According to their results Swedish small, middle-sized and large dairies required 1.3 L, 1.05 L and 1.2 L of water per L milk, respectively. It seems to be necessary to include as well the drinking water into the LCA of dairies. Different literature values show the need for a careful inter-pretation of the reported water consumption results assessed per unit of output. A differentiation of the assessment into green water used, blue water used and the dilution water pro-duced could help to clarify and interpret the results. The wa-ter related processes of the life cycle of milk including drink-ing water, crop production, and measured site-specific data from dairies, diverted into green and blue water consump-tion and the amount of produced diluconsump-tion water has not been addressed yet in the literature.
The main part of the consumed water seems to stem from the indirect used green water for the production of the feed for the cows. Hoekstra (2008) calculated for the beef produc-tion a major share of 99% used water for the producproduc-tion of the feed. Chapagain and Hoekstra (2004) calculated a world average of 990 m3 water per ton of produced milk. If the blue water footprint accounts to only 0.4% of the whole wa-ter footprint, the measures to raise wawa-ter efficiency in milk production will not be focussed in this area.
5 Conclusions
The decreased water footprint in Brandenburg over the years from 1999 to 2008 shows that improved feeding practices are more water sustainable than the formerly used feeding prac-tices. But it has to be kept in mind that the assessment of en-vironmental impacts of food production chains must be done under integrative consideration of other kinds of resources
used or footprints left. The overall goal should be to produce sufficient high-quality food from the finite resource supply: water, energy, and carbon. The more water sustainable feed-ing practices may cost a disproportional energy and/or land use input.
The incorporation of more detailed data and the incorpora-tion of the indirect water footprint of the feed crop cultivaincorpora-tion for the animals of dairy farms in Brandenburg seem to be a promising mean. If the blue water footprint accounts to less than 1% of the whole water footprint, measures to raise wa-ter efficiency in milk production should concentrate on green water used during feed production.
6 Outlook
Although many indicator-based LCA assessments for agri-culture and food production have been developed in the last decade, considerably less effort has been put on their valida-tion.
The wide range of water used for different stages in the agricultural process chain of dairy farms shows the impor-tance to assess the processes forming the water consumption in a livestock husbandry in detail. The purpose of the already existing working group is to combine a process based hydro-logical modelling of crops on a mesoscale (e.g. 10 ha) and the modelling of a livestock (e.g. number of cows<200) on
the level of an agricultural production system to a validated modelling system. Investigations concerning the water con-sumption at two farms shall confirm the calculated results of the approach.
Acknowledgements. We would like to thank the colleagues of the Leibniz-Institute for Agricultural Engineering Potsdam-Bornim for cooperation, support and the supply of agricultural data. The autors thank A. Wahren, F. Tavares Wahren, and K.-H. Feger for editing and J. Hack and another anonymous referee for a constructive review.
Edited by: A. Wahren, F. Tavares Wahren, and K.-H. Feger Reviewed by: J. Hack and another anonymous referee
References
Allen, R. G., Pereira, L. S., Raes, D., and Smith, M.: Crop evap-otranspiration: Guidelines for computing crop water require-ments, FAO Irrigation and Drainage Paper 56, Rome, Italy, Food and Agriculture Organization of the United Nations (FAO), 1998. Anton, A., Montero, J. I., Munoz, P., and Castells, F.: LCA and tomato production in Mediterranean Greenhouses, International Journal of Agricultural Resources, Governance and Ecology, 4, 102–112, 2005.
Berlin, J.: Environmental life cycle assessment (LCA) of Swedish hard cheese, Int. Dairy J., 12, 939–95, 2002.
Capper, J. L., Cady, R. A., and Bauman, R. A.: The environmental impact of dairy production: 1944 compared with 2007, J. Anim. Sci., 87, 2160–2167, 2009.
Chapagain, A. K. and Hoekstra, A. Y.: Water footprints of nations, UNESCO-IHE, 2004.
Drastig, K., Prochnow, A., and Brunsch, R.: Wassermanagement in der Landwirtschaft, Berlin Brandenburg Academy of Sciences and Humanities, Discussion Paper, 3, 2010 (in German). Gerstengarbe, F.-W., Badeck, F., Hattermann, F., Krysanova, V.,
Lahmer, W., Lasch, P., Stock, M., Suckow, F., Wechsung, F., and Werner P. C.: Studie zur klimatischen Entwicklung im Land Brandenburg bis 2055 und deren Auswirkungen auf den Wasser-haushalt, die Forst- und Landwirtschaft sowie die Ableitung erster Perspektiven, Potsdam-Institut f¨ur Klimafolgenforschung e.V., PIK-Report, 83 pp., 2003 (in German).
Hoekstra, A. Y.: The water footprint of food, in: Water for food, edited by: F¨orare, J., The Swedish Research Council Formas, 2008.
Hoekstra, A. Y., Chapagain, A. K., Aldaya, M. M., and Mekon-nen, M. M.: Water Footprint Manual – State of the Art 2009, Enschede, The Netherlands, Water Footprint Network, 2009. Høgaas Eide, M.: Life cycle assessment of industrial milk
produc-tion, Int. J. LCA, 7, 115–126, 2002.
Hospido, A., Moreira, L. S., and Feijoo, G.: Simplified life cycle assessment of galician milk production, Int. Dairy J., 13, 783– 796, 2003.
IPPC: Fourth Assessment Report (AR4), in: Working Group II Re-port “Impacts, Adaptation and Vulnerability” Summary for Pol-icymakers, Intergovernmental Panel on Climate Change (IPPC), 939 pp., 2007.
Kirchgeßner, M.: Tierern¨ahrung - Animal Nutrition, Frankfurt (Main), DLG-Verlags-GmbH, 608 pp., 2004.
KTBL: Betriebsplanung Landwirtschaft 2006/07, Kuratorium f¨ur Technik und Bauwesen in der Landwirtschaft e.V., Darmstadt, 2006.
KTBL: Wasserversorgung in der Rinderhaltung Wasserbedarf – Technik – Management, 81, Kuratorium f¨ur Technik und Bauwe-sen in der Landwirtschaft e.V, Darmstadt, 2008.
Koroneos, C., Roumbas, G., Gabari, Z., Papagiannidou, E., and Moussiopoulos, N.: Life cycle assessment of beer production in Greece, J. Cleaner Prod., 13, 433–439, 2005.
Kraatz, S. B. and Berg, W.: Energy Efficiency in Raising Live-stock at the Example of Dairy Farming: Conference Proceedings, ASABE Annual International Meeting, Reno/Nevada, 2009. MLUV: Tierzuchtreport 122, Ministeriums f¨ur L¨andliche
Entwick-lung, Umwelt und Verbraucherschutz des Landes Brandenburg, 2008.
OECD: OECD Agricultural Outlook 2004–2013, Organisation for Economic Co-operation and Development (OECD), 46 pp., 2004.
Olesen, J. E. and Bindi, M.: Consequences of climate change for European agricultural productivity, land use and policy, Eur. J. Agron., 16, 239–262, 2002.
Rotz, C. A.: DAFOSYM: the dairy forage system model. Reference Manual. Agric. Engineering Dept., Michigan State University, East Lansing, 1989.
Shiklomanov, I.: Appraisal and assessment of world water re-sources, Water Int., 25, 11–32, 2000.
UNDP: Human Development Report 2006 – Beyond Scarcity: Power, Poverty and the Global Water Crisis, New York, United Nations Development Programme, 422 pp., 2006.