www.hydrol-earth-syst-sci.net/18/2103/2014/ doi:10.5194/hess-18-2103-2014
© Author(s) 2014. CC Attribution 3.0 License.
Determination of virtual water content of rice and spatial
characteristics analysis in China
L. J. Zhang, X. A. Yin, Y. Zhi, and Z. F. Yang
State Key Laboratory of Water Environmental Simulation, School of Environment, Beijing Normal University, Beijing, China
Correspondence to:X. A. Yin ([email protected])
Received: 23 December 2013 – Published in Hydrol. Earth Syst. Sci. Discuss.: 22 January 2014 Revised: – Accepted: 2 May 2014 – Published: 6 June 2014
Abstract.China is a water-stressed country, and agriculture consumes the bulk of its water resources. Assessing the vir-tual water content (VWC) of crops is one important way to develop efficient water management measures to allevi-ate wallevi-ater resource conflicts among different sectors. In this research, the VWC of rice, a major crop in China, is taken as the research object. China covers a vast land area, and the VWC of rice varies widely between different regions. The VWC of rice in China is assessed and the spatial character-istics are also analysed. The total VWC is the total volume of freshwater both consumed and affected by pollution dur-ing the crop production process, includdur-ing both direct and indirect water use. Prior calculation frameworks of the VWC of crops did not contain all of the virtual water content of crops. In addition to the calculation of green, blue and grey water – the direct water in VWC – the indirect water use of rice was also calculated, using an input–output model. The percentages of direct green, blue, grey and indirect water in the total VWC of rice in China were found to be 43.8, 28.2, 27.6, and 0.4 %. The total VWC of rice generally showed a roughly three-tiered distribution, and decreased from south-east to northwest. The higher values of direct green water usage were mainly concentrated in Southeast and Southwest China, while the values were relatively low in Northwest China and Inner Mongolia. The higher direct blue water val-ues were mainly concentrated in the eastern and southern coastal regions and Northwest China, and low values were mainly concentrated in Southwest China. Grey water val-ues were relatively high in Shanxi and Guangxi provinces and low in Northeast and Northwest China. The regions with high values for indirect water were randomly distributed but the regions with low values were mainly concentrated in Northwest and Southwest China. For the regions with
rela-tively high total VWC the high values of blue water made the largest contribution, although for the country as a whole the direct green water is the most important contributor.
1 Introduction
The termvirtual water was first proposed by Allan (1994) and defined as the water embodied in traded products. Later the concept of virtual water was modified by Hoekstra and Chapagain (2007) to indicate the water input required to gen-erate a product or service. The virtual water content of a product is the freshwater embodied in the product, not in the real sense, but in the virtual sense. It refers to the volume of the freshwater both consumed and affected by pollution in producing the product, measured over its full production chain (Hoekstra et al., 2011). In water-stressed regions, lim-ited water resources should be used efficiently by not allo-cating the majority of resources to the production of water-intensive products, but being made available for other eco-nomic purposes that can contribute more to the regional value added by consuming less water (Allan, 2002; Chapagain and Hoekstra, 2008). Assessing the virtual water content (VWC) of products is the basis for developing such water resource management practices.
water withdrawn from ground or surface water) was ini-tially proposed. Research has been performed at global, na-tional, provincial, and river basin scales. For example, Rost et al. (2008) made a global estimate of agricultural green and blue water consumption. Siebert and Döll (2010) computed the green and blue VWC of crops at a global scale, and found that the global average VWC of cereal crops was 1109 m3t−1
of green water and 291 m3t−1of blue water. Scientists have
also added grey water to the VWC, defined as freshwater that is required to assimilate the pollutant load based on natural background concentrations and existing ambient water qual-ity standards. Chapagain et al. (2006) first calculated the grey water in the VWC of crops, finding that the global VWC of rice was an average of 1325 m3t−1 and, further, that grey
water occupied about 8 % of the total VWC (Chapagain and Hoekstra, 2011). Mekonnen and Hoekstra (2011a) quantified grey VWC of global crop productions for the period 1996– 2005, and found that green, blue and grey water accounted for 78, 12 and 10 % in the total VWC of crops.
China is one of the world’s 13 most water-poor countries (Yu et al., 2006). In 2012, per capita use of water resources in China was only 2100 m3, less than 30 % of the world per capita consumption. Agriculture is the largest water user in China, accounting for nearly 70 % of total water withdrawals (Ministry of Water Resources, 2012). Studies on the VWC of crops in China are relatively limited. Liu et al. (2007), from the perspective of crop water productivity, estimated the vir-tual water use of winter wheat. Sun et al. (2013a) used the crop water requirement to calculate the China average VWC of wheat, maize and rice, and found the proportions of green and blue water to be 50.98 and 49.02 %, 76.27 and 23.73 %, and 61.90 and 38.10 %, respectively. The VWC of rice was relatively low in the eastern part of Northeast China, middle– lower reaches of the Yangtze River and the eastern part of Southwest China. In contrast, the high values of VWC for rice were located in the west of Inner Mongolia and south of the Xinjiang Uygur autonomous region. Sun et al. (2013b) estimated the VWC of crops as 3.91 m3kg−1in the Hetao
irrigation district of China. The percentage of blue water was relatively high (90.91 %), while the share of green water was small (9.09 %). However, these studies all ignored grey water.
Rice as a cereal grain is the most widely consumed sta-ple food for a large part of the population, especially in Asia. According to data from FAOSTAT, rice is the grain with the second-highest worldwide production, after maize. China is the biggest rice-producing country in the world. In 2007, the planting area of rice was the second largest in China (about 29 million hectares), comprising 34 % of the total planting area of grain crops. Rice production is the largest grain pro-duction in China (around 186 million tonnes), accounting for 41 % of the total grain (Ministry of Agriculture of the Peo-ple’s Republic of China, 2008). There is no research on the total VWC of rice and spatial distribution characteristics in China at the provincial scale by actual total water use. China
covers a vast land area, and the VWC of rice varies widely between different regions. The VWC of rice in China is as-sessed and the spatial characteristics are also analysed.
Prior research on crop VWC determination provides a good framework for this work. However, prior calculation frameworks of VWC of crops have some defects. Some use the water requirement of crops instead of actual water use, and others ignore the freshwater affected by pollution during crop production. Besides, in all previous calculation frame-works the indirect water use of crops was also ignored. On the basis of the previous frameworks, in addition to direct water use (blue, green, and grey water), we also consider indirect water (the sum of the virtual water of all products consumed in the process of rice planting). In this paper, we calculate the total VWC of rice for 29 Chinese provinces, autonomous regions, and municipalities in 2007, including both direct and indirect water use. Because of the lack of data, Tibet is not taken into account; and no rice is planted in Qinghai, so Qinghai is not taken into account either. The spatial distribution characteristics of the VWC of rice are also analysed.
2 Methodology and data 2.1 Methodology
To reflect water consumption during crop production, direct and indirect water were taken into account. Due to lack of data, we cannot divide the VWCindirectinto VWCindirect,green,
VWCindirect,blueand VWCindirect,grey:
VWCtotal=VWCindirect+VWCdirect
=VWCindirect+VWCdirect,green
+VWCdirect,blue+VWCdirect,grey (1)
where VWCtotalis the total volume of freshwater both
con-sumed and affected by pollution during the crop produc-tion process (m3kg−1); VWC
indirect is the freshwater both
consumed and affected by pollution that can be associated with the production of the goods and services or the in-puts used during the crop production process (m3kg−1);
VWCdirect is the freshwater both consumed and affected
by pollution that is associated with direct water use during the crop production process (m3kg−1); VWC
direct,green is
the precipitation consumed in the crop production process (m3kg−1); VWC
direct,blue is the surface water or
ground-water consumed in the crop production process (m3kg−1);
and VWCdirect,grey is the freshwater required to assimilate
the load of pollutants during the crop production process (m3kg−1).
2.1.1 Indirect water of crops
economic system (Leontief, 1941), and is adopted to calcu-late the indirect virtual water of crops supplied by each eco-nomic sector. The calculations are as follows (Chen, 2000; Kanada, 2001; Zhao et al., 2009; Zhang et al., 2011).
1. Direct consumption coefficient matrix. The input– output table is used because it reflects the contact of the materials and technologies. This contact is reflected through the direct consumption coefficient:
A=aij =
xij/xi
, (2)
where A is the direct consumption coefficient matrix (n×n dimensional matrix) in the IO table; aij is the direct consumption coefficient, which means the mon-etary volume of products of sectoridirectly consumed by sectorj when producing one unit product;xij is the monetary volume of products from sectorj consumed by sectoriin its production process (RMB); andxi is the output of sectori(RMB).
2. Complete consumption coefficient matrix. Compared with the direct consumption coefficient, the complete consumption coefficient can more accurately measure the direct and indirect costs (the sum of the direct and indirect costs is completely consumed) of products or services from other sectors:
B=bij
=(I−A) −1−I,
(3) whereB is the complete consumption coefficient ma-trix (n×n dimensional matrix) in the IO table; bij is the complete consumption coefficient, which means the monetary volume of products of sectoridirectly and in-directly consumed by sectorjwhen producing one unit product; andIis a unit diagonal matrix.
3. Water use coefficient. To account for indirect water, it is necessary to compute the water use coefficient of dif-ferent sectors, which is the water needed to produce one monetary unit (RMB):
DWCi=wi/xi, (4)
where DWCi is the direct water coefficient of sectori
(m3RMB−1)andw
i is the direct water consumption of sectori(m3). DWCiis the amount of direct water intake to produce one monetary unit of production.
4. Indirect water of agriculture. Indirect water consump-tion of agriculture is the amount of total water input from other sectors.
VWaindirect=
n X
i=1
(DWCi×bia)×Ca, (5)
where VWaindirect is the indirect water consumption of agriculture (m3);bia is the complete consumption co-efficient of sectori for agriculture; andCa is the total
consumption of agriculture (RMB).
5. Indirect water consumption of a crop. VWCiindirect (m3kg−1)is calculated according to the proportion of
indirect water use of cropi in the total indirect water consumption of agriculture:
VWCiindirect=
VWaindirectαi
SAi×Y , (6)
where VWCiindirectis the indirect water consumption of cropi(m3kg−1);α
i is the proportion of indirect water use of cropi in the total indirect water consumption. Because of lack of data, we assume that the planting cost is proportional to the indirect water use. SAi is the sown area of cropi(ha); andY is the crop yield per unit area (kg ha−1). Thusα
i can be calculated as follows:
αi=
PCi×SAi
n P
i=1
(PCi×SAi)
, (7)
where PCi is the planting cost of cropi per unit area (RMB ha−1).
2.1.2 Direct green water of crops
Direct green water use is the lesser of potential crop evapo-transpiration and effective precipitation. Effective precipita-tion is defined as the amount of precipitaprecipita-tion that enters the soil and will be available in the soil for crop growth (Sun et al., 2013b):
VWCdirect,green=
10 min(ETc, Pe)
Y , (8)
where ETc is the crop evapotranspiration during the
grow-ing period (mm) andPe is the effective precipitation over
the crop growing period (mm), calculated by the CROPWAT model using monthly climatic data (mm) (Clarke, 1998; FAO, 2003).
Crop evaporation during the growing period is calculated as follows (Allen et al., 1998):
ETc=ETo×kc, (9)
wherekcis the crop coefficient, reflecting the differences in
physical and physiological factors between the actual and reference crops and ETo is the soil evaporation of the
ref-erence underlying surface (mm d−1), calculated by the FAO
Penman–Monteith formula (Allen et al., 1998). 2.1.3 Direct blue water of crops
The direct blue water of a crop is calculated using the irri-gation water consumption,Ic. The irrigation water
return flows of irrigation water. The direct blue water is cal-culated according to the proportion of irrigation water con-sumption of cropiin the total irrigation water consumption of the irrigation district (Sun, 2013b):
VWCidirect,blue=Ici/Y = WAβi
SAi×Y, (10)
whereIci is the irrigation water consumption of cropi per unit area (m3ha−1),W
Ais the irrigation water consumption of the irrigation district (m3)andβi is the proportion of ir-rigation water use of cropiin the total irrigation water con-sumption of the irrigation district. βi can be calculated as follows:
βi=
ETic−Pei
×SAi
n P
i=1
ETic−Pei
×SAi
, (11)
where ETicis the crop evapotranspiration of cropiduring the growing period (mm), Pei is the effective precipitation over the cropigrowing period (mm) and SAi is the sown area of cropi(ha).
2.1.4 Direct grey water of crops
In this study we quantify direct grey water related to nitro-gen use only. The direct grey water is calculated by multi-plying the fraction of nitrogen that leaches or runs off by the nitrogen application rate and dividing this by the difference between the maximum acceptable concentrations of nitrogen and the natural concentration of nitrogen in the receiving wa-ter body and by the actual crop yield (Mekonnen and Hoek-stra, 2011a). Because of lack of data, the natural nitrogen concentrations were assumed to be 0. On average, 10 % of the applied nitrogen fertilizer is lost through leaching (Cha-pagain et al., 2006). The maximum value of nitrate in surface and ground water recommended by the United States Envi-ronmental Protection Agency is 10 mg L−1(Chapagain et al.,
2006):
VWCdirect,grey=
Nc×10 %
10−Nn
/Y, (12)
whereNc is the amount of nitrogen fertilizer consumption
per hectare (g ha−1)andN
n is the natural concentration of
nitrogen in the receiving water body (mg L−1).
2.2 Data
The 2007 climate data for 29 regions, including monthly average maximum temperature, monthly average minimum temperature, relative humidity, wind speed, precipitation, and sunshine hours, are taken from the National Climatic Centre (NCC) of the China Meteorological Administration (CMA). The agricultural data, including crop yield and sown area, are taken from the China Agricultural Yearbook (Min-istry of Agriculture of the People’s Republic of China, 2008).
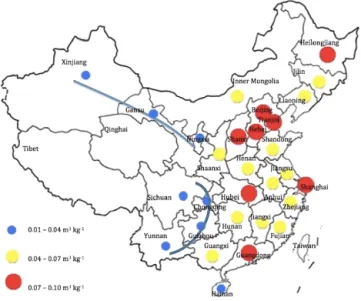
Figure 1.Indirect water of rice (m3kg−1).
The average amount of nitrogen fertilizer of rice per unit area is taken from Li et al. (2010) and Zhang et al. (2008, 2009). The irrigation water consumption for the 29 regions is taken from the Water Resources Bulletins (2007) of the 29 regions. Water data for various sectors in the regions are from the Sta-tistical Yearbooks (2008) of the 29 regions. The IO data for the 29 regions come from the official IO tables (2007) of the 29 regions.
3 Results
3.1 Indirect water of rice
The VWCindirect of rice varied between 0.001 and
0.010 m3kg−1. The average VWC
indirectwas 0.004 m3kg−1.
The regions with the same line had the same distribution characteristic of VWCindirect of rice in Fig. 1. The input to
agriculture in relatively underdeveloped regions was rela-tively small; relarela-tively developed regions invest more money in agriculture. Northwest and Southwest China are relatively underdeveloped with relatively low VWCindirectof rice.
Bei-jing, Guangdong, and Shanghai are the three most devel-oped regions and had the highest VWCindirectof rice in 2007
(Fig. 1). We found that VWCindirectof rice is directly related
to the degree of regional economic development.
Of all sectors, the sector of forestry, animal husbandry, and fishery contributed the most VWCindirectof rice, accounting
Figure 2.Direct green water of rice (m3kg−1).
3.2 Direct green water of rice
The regional differences in VWCdirect,green for rice were
significant, owing to differences in climatic conditions and crop yields. The VWCdirect,green of rice for the 29 regions
in 2007 ranged from 0.10 to 0.90 m3kg−1. The average
VWCdirect,greenof rice was 0.59 m3kg−1. VWCdirect,greenof
rice increased gradually from northern to southern regions (Fig. 2). The regional variability of VWCdirect,green of rice
was in accordance with the distribution of precipitation in China. The regions with abundant precipitation usually have high VWCdirect,green of rice. Precipitation in southern
re-gions of China is far greater than that in northern rere-gions. Consequently, the VWCdirect,greenof rice in southern regions
would be higher than that in northern regions.
The regions with higher VWCdirect,greenvalues were
con-centrated in Southeast China and Southwest China (Fig. 2). The high VWCdirect,green in these regions is a result of the
high ratio between effective precipitation and rice yield. The regions in Southeast China and Southwest China had rela-tively low rice yields, much lower than the national aver-age, and relatively high effective precipitation, more than 400 mm. For example, the VWCdirect,green of rice was more
than 0.80 m3kg−1 in Hainan (Southeast China), Guangxi
(Southwest China) and Yunnan (Southwest China). The
VWCdirect,green of rice in Guizhou (Southwest China) was
also relatively high, at more than 0.80 m3kg−1. This is
mainly because the effective precipitation over the growing period of rice in this region was more than 590 mm, although rice yield in this region was higher than the national average. The VWCdirect,greenof rice in Northwest China and Inner
Mongolia were relatively low (Fig. 2), because of high yields and low effective precipitation. Xinjiang (Northwest China) had the lowest VWCdirect,green (0.10 m3kg−1)because the
Figure 3.Direct blue water of rice (m3kg−1).
rice yield in Xinjiang was 1.32 times higher than the national average and the effective precipitation over the growing pe-riod was small, less than 90 mm.
3.3 Direct blue water of rice
The differences in blue water requirements, actual irriga-tion water consumpirriga-tion and rice yields resulted in signifi-cantly different VWCdirect,bluevalues between regions. The
VWCdirect,blue values ranged from 0.07 to 1.65 m3kg−1,
and the average was 0.42 m3kg−1. The regions with higher
VWCdirect,blueof rice were mainly concentrated in the
east-ern and southeast-ern coastal regions and in Northwest China (Fig. 3). The VWCdirect,blue of rice was high in the
mu-nicipalities of Beijing, Tianjin and Shanghai, at more than 0.83 m3kg−1. These three municipalities have developed
economies with relatively more developed agricultural irriga-tion systems, so irrigairriga-tion water consumpirriga-tion was relatively larger than that of other regions. Regions in Northwest China had higher VWCdirect,bluevalues, perhaps because the
effec-tive precipitation in these regions was limited, making it nec-essary to increase the irrigation water supply for crops.
The VWCdirect,blue values for rice in Southwest China
were relatively low (Fig. 3). The VWCdirect,blue values in
Chongqing, Guizhou, Sichuan and Yunnan were less than 0.16 m3kg−1because in these four regions the effective
pre-cipitation can almost meet the water requirements of rice, so the actual irrigation water consumption was limited. Jilin, Shandong and Henan were the other three regions with rel-atively low VWCdirect,blue of rice. Limited irrigation
wa-ter consumption in the three regions might only meet less than 25 % of the irrigation requirement of rice. Therefore, the VWCdirect,blueof rice in Jilin, Shandong and Henan was
Figure 4.Direct grey water of rice (m3kg−1).
3.4 Direct grey water of rice
The VWCdirect,grey values of rice ranged from 0.21 to
0.64 m3kg−1 with an average 0.37 m3kg−1. Regional
dif-ferences in VWCdirect,grey for rice were insignificant
(Fig. 4). Because nitrogen use is similar between regions, VWCdirect,greymainly depends on rice yield. The rice yield
of regions in Northeast China and Northwest China were rel-atively high, making the VWCdirect,greyof rice in Northeast
China and Northwest China relatively low. The rice yield of Shandong, Henan and Chongqing was much higher than the national average. That made the VWCdirect,greyof rice in the
three regions also relatively low. The highest VWCdirect,grey
values for rice were in Shanxi and Guangxi, because the rice yields of Shanxi and Guangxi in 2007 were the two lowest of all the regions studied.
3.5 Total VWC of rice
The VWCtotal values of rice for 29 regions are
calcu-lated and shown in Fig. 5. There were large differences in VWCtotal between regions, with values ranging from
0.80 to 2.59 m3kg−1. The average VWC
total of rice was
1.39 m3kg−1. The VWC
totalvalues showed a roughly
three-tiered distribution, gradually decreasing from the southeast to the northwest of China. The VWCtotal values in eastern
coastal China, Southeast China, Beijing and Tianjin were relatively high. The regions with lower VWCtotal values
were mainly concentrated in Northeast China and Northwest China.
Our result is very different from the result of Sun et al. (2013a). Their calculation of the VWC of rice was rel-atively low in the eastern part of Northeast China, middle– lower reaches of the Yangtze River and the eastern part of Southwest China. In contrast, the high values of VWC for
Figure 5.Total VWC of rice (m3kg−1).
rice were located in the west of Inner Mongolia and the south of the Xinjiang Uygur autonomous region. Their calcula-tion framework only considered the crop water requirement. However, our calculation framework considers the effective precipitation, crop evapotranspiration, irrigation water con-sumption, freshwater that is required to assimilate the load of pollutants, and the indirect water use. The difference of the VWCdirect,blueand the added VWCdirect,greyof rice caused
the large difference of spatial distribution characteristic be-tween actual VWCtotalof rice and the rice water requirement.
Our result better describes the spatial distribution character-istic of actual water use of rice in China.
4 Discussion
4.1 Comparison of calculations of total VWC of rice by different frameworks
Table 1.Comparison of VWC calculation frameworks.
VWC Method VWCdirect,green VWCdirect,blue VWCdirect,grey VWCindirect
Our method 10 min(ETC, Pe) /Y VWCdirect,blue=Ic/Y=WAαi
Ai /Y VWCdirect,grey=N10−c×10 %Nn /Y VWCindirect=
VWablue,indirectβi
Ai /Y
Sun’s method 10 min(ETC, Pe) /Y VWCdirect,blue=Ic/Y=WAαi
Ai /Y — —
GBG method 10 min(ETC, Pe) /Y 10 max(0,ETc−Pe)/Y VWCdirect,grey=Nc×10 %
10−Nn /Y —
CWR method 10 min(ETC, Pe) /Y 10 max(0,ETc−Pe)/Y — —
Table 2.The volume (m3kg−1)and proportion (%) of VWC of rice in Heilongjiang Province by four different frameworks.
VWC Method VWCdirect,green VWCdirect,blue VWCdirect,grey VWCindirect VWCtotal
Our method 0.45 (46.0) 0.29 (30.2) 0.22 (22.9) 0.01 (0.9) 0.97 Sun’s method 0.45 (60.5) 0.29 (39.5) — — 0.74 GBG method 0.45 (26.6) 1.01 (60.1) 0.22 (13.3) — 1.68 CWR method 0.45 (30.7) 1.01 (69.3) — — 1.45
natural concentration of nitrogen in the receiving water body (Chapagain et al., 2006; Bulsink et al., 2010; Mekonnen and Hoekstra, 2011b). (3) In Sun’s framework, the total virtual water content of crops is also divided into green and blue water. Blue water is calculated according to actual irrigation water consumption (Sun et al., 2013b). (4) In our framework, the total virtual water content of crops is divided into direct green, direct blue, direct grey and indirect water. The cal-culations for green and grey water are the same as in the GBG framework and the calculation method for blue wa-ter is the same as in Sun’s framework. As described pre-viously, we add indirect water to the total VWC of crops. However, in our calculation framework of the VWC of crops, we made some assumptions and simplifications in the cal-culation of VWCindirect, VWCdirect,blueand VWCdirect,grey,
which causes some uncertainty in the results. The uncertainty of the results cannot be completely eliminated. We could only make better assumptions and simplifications and use more accurate data to make our results more accurate.
The VWC of rice of Heilongjiang Province in 2007 is used as an example to compare results among the four dif-ferent frameworks. As shown in Table 2, VWCtotal
calcu-lated by our framework is 0.97 m3kg−1, which accounts for
66.9, 57.7 and 133.8 % of the VWCtotal of rice under the
CWR framework, GBG framework, and Sun’s framework, respectively. The VWCtotal calculated by our framework is
lower than the VWCtotalcalculated by CWR framework and
GBG framework, because the VWCdirect,blueis calculated by
the crop irrigation water requirement under CWR framework and GBG framework and calculated by the actual irrigation consumption under our framework. According to the calcula-tion in our method, the actual irrigacalcula-tion consumpcalcula-tion cannot meet the irrigation water requirement of rice in Heilongjiang. The VWCdirect,blue value calculated from the actual
irriga-tion consumpirriga-tion under our framework is much lower than the VWCdirect,blue values calculated under the CWR and
GBG frameworks. Adding the VWCdirect,greyvalue resulted
in the VWCtotal calculated by our framework being larger
than the VWCtotalcalculated by Sun’s framework. The
con-tribution of VWCdirect,greyis very important, accounting for
22.9 % of the VWCtotalof rice under our framework, and
can-not be ignored. The contribution of VWCindirectas calculated
under our framework is limited and has little effect on the VWCtotalof rice in Heilongjiang.
4.2 Analysis of VWC structures of rice in China
Regional differences in VWCtotal values for rice were
sig-nificant, as were regional differences in the structure of the
VWCtotal of rice. The average VWCtotal of rice in China
was 1.39 m3kg−1. The percentages of VWC
direct,green,
VWCdirect,blue, VWCdirect,grey and VWCindirect in the
VWCtotalfor rice in China were 43.8, 28.2, 27.6 and 0.4 %,
respectively.
Generally speaking, the regions in China mostly had a higher VWCdirect,green of rice and a lower
VWCdirect,blue of rice. For example, in Chongqing the
percentage of VWCdirect,green was 67.6 % and the
per-centage of VWCdirect,blue was 6.6 %; in Sichuan the
percentage of VWCdirect,green was 53.7 % and the
per-centage of VWCdirect,blue was 12.4 %. Six regions were
exceptions, having lower VWCdirect,green of rice and
higher VWCdirect,blue of rice. In Beijing the
percent-age of VWCdirect,green was 19.8 % and the
percent-age of VWCdirect,blue was 63.2 %; in Tianjin the
per-centage of VWCdirect,green was 14.7 % and the
percent-age of VWCdirect,blue was 69.1 %; in Fujian the
per-centage of VWCdirect,green was 29.9 % and the
percent-age of VWCdirect,blue was 49.7 %; in Gansu the
percent-age of VWCdirect,green was 33.5 % and the percentage
of VWCdirect,blue was 37.9 %; in Ningxia the
VWCdirect,blue was 48.1 %; and in Xinjiang the
percent-age of VWCdirect,green was 12.1 % and the percentage of
VWCdirect,bluewas 61.6 %. There are two reasons for the
dif-ferent situation of the six regions. Excessive consumption of irrigation water caused a lower percentage of VWCdirect,green
of rice and a higher percentage of VWCdirect,blue of rice
in Beijing, Tianjin and Fujian. Limited precipitation caused a lower percentage of VWCdirect,green of rice and a higher
percentage of VWCdirect,blue of rice in Xinjiang, Ningxia
and Gansu. For the country as a whole, the proportion of VWCdirect,green of rice (43.8 %) was larger than the
VWCdirect,blueof rice (28.2 %). Rice growth mainly depends
on the VWCdirect,greenin China.
Regional differences in VWCdirect,grey values were
in-significant. This shows that the grey water in all regions plays an important role in VWCtotal. Agricultural pollution is an
important issue in every region that cannot be ignored. Be-cause the direct grey water estimated only considers chem-ical fertilizer pollution, and not the effect of pesticides and herbicides on water quality, the result of this estimation is a conservative estimate.
The values of VWCindirect in the VWCtotal of rice for
the 29 regions were comparatively low, ranging from 0.001 to 0.010 m3kg−1. The average VWC
indirect of rice was
0.004 m3kg−1. VWC
indirectof rice is related to the degree of
regional economic development. The region with the high-est VWCindirect value was Beijing and the region with the
lowest value was Ningxia. Because of the small contribution of VWCindirect, VWCindirectmay not be considered in future
research on the VWC of rice. However, the VWCindirect is
expected to be higher in some agricultural products, such as potatoes, cotton and fruits, so VWCindirectshould be included
in the VWCtotal. For example, the proportion of VWCindirect
in the VWCtotal of strawberry in 27 regions of China in
2007 ranged from 0.8 to 38.0 %, with an average of 10.8 %. The proportion of VWCindirectof strawberry is higher in the
VWCtotal. Therefore we cannot ignore the VWCindirectin the
calculation of the VWCtotalof some crops.
Assessing the VWC of crops is important to provide the basis for agricultural water resources management, and help to improve the efficiency of agricultural water use. Overall pressure on water resources might be relieved by locating water-intensive production processes in regions where water is abundant and where it requires less VWC of product.
5 Conclusions
Faced with increasingly severe pressure on water resources, virtual water theory provides a feasible solution to improve global water use efficiency. Research on the VWC of crops can provide the basis for agricultural water resources man-agement and help to improve the efficiency of agricultural water use. Rice is the most important food crop in China and also one of the largest water consumers, so it is important
to study the total VWC of rice in China. Previous research constructed calculation frameworks using direct green water, direct blue water and direct grey water of crops. Building on that previous research, we also considered the indirect water of VWC. In this paper, we calculated the virtual water con-tent of rice for 29 regions of China in 2007. The following conclusions were reached.
1. Analysis showed that the total VWC of rice in China decreased gradually from southeast to northwest. 2. The regions with high indirect water were randomly
dis-tributed. The indirect VWC of rice in Northwest China and Southwest China was relatively low.
3. The regions with higher direct green water were mainly concentrated in Southeast China and Southwest China. The direct green water of rice for Northwest China and Inner Mongolia was relatively low. The regions with higher direct blue water of rice were mainly concen-trated in the eastern and southern coastal regions of China and in Northwest China. The direct blue water of rice of Southwest China was relatively low. In the coun-try as a whole, the percentage of direct green water of rice was far above that of direct blue water. Therefore, rice growth is mainly dependent on direct green water in China.
4. The direct grey water of rice in Northeast China and Northwest China was relatively low. But in all regions, grey water occupies a very important position in total VWC.
Acknowledgements. We thank the International Science & Tech-nology Cooperation Programme of China (No. 2011DFA72420), the National Science Foundation for Innovative Research Group (No. 51121003), the National Basic Research Programme of China (No. 2010CB951104), and the Fundamental Research Funds for the Central Universities for their financial support.
Edited by: Y. Cai
References
Allan, J. A.: Overall perspectives on countries and regions, in: Water in Arab World: Perspectives and Progress, edited by: Rogers, P. and Lydon, P., Harvard University Press, Cambridge, UK, 65– 100, 1994.
Allan, J. A.: The Middle East Water Question: Hydropolitics and the Global Economy, Tauris Publishers, London, UK, 2002. Allen, R. G., Pereira, L. S., Raes, D., and Smith, M.: Crop
Chapagain, A. K. and Hoekstra, A. Y.: The global component of fresh water demand and supply: an assessment of virtual water flows between nations as a result of trade in agricultural and in-dustrial products, Water. Int., 33, 19–32, 2008.
Chapagain, A. K. and Hoekstra, A. Y.: The blue, green and grey wa-ter footprint of rice from production and consumption perspec-tives, Ecol. Econ., 70, 749–758, 2011.
Chapagain, A. K., Hoekstra, A. Y., Savenije, H. H. G., and Gautam, R.: The water footprint of cotton consumption: an assessment of the impact of worldwide consumption of cotton products on the water resources in the cotton producing countries, Ecol. Econ., 60, 186–203, 2006.
Chen, X. K.: Shanxi water resource input-occupancy-output table and its application in Shanxi Province of China, in: The 13th International Conference on Input-output Techniques, Macerata, Italy, 21–25 August 2000, 2-11, 2000.
China Meteorological Administration: China Meteorological Data Sharing Service System, Beijing, China, available at: http://cdc. cma.gov.cn (last access: 6 September 2011), 2011.
Clarke, D.: CROPWAT for Windows: User Guide, University of Southampton, UK, 1998.
FAO (Food and Agriculture Organization): Land and Water De-velopment Division, CROPWAT model, Food and Agricul-ture Organization, Rome, Italy, available at: http://www.fao. org/nr/water/infores_databases_cropwat.html (last access: 9 June 2011), 2003.
Hoekstra, A. Y. and Chapagain, A. K.: The water footprints of Mo-rocco and the Netherlands: global water use as a result of do-mestic consumption of agricultural commodities, Ecol. Econ., 64, 143–151, 2007.
Hoekstra, A. Y. and Hung, P. Q.: Virtual water trade: A quantifica-tion of virtual water flows between naquantifica-tions in relaquantifica-tion to interna-tional crop trade. Value of Water Research Report Series No. 11, UNESCO-IHE, Delft, The Netherlands, 2002.
Hoekstra, A. Y., Chapagain, A. K., Aldaya, M. M., and Mekon-nen, M. M.: The Water Footprint Assessment Manual: Setting the Global Standard, Earthscan, London, UK, 2011.
Kanada, N.: Land resources and international trade, Taga Shuppan, Tokyo, 2001.
Leontief, W.: The Structure of the American Economy, Oxford Uni-versity Press, Oxford, UK, 1941.
Li, H. L., Zhang, W. F., Zhang, F. S., Du, F., and Li, L. K.: Chemical fertilizer use and efficiency change of main grain crops in China, J. Plant Nutrit. Fertiliz., 16, 1136–1143, 2010 (in Chinese). Liu, J. G., Wiberg, D., Zehnder, A. J. B., and Yang, H.: Modelling
the role of irrigation in winter wheat yield, crop water productiv-ity, and production in China, Irrig. Sci., 26, 21–33, 2007
Mekonnen, M. M. and Hoekstra, A. Y.: The green, blue and grey water footprint of crops and derived crop products, Hydrol. Earth. Syst. Sci., 15, 1577–1600, doi:10.5194/hess-15-1577-2011, 2011a.
Mekonnen, M. M. and Hoekstra, A. Y.: National water footprint accounts: The green, blue and grey water footprint of production and consumption, Value of Water Research Report Series No. 50, UNESCO-IHE, Delft, Netherlands, 2011b.
Ministry of Agriculture of the People’s Republic of China: Chinese agricultural statistical data, Ministry of Agriculture of the Peo-ple’s Republic of China, Beijing, 2008.
Ministry of Water Resources: China Water Resources Bulletin 2011, China Water & Power Press, Beijing, 2012.
Rost, S., Gerten, D., Bondeau, A., Lucht, W., Rohwer, J., and Schaphoff, S.: Agricultural green and blue water consumption and its influence on the global water system, Water. Resour. Res., 44, W09405, doi:10.1029/2007WR006331, 2008.
Siebert, S. and Döll, P.: Quantifying blue and green virtual water-contents in global crop production as well as potential production losses without irrigation, J. Hydrol., 384, 198–207, 2010. Sun, S. K., Wu, P. T., Wang, Y. B., and Zhao, X. N.: The virtual
wa-ter content of major grain crops and virtual wawa-ter flows between regions in China, J. Sci. Food. Agric., 93, 1427–1437, 2013a. Sun, S. K., Wu, P. T., Wang, Y. B., Zhao, X. N., Liu, J., and Zhang,
X. H.: The impacts of interannual climate variability and agricul-tural inputs on water footprint of crop production in an irrigation district of China, Sci. Total Environ., 444, 498–507, 2013b. Yu, P. P., Zhang, J. Z., and Lin, C. G.: Agricultural development
strategy of China in the early 21st century, Resour. Environ. Dev., 7, 21–27, 2006 (in Chinese).
Zhang, S. D., Zhang, W. F., Wang, J. Q.: Character of Fertilizer Con-sumption and Supply- Demand and Strategy for Management in Middle and Lower Reaches of Yangtz River of China, Res. Agr. Modern., 29, 100–103, 2008 (in Chinese).
Zhang, S. D., Zhang, W. F., and Ma, L.: Study on the change of fertilizer consumption structure of main grain crop in Hebei, Jilin and Sichuan of China, Phosphate Compound Fertilizer, 24, 89– 91, 2009 (in Chinese).
Zhang, Z. Y., Yang, H., and Shi, M. J.: Analyses of water foot-print of Beijing in an interregional input-output framework, Ecol. Econ., 70, 2494–2502, 2011.