Eutopic and Ectopic Endometrial Stromal Cells
Yoshiaki Yamagata1*, Koichiro Nishino2, Eiichi Takaki3, Shun Sato1, Ryo Maekawa1, Akira Nakai3, Norihiro Sugino1
1Department of Obstetrics and Gynecology, Yamaguchi University Graduate School of Medicine, Ube, Japan,2Laboratory of Veterinary Biochemistry and Molecular Biology, Faculty of Agriculture, University of Miyazaki, Miyazaki, Japan,3Department of Biochemistry and Molecular Biology, Yamaguchi University Graduate School of Medicine, Ube, Japan
Abstract
The objective of this study was to characterize the genome-wide DNA methylation profiles of isolated endometrial stromal cells obtained from eutopic endometria with (euESCa) and without endometriosis (euESCb) and ovarian endometrial cysts (choESC). Three samples were analyzed in each group. The infinium methylation array identified more hypermethylated and hypomethylated CpGs in choESC than in euESCa, and only a few genes were methylated differently in euESCa and euESCb. A functional analysis revealed that signal transduction, developmental processes, immunity, etc. were different in choESC and euESCa. A clustering analysis and a principal component analysis performed based on the methylation levels segregated choESC from euESC, while euESCa and euESCb were identical. A transcriptome analysis was then conducted and the results were compared with those of the DNA methylation analysis. Interestingly, the hierarchical clustering and principal component analyses showed that choESC were segregated from euESCa and euESCb in the DNA methylation analysis, while no segregation was recognized in the transcriptome analysis. The mRNA expression levels of the epigenetic modification enzymes, including DNA methyltransferases, obtained from the specimens were not significantly different between the groups. Some of the differentially methylated and/or expressed genes (NR5A1, STAR, STRA6 and HSD17B2), which are related with steroidogenesis, were validated by independent methods in a larger number of samples. Our findings indicate that different DNA methylation profiles exist in ectopic ESC, highlighting the benefits of genome wide DNA methylation analyses over transcriptome analyses in clarifying the development and characterization of endometriosis.
Citation:Yamagata Y, Nishino K, Takaki E, Sato S, Maekawa R, et al. (2014) Genome-Wide DNA Methylation Profiling in Cultured Eutopic and Ectopic Endometrial Stromal Cells. PLoS ONE 9(1): e83612. doi:10.1371/journal.pone.0083612
Editor:Osman El-Maarri, University of Bonn, Institut of Experimental Hematology and Transfusion Medicine, Germany
ReceivedAugust 14, 2013;AcceptedNovember 6, 2013;PublishedJanuary 23, 2014
Copyright:ß2014 Yamagata et al. This is an open-access article distributed under the terms of the Creative Commons Attribution License, which permits unrestricted use, distribution, and reproduction in any medium, provided the original author and source are credited.
Funding:This work was supported in part by Grants-in-Aid 21592099, 22591825, 23659781, 23791846 and 23890140 for Scientific Research from the Ministry of Education, Science and Culture, Japan and the New Frontier Project, Yamaguchi University School of Medicine. The funders had no role in study design, data collection and analysis, decision to publish, or preparation of the manuscript.
Competing Interests:The authors have declared that no competing interests exist.
* E-mail: [email protected]
Introduction
Endometriosis, which affects approximate 10% of reproductive-aged females, is defined as the ectopic presence of endometrial-like tissue in the ovaries, retroperitoneum, rectum, etc. It causes chronic pelvic pain, especially during menstruation and inter-course, and infertility. The rate of endometriosis has been increasing and the effects on women’s health and social lives are not negligible. The elucidation of the pathogenesis of endometri-osis is not complete and a better understanding of the molecular mechanisms underlying the aberrant gene expression observed in endometriosis would be of great importance in preventing and establishing effective treatments for this benign yet bothersome disease.
Endometriosis develops in response to sex steroid hormone exposure, such as estrogen exposure, after menarche. Although there is no definitive consensus regarding the histologic origin of endometriosis, several mechanisms have been proposed, including endometrial tissue transplantation, coelomic metaplasia, endome-trial tissue metastasis via veins or lymphatic vessels, stem cell differentiation into endometriotic tissue or a combination of these mechanisms. Only one of these theories is unable to completely
explain all of the phenomena related to the origin of endometriosis observed to date. Sampson has proposed a hypothesis that fragments of menstrual endometrial tissue pass backwards through the fallopian tubes and are implanted onto the surfaces of pelvic organs such as the ovaries and retroperitoneum [1]. While most females experience reverse flow of the menstrual endometrium into the pelvic cavity, Sampson’s implantation hypothesis is still widely accepted and his observations imply that aberrant host immune responses may be involved in the initiation and progression of endometriosis.
signaling pathways compared to eutopic endometria [6]. In spite of these findings, we still face complexity regarding comprehension of the underlying mechanisms of endometriosis.
Epigenetic modification mechanisms are undoubtedly recog-nized as key players in transcriptional regulation, and numerous reports indicate that aberrant modifications may be associated with the onset of various kinds of human diseases. DNA methylation is one of the most important and most studied chemical modifications. Accumulating data suggests that aberrant DNA methylation status may be associated with the molecular features of endometriosis. Previous reports have shown that abnormal promoter methylation occurs in certain genes, such as progesterone receptor B [5], E-cadherin [7], HOXA10 [8], estrogen receptorb[4], steroidgenic factor 1 [2,3] and aromatase [9,10]. These results suggest that epigenetic abnormalities are important in the pathogenesis and development of endometriosis; however, these results do not elucidate to what extent DNA methylation status contributes to endometriosis at the genome-wide level. Genome-genome-wide DNA methylation analysis is an emerging field of research and several methods are available to detect the levels of methylation. We performed the analysis using a microarray-based method that is able to measure the precise levels of DNA methylation. This analysis was accompanied by a transcriptome analysis of isolated and cultured endometrial stromal cells (ESC) obtained from eutopic endometria and ovarian endometrial cysts.
Materials and Methods
This study was reviewed and approved by the Institutional Review Board of Yamaguchi University Graduate School of Medicine. Written informed consent was obtained from the participants before the collection of any samples, and the specimens were irreversibly de-identified. All experiments han-dling human cells and tissues were performed in accordance with Tenets of the Declaration of Helsinki.
Cell culture
Eutopic endometria with and without endometriosis were collected. Endometrial chocolate cysts were also collected. Clinical stages of endometriosis using revised American Fertility Society classification were moderate or severe. ESC were isolated as previously reported with a slight modification [11,12]. The endometrial tissues and chocolate cysts were washed with phenol red-free Dulbecco’s modified Eagle’s medium (DMEM) (Invitro-gen, Paisley, UK) containing Glutamax (Invitrogen), 50mg/ml of
streptomycin (Invitrogen) and 50 IU/ml of penicillin (Invitrogen) and then minced into small pieces measuring,1 mm3. After that, enzymatic digestion of the minced tissues with 0.2% collagenase (Sigma, St. Louis, MO, USA) was performed in a shaking incubator for two hours at 37uC, and then the ESC were separated using filtration through a 70mm nylon mesh. The filtrates were
washed three times. The ESC were seeded in 75 cm2tissue culture flasks and grown until confluence in phenol red-free DMEM containing Glutamax, antibiotics and 10% dextran-coated char-coal-stripped fetal calf serum (Biological Industries, Kibbutz Beit Haemek, Israel) at 37uC in 95% air and 5% CO2. The homogeneity of the isolated ESC preparation was 98%, which was verified by immunocytochemistry using an antibody against vimentin, a specific marker of stromal cells. ESC were similarly cultured after isolation in all experiments of this study. The ESC were collected for analysis five to six days after isolation. If necessary, the cells were subcultured into another 75 cm2 tissue culture flask. Only one successive subculture was done before cell
harvest. The ESC from eutopic endometria without endometri-osis, the ESC from eutopic endometria with endometriosis and the ESC from chocolate cysts were defined as euESCa, euESCb and choESC, respectively.
DNA and RNA isolation
DNA and RNA was isolated from 2–46106 cells using the RNeasy and DNeasy, respectively, from QIAGEN (Valencia, CA, USA) in accordance with the manufacturer’s instructions.
Illumina Infinium HumanMethylation27 BeadChip assay
The DNA methylation analysis was performed using the Illumina infinium assay with the HumanMethylation27 BeadChip (Illumina, San Diego, CA, USA), which interrogates a total of 27,578 CpG sites primarily spread across the proximal promoter regions of transcription start sites of 14,475 consensus coding sequences. Methylated and unmethylated signals were used to compute b-values, which are quantitative scores of the DNA methylation levels, ranging from ‘‘0,’’ thus indicating completely unmethylated, to ‘‘1,’’ indicating completely methylated. The BeadChip was scanned on a BeadArray Reader (Illumina) according to the manufacturer’s instructions. CpG sites with ‘‘detectionpvalues’’.0.05 (computed from the background based on negative controls) were eliminated from further analysis, leaving 27,527 CpGs valid for use with the nine samples tested. The microarray data of DNA methylation is available at the Gene Expression Omnibus Web site (http://www.ncbi.nlm.nih.gov/ geo/) under accession No. GSE47361.
Analysis of DNA methylation data
The methylation data were analyzed using the following tools. Clustering was performed using an NIA array that classifies DNA methylation data by similarity and a principal component analysis (PCA) that detects major components in data variability [13]. To systematically annotate and predict the biological processes and pathways of differentially methylated genes in the euESCa and choESC, we used the following annotation sources: DAVID bioinformatics resources v6.7, PANTHER Classification System and the Kyoto Encyclopedia of Genes and Genomes (KEGG) [14,15]. DAVID was used to determine whether the functional annotation of differentially methylated genes was enriched for specific Gene Ontology (GO) terms and KEGG pathways. Statistical significance was assessed with a modified Fisher’s exact test. p,0.05 (after Benjamini and Hochberg correction for multiple testing) was considered significant enrichment.
Real-time PCR array
gene expression among the analyzed cell groups was defined as at least a 2-fold up- or downregulation of genes withp,0.01.
Transcriptome analysis
To evaluate RNA integrity, a microfluidic analysis was performed using the Agilent 2100 Bioanalyzer with the RNA6000 nano kit (Agilent Technologies, Palo Alto, CA, USA). For the microarray analysis, we used only RNA samples whose RNA integrity number (RIN) was greater than 8.5. Gene expression was analyzed using a GeneChipH Human Gene 1.0 ST Array (Affymetrix, Santa Clara, CA, USA) containing 764,885 probes (and supporting 28,869 genes). Target cDNA was prepared from 200 ng of total RNA with the AmbionHWT Expression kit (Ambion, Austin, TX, USA) and the AffimetrixHGeneChipHWT Terminal Labeling kit (Affymetrix). Hybridization to the micro-arrays, washing, staining and scanning were performed using the GeneChipH system (Affymetrix) composed of the Scanner 3000 7G Workstation Fluidics 450 and the Hybridization Oven 645. The scanned image data were processed using the AffymetrixH Expression ConsoleTM Version 1.1. Fold-change for each gene was evaluated using a Gene Expression Analysis with the PartekH Genomics Suite 6.5 software program (Partech, Mu¨nster, Germany). Genes expressing greater than 2-fold or less than 0.5 were recognized as significantly different. The microarray data of mRNA expression is available at the Gene Expression Omnibus Web site (http://www.ncbi.nlm.nih.gov/geo/) under accession No. GSE47361.
Real-time reverse transcription (RT)-PCR
In the differentially methylated and expressed genes in choESC compared with euESCa, which were extracted by the Infinium 27K BeadsChiP and transcriptome analysis, we focused on the steroidogenesis-related genes, NR5A1, which encodes steroido-genic factor-1 (SF-1), STAR, which encodes steroidosteroido-genic acute regulatory protein, STRA6, which encodes stimulated by retinoic acid 6, and HSD17B2, which encodes 17b-hydroxysteroid dehydrogenase-2. To validate the results of the transcriptome analysis, real-time RT-PCR was conducted on these genes using a larger number of samples, including isolated euESCa (n = 7) and choESC (n = 5), endometrial tissues (n = 17), and chocolate cysts (n = 6).
RT reactions were performed with PrimeScript RT Master Mix (TAKARA, Ohtsu, Japan) according to the manufacturer’s protocol. Briefly, 0.5mg of total RNA was incubated with 4ml
of 56PrimeScript RT Master Mix in 20ml of reaction mixture at
37uC for 15 min, and the reverse transcriptase was inactivated by heating the samples at 85uC for 5 sec. The complementary DNA (cDNA) was immediately used for PCR. All PCR reactions were performed using SYBR Premix Ex Taq (TAKARA) and a LightCycler instrument (Roche Applied Science, Basel, Switzer-land). Briefly, 2ml aliquots containing cDNA were amplified in a
total volume of 20ml containing 4ml of 56SYBR PreMix Ex Taq and 0.2mM of each primer. As an internal control for the
RT-PCR, TATA box-binding protein (TBP) cDNA was also amplified. The following primers were used: NR5A1 (forward, 59- GGA-GTTTGTCTGCCTCAAGTTCA-39, reverse, 59- CGTCTTTC-ACCAGGATGTGGTT-39) (80 bp); STAR (forward, 59- GAA-CCCCAATGTCAAGGAGA-39, reverse, 59- CAGCCAGCT-CGTGAGTAATG-39) (74 bp); STRA6 (forward, 59- TGTTG-GATGAGCTTCAGTGC-39, reverse, 59- TGGTTCCCAG-GAAGAAGATG-39) (85 bp); HSD17B2 (forward, 59- TGGA-ACTGTGGAGGTCACAA-39, reverse, 59- CCACTTGGAAA-GCTCCAGTC-39) (178 bp); TBP (forward, 59 -TGCACAGG-AGCCAAGAGTGAA-39, reverse, 59
-CACATCACAGCTCCC-CACCA-39) (132 bp). The PCR primers for NR5A1 and TBP were synthesized according to a previous report [16,17]. The primers for STAR, STRA6 and HSD17B2 were designed using the Primer3 software program (frodo.wi.mit.edu). Shuttle PCR was performed in 40 cycles as follows: pre-incubation for 10 sec at 95uC, denaturation for 5 sec at 95uC and annealing/extension for 20 sec at 60uC. All samples were run in duplicate. The melting curves of the products were obtained after cycling by a stepwise increase in temperature from 55–95uC. At the end of 40 cycles, the reaction products were separated electrophoretically on an agarose gel and stained with ethidium bromide for visual confirmation of PCR products.
Sodium bisulfite sequencing
The detailed DNA methylation status in NR5A1, STAR, STRA6 and HSD17B2 genes was investigated using the sodium bisulfite sequencing method in a pair of euESCa and choESC from one individual, the samples of which had been also analyzed by the Infinium method. The sodium bisulfite treatment of genomic DNA and the subsequent purification were carried out using EpiTect (QIAGEN) according to the manufacturer’s protocol. The bisulfite modified DNA template was prepared in a 50ml PCR mix using EpiTaq HS (TAKARA). The following
primers were used: NR5A1 (forward, 59- GTAAATGAAGA-GAAATATTAATAAAGAAGG-39, reverse, 59 -AAAAATAAC-AATAAACACCAAAAATCC-39) (252 bp); STAR (forward, 59 -TAGATAAAGTTATTGGYGGGAAAGT-39, reverse, 59- A-AAACAACAACCCAAACCTCTAAC-39) (360 bp); STRA6 re-gion A (forward, 59- TGGGGGAGGAGGTTTTAGTATTAT-39, reverse, 59- CACATATTACCTCCTTCATAAAAACC-39) (287 bp); STRA6 region B (forward, 59- GGAGGAAGGA-GTTGTAGAGATGAA-39, reverse, 59- ACTCCTAACCA-CACCCTTACAAAA-39) (239 bp); HSD17B2 (forward, 59 -AAAATAGAAGGTGTGTGTTTGTGG-39, reverse, 59- ACA-CCTTCAAATACTCAAAACCAA-39) (285 bp). The primer sequences were designed using the Primer3 software program. The primer sets covered the CpG sites analyzed by the Infinium method. All PCR studies were performed for 40 cycles as follows: denaturation for 30 sec at 94uC, annealing for 30 sec at 58uC and extension for 30 sec at 72uC. The PCR products were separated on agarose gels, excised, purified and cloned into the pGEM-T easy vector (Promega, Madison, WI). Recombinant plasmid DNA from the individual bacterial colonies were purified and sequenced to determine the presence of methylated cytosines.
Methylation-sensitive high resolution melting analysis (MS-HRMA)
melting was run in the interval of 72uC to 95uC with 2 sec, 0.1uC steps, acquiring fluorescence data at the Roter-Gene HRM channel. All reactions were run in duplicate.
Statistical analysis
Real-time PCR data were subjected to a Mann-Whitney test. A value ofp,0.05 was considered to be statistically significant. The data are presented as the means6SD.
Results
Genome-wide DNA methylation profiling
As shown in Figure S1, the histograms of each group show very similar distribution patterns.
To identify the CpGs that showed significant methylation changes in the euESCb or choESC relative to the euESCa, the averageb value of each CpG and the differences between each group were calculated. CpGs expressing over 0.2 were then abstracted. 515 CpGs (441 genes) were hypomethylated and 368
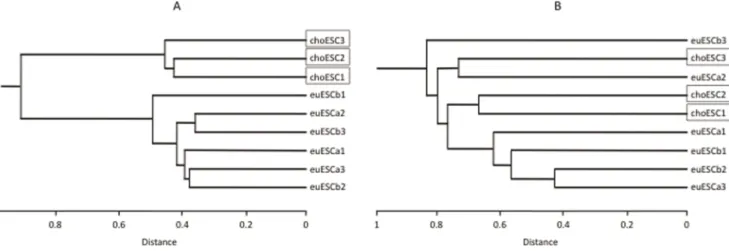
CpGs (329 genes) were hypermethylated in the choESC, while only nine CpGs were hypomethylated and six CpGs were hypermethylated in the euESCb (data not shown). The hierarchi-cal dendrogram was divided in two clusters: choESC and euESC. The euESCa and euESCb were not further subdivided (Figure 1A). These findings were also supported by PCA. PCA clearly separated the choESC cells from eutopic ESC, while no clear separation was observed between the euESCa and euESCb (Figure 2A).
To determine the biological relevance of the differentially methylated genes, GO and KEGG pathways analyses were performed. The differently hypomethylated genes in the choESC, compared to that observed in the euESCa, were related to the biological processes of signal transduction and development and the molecular functions of signaling molecules and cell adhesion molecules. Other significant related terms were detected as illustrated. In the KEGG pathway analysis, genes related to cytokine-cytokine receptor interaction were hypomethylated (Table 1). On the other hand, genes differentially hypermethylated Figure 1. The results of the hierarchical clustering analysis of genome-wide DNA methylation status (A) and the transcriptome analysis (B).A hierarchical dendrogram showing that the choESC samples cluster according to lineage and were separated from the euESC samples in DNA methylation (A), despite the fact that no cluster formations can be recognized in the transcriptome analysis (B).
doi:10.1371/journal.pone.0083612.g001
Figure 2. The results of the principal component analysis of genome-wide DNA methylation status (A) and the transcriptome analysis (B).The closed squares, closed triangles and closed circles represent euESCa, euESCb and choESC, respectively. The PC1 axis clearly distinguished the choESC from the euESC, whereas the euESCa and euESCb were identical in DNA methylation (A). No clear clusters were observed in the transcriptome analysis (B).
in the choESC, compared to that observed in the euESCa, were related to the biological processes of signal transduction and development and the molecular functions of receptors and signaling molecules. In the KEGG pathway analysis, genes related to cytokine-cytokine receptor interaction were also hypermethy-lated (Table 2).
Expression of epigenetic chromatin modification enzymes
The results of the real-time PCR array are shown in Table S1 and Figure S2. If genes inducing more than a 2-fold change andp values of less than 0.01 are significant, then none of the tested genes, including DNA methyltransferases, showed significant differences between the euESCb and euESCa or between the choESC and euESCa.
Transcriptome analysis
Of the 28,869 human genes identified in our gene index, 498 were upregulated and 329 were downregulated in the choESC compared to that observed in the euESCa. Two genes were upregulated and eight genes were downregulated in the euESCb compared to that observed in the euESCa (data not shown).
GO and KEGG pathways analyses were performed as DNA methylation analyses of the selected genes (Table S2 and S3). There are numerous listed terms in both up- and downregulated genes; however, only several terms were concordant with the results of the genome-wide DNA methylation analysis.
Combination of transcriptome and methylation analyses
Hierarchical clustering and PCA were performed on the euESCa and choESC. In the DNA methylation analysis, hierarchical clustering separated the samples of the choESC from the others using filtered genes in the DNA methylation analysis Table 1.Hypomethylation in choESC compred to euESCa.
Biological Process
Term count p-value
Signal transduction 96 0.003088
Developmental processes 72 0.000090
Cell surface receptor mediated signal transduction 54 0.002227
Immunity and defense 46 0.001015
Cell communication 40 0.006518
Transport 38 0.045504
Ectoderm development 34 0.000014
Neurogenesis 32 0.000005
Lipid, fatty acid and steroid metabolism 29 0.003795
Mesoderm development 22 0.010419
Cell adhesion 21 0.038915
Carbohydrate metabolism 20 0.043741
Amino acid metabolism 12 0.011551
Receptor protein tyrosine kinase signaling pathway 10 0.036862
Macrophage-mediated immunity 9 0.011863
Segment specification 8 0.048202
Cytokine/chemokine mediated immunity 7 0.048202
Other lipid, fatty acid and steroid metabolism 5 0.002386
Molecular Function
Term count p-value
Signaling molecule 35 0.000106
Cell adhesion molecule 15 0.044374
Growth factor 9 0.005815
Other cell adhesion molecule 7 0.033738
KEGG pathway
Term count p-value
Cytokine-cytokine receptor interaction 14 0.014843
Melanoma 6 0.033369
Tyrosine metabolism 5 0.024531
Type II diabetes mellitus 5 0.030423
Phenylalanine metabolism 4 0.017268
(Figure 1A). PCA also segregated the samples from the choESC (Figure 2A). Interestingly, neither hierarchical clustering nor PCA showed clear cluster formations using differently expressed genes in the transcriptome analysis (Figure 1B and Figure 2B). In PCA, even after the axes were increased up to 10 with their combination, there was no cluster formation (data not shown). PCA or cluster analysis is the task of grouping a set of objects so that more similar objects are segregated from the other objects by mathematical procedures. Thus, these analyses can visualize the extraneous group in mixed populations, but are not usually used to identify the latent difference. Therefore, the absence of cluster formation of choESC does not mean that there is no difference in gene expression patterns between choESC and euESC. In fact, as shown in Table S2 and S3, there are a number of differentially expressed genes in choESC compared with euESCa.
The comparative analysis of the euESCa and choESC is shown in Table S4, S5, S6 and S7. Correlations between DNA methylation and mRNA expression were observed in 75 filtered genes (22 genes: hypermethylation – low expression, 32 genes: hypomethylation – high expression, 10 genes: hypomethylation –
low expression, 11 genes: hypermethylation – high expression). In some of the combinations, significant GO and KEGG terms were listed.
mRNA expression levels of the NR5A1, STAR, STRA6 and HSD17B2 genes
Of the differentially-methylated and expressed genes in choESC compared with euESCa, we focused on the steroidogenesis-related genes, NR5A1, STAR, STRA6 and HSD17B2. To validate the results of the transcriptome analysis, real-time RT-PCR was conducted on these genes using a larger number of samples, including isolated euESCa (n = 7) and choESC (n = 5), endome-trial tissues (n = 17) and chocolate cysts (n = 6). The NR5A1 mRNA levels were remarkably high in both the choESC and chocolate cysts, whereas NR5A1 mRNA expression was not detected in the euESCa and eutopic endometrium (Figure 3A). The STAR mRNA levels were significantly higher in both the choESC and chocolate cysts than those in the euESCa and eutopic endometrium (Figure 3B). The STRA6 mRNA levels were significantly lower in the choESC than those in the euESCa, Table 2.Hypermethylation in choESC compred to euESCa.
Biological Process
Term count p-value
Signal transduction 78 0.000140
Developmental processes 47 0.010955
Cell surface receptor mediated signal transduction 39 0.008625
Immunity and defense 34 0.003117
Cell communication 30 0.010674
Other receptor mediated signaling pathway 9 0.019354
Cytokine and chemokine mediated signaling pathway 9 0.039747
Blood circulation and gas exchange 6 0.010895
Molecular Function
Term count p-value
Receptor 38 0.008257
Signaling molecule 22 0.017587
Cytoskeletal protein 21 0.046184
Extracellular matrix 15 0.003210
Defense/immunity protein 13 0.013327
Serine protease inhibitor 8 0.000282
Immunoglobulin receptor family member 8 0.002151
Protease inhibitor 8 0.005002
Cytokine receptor 5 0.047735
Non-receptor tyrosine protein kinase 4 0.027526
Other ion channel 4 0.033505
KEGG pathway
Term count p-value
Cytokine-cytokine receptor interaction 12 0.004707
Apoptosis 7 0.03516
Insulin signaling pathway 7 0.027340
Hematopoietic cell lineage 6 0.015370
Lists of statistically significant GO terms (Biological process and molecular function) and KEGG pathway terms in hypomethylated genes (Table 1) and in hypermethylated genes (Table 2) in choESC compared to euESCa.
and there were no significant differences between the levels in the eutopic endometrium and chocolate cysts (Figure 3C). The HSD17B2 mRNA levels were significantly lower in both the choESC and chocolate cysts than those in the euESCa and eutopic endometrium (Figure 3D). These results were consistent with the data obtained from the transcriptome analysis.
DNA methylation analysis of the NR5A1, STAR, STRA6 and HSD17B2 genes
The DNA methylation status in the genomic regions of the NR5A1, STAR, STRA6 and HSD17B2 genes was investigated by the sodium bisulfite sequencing method (Figure 4). In NR5A1 and STAR, the CpG sites were hypomethylated in choESC compared to euESCa (Figure 4A and 4B), whereas the CpG sites in STRA6 and HSD17B2 were hypermethylated (Figure 4C and 4D). These results were consistent with the data from the Infinium analysis.
We further analyzed the DNA methylation status on these genes by MS-HRMA (Figure 5). NR5A1 and STAR showed hypo-methylation in choESC compared with euESCa (Figure 5A and 5B), which was consistent with the results of the Infinium results. However, the STRA6 gene showed hypermethylation in choESC compared with euESCa, with a few exceptions (Figure 5C), which was also consistent with Infinium results. In HSD17B2, the DNA methylation status varied among individuals in both euESCa and choESC (Figure 5D). We speculate that there may be several
explanations for the discrepancy between the Infinium and HRMA results. First, the HSD17B2 primer set used for MS-HRMA only covers two CpGs, which may result in difficulties detecting significant differences between two samples. Second, the PCR-amplified region was located in the first intron. This region might not be important with regard to the gene expression, and there is a possibility that the DNA methylation status in this region may be mutable, depending on each individual. Therefore, these results are reasonable.
Discussion
Recently, Borghese B. et al. reported genome-wide DNA methylation profiling in several subtypes of endometriotic tissues, using MeDIP-chip technology to focus on promoters [20]. They showed that numerous methylation differences exist compared to eutopic endometria, and their reports provide meaningful new information regarding epigenetic status using precious clinical materials. Meanwhile, our experimental strategy is aimed at revealing more precise genome-wide DNA methylation profiles using the Infinium Beadchip in cultured homogeneous endome-trial stromal cells derived from both eutopic endometria with or without endometriosis and ovarian endometrial cysts.
In comparison with eutopic ESC, numerous CpGs in choESC obtained from endometrial cysts are methylated differently, both Figure 3. The mRNA levels of NR5A1 (A), STAR (B), STRA6 (C) and HSD17B2 (D) in ESCa, choESC, eutopic endometrium and chocolate cysts.ESCa (n = 7), choESC (n = 5), eutopic endometria (n = 17) and chocolate cysts (n = 6) were subjected to total RNA isolation followed by real-time RT-PCR. The relative mRNA expression normalized to that of TBP (an internal control) was calculated. The values are the means6SD. *, p,0.01. ND: not detected.
high and low. Based on the data obtained from the methylation profiles, we determined the specific functions in the choESC using a robust in silico analysis. According to the GO and pathway analyses using the filtered genes, interesting terms occupy the top of these lists in terms of the pathogenesis and development of endometriosis. Namely, there is aberrant epigenetic status in the genes associated with receptors, signaling pathways and immune responses, which suggests that choESC express aberrant behavior in peritoneal circumstances. It is also interesting that choESC indicated abnormal differentiation, such as neurogenesis, with the lowestpvalue. This means choESC has already differentiated into other cell types, and choESC have intriguing footprints that imply the presence of abnormal developmental processes. Despite the fact that not all of the terms were identical in the DNA methylation and transcriptome analyses, many of the terms were commonly different. Therefore, the results of these analyses raise the possibility that epigenetic modification of DNA may be involved in the pathogenesis of endometriosis.
We also investigated the differences regarding genome-wide DNA methylation and transcriptome analyses between eutopic ESCs with and those without endometriosis. Researchers have described that eutopic endometria from endometriotic females have different characteristics than eutopic endometria from non-affected females in terms of inflammation, steroidogenesis [21], migratory behavior [22] and sensitivity to apoptosis [23]. On the contrary, our study did not find any meaningful differences. A small number of candidate genes expressed different values (data not shown); however, known important genes associated with steroidogenesis, inflammation and apoptosis were not included. One of the novelties of this study is that primary cultured ESC was used for analysis. After ESC was isolated and cultured for several days, DNA methylation status and mRNA expression levels were analyzed. We speculate that influences by the pelvic environment may have been removed by in vitro culture. In other words, aberrant gene expression in eutopic ESC with endometriosis may be rather due to the influence by pelvic inflammatory environment Figure 4. The results of the sodium bisulfite sequencing analyses of NR5A1 (A), STAR (B), STRA6 (C) and HSD17B2 (D) in the euESCa and choESC samples.The DNA methylation profile in the genomic regions of the NR5A1, STAR, STRA6 and HSD17B2 genes was analyzed by a sodium bisulfite sequencing method in a pair of euESCa and choESC from one individual, which had already been analyzed by the Infinium method. In NR5A1 and STRA6, the DNA methylation status of the proximal promoter and first exon was analyzed. The primer pairs BP-A and BP-B amplify region A and B, respectively, in STRA6. In STAR, the distal promoter region was analyzed. In HSD17B2, the first intron and second exon region were analyzed. The arrows indicate the positions of the bisulfite primers. Closed triangles represent the CpG sites analyzed by the Infinium method, and are accompanied by the identification names.
than due to aberrant DNA methylation or gene mutations. This may be also supported by our result that there was no clear difference in DNA methylation status between eutopic ESC with and without endometriosis.
Of the various differentially methylated and/or expressed genes in choESC compared with eutopic ESC, we focused on the steroidogenesis-related genes, NR5A1, STAR, STRA6 and HSD17B2. A further analysis of the mRNA expression by real-time RT-PCR in these genes validated the accuracy of the results of the transcriptome analysis using a larger number of samples. Interestingly, the aberrant expression of these steroidogenesis-related genes in choESC led us to speculate a possible mechanism of pathogenesis for endometriosis, wherein estradiol synthesis is locally enhanced within the endometriotic tissue. Remarkably high mRNA expression and DNA hypomethylation in the NR5A1 gene, encoding SF-1, was found in the choESC and chocolate cysts in this study, which is consistent with the previous reports [2,24]. Since
SF-1 is a transcription factor that induces the expression of STAR and cyp19a1, which encode aromatase, the high SF-1 expression may have contributed to the high mRNA expression of STAR and cyp19a1 in the choESC and chocolate cysts. Higher cyp19a1 mRNA expression in choESC was found in the transcriptome analysis of this study (data not shown). In addition, our results showed that there was low expression of the STRA6 and HSD17B2 genes in the choESC and chocolate cysts. Pavone et al. also reported that low expression of STRA6 in endometriotic stromal cells is associated with a reduced amount of active retinoic acids, which in turn, decreases the HSD17B2 expression in endometriotic epithelial cells [25]. STRA6 is an essential cell surface receptor for retinol binding protein, and is necessary for the retinol uptake into cells. HSD17B2 converts estradiol into estrone. Thus, low expression of STRA6 and HSD17B2 results in the enhanced endogeneous synthesis of estradiol. Regarding the mechanism responsible for the locally enhanced estradiol synthesis in the endometriotic lesion, Figure 5. The DNA methylation status as determined by the methylation-sensitive high resolution analyses (MS-HRMA) of NR5A1 (A), STAR (B), STRA6 (C) and HSD17B2 (D) in euESCa and choESC.Sample No. 1, 6, 7 were analyzed for genome-wide DNA methylation and transpciptome as euESCa, and sample No. 8, 9, 10 were also analyzed as choESC. Sample No. 1 and 10 were analyzed for bisulfite sequencing as euESCa and choESC, respectively. The confidence value calculated by MS-HRMA indirectly indicates the DNA methylation level. The DNA methylation status of euESCa-1 was shown as 100% identical with regard to the DNA methylation. The confidence values of each sample were calculated in comparison with euESCa-1. In NR5A1 and STAR, the confidence values were lower in choESC than those in euESCa, indicating that the choESC are hypomethylated compared with the euESCa. In STRA6 and HSD17B2, the DNA methylation status of euESCa-1 was shown as2100% (arbitrary defined reverse axis value) identical regarding DNA methylation, indicating a DNA hypomethylation status. In STRA6, the confidence values were higher in choESC than those in euESCa, indicating that the choESC are hypermethylated compared with the euESCa. In HSD17B2, the DNA methylation status varied among individuals with euESCa and choESC. The samples of euESCa and choESC were isolated from seven and six patients, respectively.
besides the report by Blun et al. showing that increased SF-1 expression was induced by aberrant DNA hypomethylation in the SF-1 promoter region, which causes aberrant aromatase expression, the present study proposed additional mechanisms; aberrant DNA hypomethylation in the NR5A1 gene encoding SF-1, and aberra-tion of retinoic acid metabolism, which is due to the low STRA6 expression induced by aberrant DNA hypermethylation. Taken together, the aberrant expression of these steroidogenesis-related genes causes enhanced estradiol synthesis within the endometriotic tissue, which is involved in the development of endometriosis. A further analysis of the DNA methylation by independent methods on these genes validated the accuracy of the array-based results of the Infinium method using a larger number of samples. NR5A1 and STAR showed DNA hypomethylation, and STRA6 and HSD17B2 showed hypermethylation in the choESC samples compared with the euESCa samples. These findings were consistent with the Infinium results, suggesting that aberrant DNA methylation in the key steroidogenesis-related genes causes aberrant gene expression, leading to the development of endometriosis.
The characterization of eutopic and ectopic ESC using clustering analysis and PCA provides interesting information. Both analyses showed that choESC were clearly segregated from eutopic ESC in the DNA methylation analysis, although no clear segregation was observed in the transcriptome analysis. The same analyses were also performed using transcriptome data previously reported by Borghese B. and Eyster KM. [6,26]. Interestingly we could not find any separation of ectopic endometrial from eutopic ones in both data (data not shown), which is in agreement with our result. These findings indicate the significance of DNA methylation analysis for the identification of endometriotic cells. To elucidate the mechanisms underlying the development of endometriosis, genome-wide DNA methylation analysis might be a superior approach to transcriptome analysis. Although transplan-tation theory is most acceptable so far in pathogenesis of endometriosis, we speculate coelomic metaplasia theory is not preclusive according to out observations. It may not be plausible for endometrial differentiated cells to initiate self-regenerating accompanied by the DNA methylation alteration.
Epigenetic marks are rewritable by a series of enzymes that modify histones and DNA. With regard to DNA methylation, transmethylation is directly performed by DNA methyltransferases (Dnmts). Wu et al. described the presence of elevated Dnmt1, Dnmt3a and Dnmt3b in the epithelial components of endometri-otic implants compared to that observed in eutopic endometria without endometriosis [27]. On the other hand, only Dnmt3a was found to be upregulated in eutopic endometria in females with endometriosis compared to that observed in endometriosis-free females. The results of their investigation suggest that hyper-methylation may frequently occur in the epithelium in endome-triosis. Of interest, they also depicted the protein expression contrasts between epithelial and stromal cells in eutopic and ectopic endometria using immunostaining, and the Dnmts expression levels were found to be much lower in the ESC than the endometrial epithelial cells. In our experiment, the quantita-tive PCR array-based method showed no statistically significant differences in Dnmts mRNA expression between eutopic ESC with and those without endometriosis or between eutopic and ectopic ESC. Since, as is widely recognized, the recruitment of Dnmts onto target genomic sites is more important than its expression level, abnormal DNA methylation should occur in situations without aberrant Dnmts expression. Meanwhile, histone modification enzyme expression, which provides other critical epigenetic memories, also showed no differences between groups.
Observations of the relationship between the DNA methylation profiles and transcriptome analyses disclosed not only the expected positive correlations (hypermethylation/low expression and hypo-methylation/high expression), but also some negative correlations (hypermethylation/high expression and hypomethylation/low expression). To describe the intimate association between DNA methylation and mRNA expression is impossible because the specification of the Beadchip covers only approximately half of the genes and analyzes only two CpGs in one gene. There may be complicated interactions and networks between DNA methylation and transcription in genome-wide level observations.
In summary, this study provided fundamental DNA methyla-tion data concerning endometriosis using non-treated cultured ESC. It is appealing to establish wider profiles of whole epigenomes, including both DNA methylation and histone modifications. We believe that this type of novel information would be useful for future research regarding therapeutic strategies and preventative medicine for treating endometriosis.
Supporting Information
Figure S1 Histograms of the b values for the euESCa (open column), euESCb (shaded column) and choESC (closed column).
(TIF)
Figure S2 A volcano plot of thepvalues correlated with the fold changes in gene expression in the euESCb (A) and choESC (B) relative to the euESCa, as measured using qRT-PCR.The open circles represent DNA methyltransferases. (TIF)
Table S1 Of the 84 genes, genes expressing greater than 2-fold or less than 0.5 were not recognized except KATB2 in transcriptome analysis using GeneChip. GeneChip analysis revealed KAT2B expression in choESC was 2.55-fold higher (p,0.0034) compared to euESCa.
(DOCX)
Table S2 Lists of statistically significant GO terms (biological process and molecular function) and KEGG pathway terms in high expressed genes in choESC compared to euESCa.
(DOCX)
Table S3 Lists of statistically significant GO terms (biological process and molecular function) and KEGG pathway terms in low expressed genes in choESC compared to euESCa.
(DOCX)
Table S4 Lists of genes that have significant hyper-methylated CpGs with significant low mRNA expres-sions in choESC compared to euESCa.The significant GO terms were shown below the gene lists.
(DOCX)
Table S5 Lists of genes that have significant hypo-methylated CpGs with significant high mRNA expres-sions in choESC compared to euESCa.The significant GO and KEGG pathway terms were shown below the gene lists. (DOCX)
Table S6 Lists of genes that have significant hypo-methylated CpGs with significant low mRNA expres-sions in choESC compared to euESCa.The significant GO terms were shown below the gene lists.
Table S7 Lists of genes that have significant hyper-methylated CpGs with significant high mRNA expres-sions in choESC compared to euESCa.
(DOCX)
Author Contributions
Conceived and designed the experiments: YY. Performed the experiments: YY ET AN. Analyzed the data: KN SS RM. Wrote the paper: YY NS.
References
1. Sampson J (1927) Peritoneal endometriosis due to the menstrual dissemination of endometrial tissue into the peritoneal cavity. Am J Obstet Gynecol 14: 422– 469.
2. Xue Q, Lin Z, Yin P, Milad MP, Cheng YH, et al. (2007) Transcriptional activation of steroidogenic factor-1 by hypomethylation of the 59CpG island in endometriosis. J Clin Endocrinol Metab 92: 3261–3267.
3. Xue Q, Zhou YF, Zhu SN, Bulun SE (2011) Hypermethylation of the CpG island spanning from exon II to intron III is associated with steroidogenic factor 1 expression in stromal cells of endometriosis. Reprod Sci 18: 1080–1084. 4. Xue Q, Lin Z, Cheng YH, Huang CC, Marsh E, et al. (2007) Promoter
methylation regulates estrogen receptor 2 in human endometrium and endometriosis. Biol Reprod 77: 681–687.
5. Wu Y, Strawn E, Basir Z, Halverson G, Guo SW (2006) Promoter hypermethylation of progesterone receptor isoform B (PR-B) in endometriosis. Epigenetics 1: 106–111.
6. Borghese B, Mondon F, Noel JC, Fayt I, Mignot TM, et al. (2008) Gene expression profile for ectopic versus eutopic endometrium provides new insights into endometriosis oncogenic potential. Mol Endocrinol 22: 2557–2562. 7. Wu Y, Starzinski-Powitz A, Guo SW (2007) Trichostatin A, a histone
deacetylase inhibitor, attenuates invasiveness and reactivates E-cadherin expression in immortalized endometriotic cells. Reprod Sci 14: 374–382. 8. Wu Y, Halverson G, Basir Z, Strawn E, Yan P, et al. (2005) Aberrant
methylation at HOXA10 may be responsible for its aberrant expression in the endometrium of patients with endometriosis. Am J Obstet Gynecol 193: 371– 380.
9. Izawa M, Harada T, Taniguchi F, Ohama Y, Takenaka Y, et al. (2008) An epigenetic disorder may cause aberrant expression of aromatase gene in endometriotic stromal cells. Fertil Steril 89: 1390–1396.
10. Izawa M, Taniguchi F, Uegaki T, Takai E, Iwabe T, et al. (2011) Demethylation of a nonpromoter cytosine-phosphate-guanine island in the aromatase gene may cause the aberrant up-regulation in endometriotic tissues. Fertil Steril 95: 33–39. 11. Sugino N, Kashida S, Takiguchi S, Nakamura Y, Kato H (2000) Induction of superoxide dismutase by decidualization in human endometrial stromal cells. Mol Hum Reprod 6: 178–184.
12. Iwabe T, Harada T, Tsudo T, Nagano Y, Yoshida S, et al. (2000) Tumor necrosis factor-alpha promotes proliferation of endometriotic stromal cells by inducing interleukin-8 gene and protein expression. J Clin Endocrinol Metab 85: 824–829.
13. Sharov AA, Dudekula DB, Ko MS (2005) A web-based tool for principal component and significance analysis of microarray data. Bioinformatics 21: 2548–2549.
14. Huang da W, Sherman BT, Lempicki RA (2009) Systematic and integrative analysis of large gene lists using DAVID bioinformatics resources. Nat Protoc 4: 44–57.
15. Mi H, Lazareva-Ulitsky B, Loo R, Kejariwal A, Vandergriff J, et al. (2005) The PANTHER database of protein families, subfamilies, functions and pathways. Nucleic Acids Res 33: D284–288.
16. Lucki NC, Bandyopadhyay S, Wang E, Merrill AH, Sewer MB (2012) Acid ceramidase (ASAH1) is a global regulator of steroidogenic capacity and adrenocortical gene expression. Mol Endocrinol 26: 228–243.
17. Yamagata Y, Asada H, Tamura I, Lee L, Maekawa R, et al. (2009) DNA methyltransferase expression in the human endometrium: down-regulation by progesterone and estrogen. Hum Reprod 24: 1126–1132.
18. Wojdacz TK, Dobrovic A, Hansen LL (2008) Methylation-sensitive high-resolution melting. Nat Protoc 3: 1903–1908.
19. Dimitrakopoulos L, Vorkas PA, Georgoulias V, Lianidou ES (2012) A closed-tube methylation-sensitive high resolution melting assay (HS-HRMA) for the semi-quantitative determination of CST6 promoter methylation in clinical samples. BMC Cancer 12: 486.
20. Borghese B, Barbaux S, Mondon F, Santulli P, Pierre G, et al. (2010) Research resource: genome-wide profiling of methylated promoters in endometriosis reveals a subtelomeric location of hypermethylation. Mol Endocrinol 24: 1872– 1885.
21. Bulun SE (2009) Endometriosis. N Engl J Med 360: 268–279.
22. Gentilini D, Vigano P, Somigliana E, Vicentini LM, Vignali M, et al. (2010) Endometrial stromal cells from women with endometriosis reveal peculiar migratory behavior in response to ovarian steroids. Fertil Steril 93: 706–715. 23. Harada T, Kaponis A, Iwabe T, Taniguchi F, Makrydimas G, et al. (2004)
Apoptosis in human endometrium and endometriosis. Hum Reprod Update 10: 29–38.
24. Attar E, Tokunaga H, Imir G, Yilmaz MB, Redwine D, et al. (2009) Prostaglandin E2 via steroidogenic factor-1 coordinately regulates transcription of steroidogenic genes necessary for estrogen synthesis in endometriosis. J Clin Endocrinol Metab 94: 623–631.
25. Pavone ME, Dyson M, Reirstad S, Pearson E, Ishikawa H, et al. (2011) Endometriosis expresses a molecular pattern consistent with decreased retinoid uptake, metabolism and action. Hum Reprod 26: 2157–2164.
26. Eyster KM, Klinkova O, Kennedy V, Hansen KA (2007) Whole genome deoxyribonucleic acid microarray analysis of gene expression in ectopic versus eutopic endometrium. Fertil Steril 88: 1505–1533.