Mammalian Cells: Evidence for Ca
2
+
i
-Independent
Excitation-Transcription Coupling
Svetlana V. Koltsova1,2, Yulia Trushina3, Mounsif Haloui1, Olga A. Akimova2,3, Johanne Tremblay1,4, Pavel Hamet1,4, Sergei N. Orlov1,4*
1Centre de recherche, Centre hospitalier de l’Universite´ de Montre´al (CRCHUM) – Technopoˆle Angus, Montreal, PQ, Canada,2Institute of General Pathology and Pathophysiology, Russian Academy of Medical Sciences, Moscow, Russia,3Faculty of Biology, M.V. Lomonosov Moscow State University, Moscow, Russia,4Department of Medicine, Universite´ de Montre´al, Montreal, PQ, Canada
Abstract
Stimulus-dependent elevation of intracellular Ca2+([Ca2+]i) affects the expression of numerous genes – a phenomenon
known as excitation-transcription coupling. Recently, we found that increases in [Na+]itriggerc-Fosexpression via a novel
Ca2+
i-independent pathway. In the present study, we identified ubiquitous and tissue-specific [Na+]i/[K+]i-sensitive transcriptomes by comparative analysis of differentially expressed genes in vascular smooth muscle cells from rat aorta (RVSMC), the human adenocarcinoma cell line HeLa, and human umbilical vein endothelial cells (HUVEC). To augment [Na+]
i and reduce [K+]
i, cells were treated for 3 hrs with the Na+,K+-ATPase inhibitor ouabain or placed for the same time in the K+ -free medium. Employing Affymetrix-based technology, we detected changes in expression levels of 684, 737 and 1839 transcripts in HeLa, HUVEC and RVSMC, respectively, that were highly correlated between two treatments (p,0.0001; R2.0.62). Among these Na+
i/K+i-sensitive genes, 80 transcripts were common for all three types of cells. To establish if changes in gene expression are dependent on increases in [Ca2+]
i, we performed identical experiments in Ca2+-free media supplemented with extracellular and intracellular Ca2+chelators. Surprisingly, this procedure elevated rather than decreased
the number of ubiquitous and cell-type specific Na+
i/K+i-sensitive genes. Among the ubiquitous Na+i/K+i-sensitive genes whose expression was regulated independently of the presence of Ca2+ chelators by more than 3-fold, we discovered
several transcription factors (Fos, Jun, Hes1, Nfkbia), interleukin-6, protein phosphatase 1 regulatory subunit, dual specificity phosphatase (Dusp8), prostaglandin-endoperoxide synthase 2, cyclin L1, whereas expression of metallopeptidaseAdamts1, adrenomedulin,Dups1, Dusp10andDusp16was detected exclusively in Ca2+-depleted cells. Overall, our findings indicate
that Ca2+i-independent mechanisms of excitation-transcription coupling are involved in transcriptomic alterations triggered
by elevation of the [Na+]i/[K+]iratio. There results likely have profound implications for normal and pathological regulation
of mammalian cells, including sustained excitation of neuronal cells, intensive exercise and ischemia-triggered disorders.
Citation:Koltsova SV, Trushina Y, Haloui M, Akimova OA, Tremblay J, et al. (2012) Ubiquitous [Na+]
i/[K+]i-Sensitive Transcriptome in Mammalian Cells: Evidence
for Ca2+
i-Independent Excitation-Transcription Coupling. PLoS ONE 7(5): e38032. doi:10.1371/journal.pone.0038032
Editor:Yoshiaki Tsuji, North Carolina State University, United States of America
ReceivedFebruary 27, 2012;AcceptedApril 29, 2012;PublishedMay 29, 2012
Copyright:ß2012 Koltsova et al. This is an open-access article distributed under the terms of the Creative Commons Attribution License, which permits unrestricted use, distribution, and reproduction in any medium, provided the original author and source are credited.
Funding:Canadian Institutes of Health Research - http://www.cihr-irsc.gc.ca (MOP-62696 and 81392); Kidney Foundation of Canada - http://www.kidney.ca; Russian Foundation for Fundamental Research http://www.rfbr.ru/ (090400646A); the grant of the President of the Russian Federation for young investigators -http://grants.extech.ru (MK-4641-2011.4). The funders had no role in study design, data collection and analysis, decision to publish, or preparation of the manuscript.
Competing Interests:The authors have declared that no competing interests exist.
* E-mail: sergei.n.orlov@umontreal.ca
Introduction
Gene expression is regulated by diverse stimuli to achieve tissue-specific functional responses via coordinate synthesis of the cell’s macromolecular components [1]. Electrochemical gradients of monovalent cations across the plasma membrane (high intracel-lular potassium, [K+
]i vs low intracellular sodium, [Na+]i) are
created by the Na+
,K+
-pump and determine a large variety of physiologically important processes. These processes include maintenance of resting and action electrical membrane potentials, regulation of cell volume, secondary transport of mono- and divalent ions (such as chloride, calcium and phosphate), and accumulation of nutrients (glucose, amino acids, nucleotides) and other relevant molecules [2]. More recent studies demonstrated that side-by-side with the above-listed ‘‘classic’’ Na+
i,K+i
-depen-dent cellular processes, sustained elevation of the [Na+] i/[K+]i
ratio in vascular smooth muscle cells, cardiomyocytes, hepatocytes, renal epithelial and neuronal cells causes differential expression of
c-Fosand other immediate response genes (IRG), as well as cell type-specific late response genes, such as tumour growth factor-b, thea1- andb1-subunits of Na+,K+-ATPase, myosin light chain,
skeletal muscle actin, atrial natriuretic factor and mortalin (for review see [3–5]).
According to the generally accepted paradigm Na+
i/K+i
-sensitive mechanism of excitation-transcription coupling is driven by changes in intracellular [Ca2+
] and activation of several Ca2+
-sensitive pathways – a phenomenon termed excitation-transcrip-tion coupling [6–8]. Indeed, it is well-documented that elevaexcitation-transcrip-tion of the [Na+
]i/[K+]iratio typically leads to increases in [Ca2+]i via
activation of the Na+
/Ca2+
Ca2+
channels [10]. It has also been shown that promoters of numerous genes including c-Foscontain serum response element (SRE) and Ca2++cAMP response element (CRE) activated by
[Ca2+
] increments in the cytoplasm and nucleus, respectively [11]. In contrast to the aforementioned mechanistic view, we found that in vascular smooth muscle cells from the rat aorta (RVSMC) and the human adenocarcinoma cell line (HeLa) the ouabain-induced changes in the c-Fos expression were preserved in the presence of Ca2+
channel blockers and extra- and intracellular Ca2+
chelators [12,13]. These results made us conclude that along with canonical Ca2+
i-mediated signaling, sustained elevation of the
[Na+
]i/[K+]iratio affects gene transcription via unknown Ca2+i
-independent mechanism(s) [4]. In the present study, we deployed Affymetrix technology to characterize the relative impact of Ca2+
i
-mediated and -independent signaling on changes in gene expression triggered by sustained elevation of the [Na+
]i/[K+]i
ratio. To accomplish this goal, we compared transcriptomes in 3 different cell types treated with 2 distinct Na+,K+-ATPase
inhibitors in the absence and presence of Ca2+
chelators. Our results strongly indicate that, in mammalian cells, Ca2+
i
-indepen-dent pathways contribute to ubiquitous and cell type-specific transcriptomic alterations triggered by elevation of the [Na+
]i/
[K+
]iratio.
Results
Effect of ouabain and K+-free medium on the [Na+]
i/[K+]i
ratio and cell viability
Figure 1 illustrates that 3-hr inhibition of the Na+,K+-ATPase
by ouabain in HeLa, human umbilical vein endothelial cells
(HUVEC) and RVSMC increased Na+
icontent from,50 to 400–
600 nmol/mg protein and decreased K+
i from 600–800 to
,100 nmol/mg protein. In RVSMC the action of K+-free
medium on the [Na+
]i/[K+]i ratio was similar, whereas in
HUVEC and HeLa cells the gain of Na+
iand the loss of K+i
triggered by K+
-free medium were higher compared to ouabain by
,20% by ,50%, respectively. Importantly, in all type of cells
exposed to K+-free medium, the intracellular content of
monova-lent cations was not significantly affected by the addition of ouabain (Fig. 1). The control experiments demonstrated that 4 hr treatment with ouabain or K+
-free medium as well as the addition
of 50mM EGTA and 10mM BATPA-AM in Ca2+-free medium
did not impact HeLa, HUVEC and RVSMC survival, as determined by lactate dehydrogenase (LDH) release, caspase-3 activity and chromatin cleavage assay (Table 1).
Effects of ouabain and K+-free medium on gene
expression profile
Together with elevation of the [Na+]
i/[K+]iratio, ouabain and
K+
-free medium may affect cells independently of suppression of Na+
,K+
-ATPase-mediated ion fluxes. Thus, recent studies have revealed that ouabain triggered interaction of the Na+
,K+
-ATPase
a-subunit with the membrane-associated nonreceptor tyrosine kinase Src, activation of Ras/Raf/ERK1,2, phosphatidyl inositol 3-kinase (PI(3)K), PI(3)K-dependent protein kinase B, phospholi-pase C, [Ca2+]
i oscillations and augmented production of the
reactive oxygen species (for review, see [14,15]). On the other hand, the transfer of highly K+
-permeable cells to K+
-free medium results in transient membrane hyperpolarization, affecting the activity of diverse voltage-sensitive membrane-bound proteins [16,17]. Considering this, we compared the actions of ouabain and K+-free medium on gene expression profiles in HUVEC, RVSMC
and HeLa cells with a final goal of identifying ubiquitous and cell type-specific Na+
i,K+i-sensitive transcriptomes.
The data obtained in 4 independent experiments were normalized and then analyzed by principal component analysis (PCA) [18]. Each point on the PCA represents the gene expression profile of an individual sample. Samples that are near each other in the resulting 3-dimensional plot have a similar transcriptome while those that are further apart have dissimilar transcriptional profiles. This approach identified treatments with ouabain and K+
-free medium as major sources of variability within datasets (Fig. 2A).
Figure 2B disclosed that the total numbers of differentially-expressed transcripts in HeLa, HUVEC and RVSMC treated for 3 hr with ouabain were 819, 886 and 3199, whereas inhibition of the Na+,K+-ATPase in K+-free medium altered the expression of
3078, 2858 and 3677 transcripts, respectively. In all types of cells, the number of up- and down regulated genes affected by these stimuli was about the same, whereas maximal fold of activation and suppression was 65 and 24, respectively (Table 2). The decreased number of differentially expressed transcripts detected in ouabain-treated HUVEC and HeLa cells, compared to RVSMC, can be explained by retarded kinetics of elevation of [Na+
]i in treated human cells compared to
ouabain-treated RVSMC (Fig. 3A) and cells subjected to Na+
,K+
-ATPase inhibition in K+-free medium (Fig. 3B). This observation is
consistent with the slow kinetics of ouabain interaction with the human house-keepinga1 Na+
,K+
-ATPase isoform demonstrated in early investigations [19].
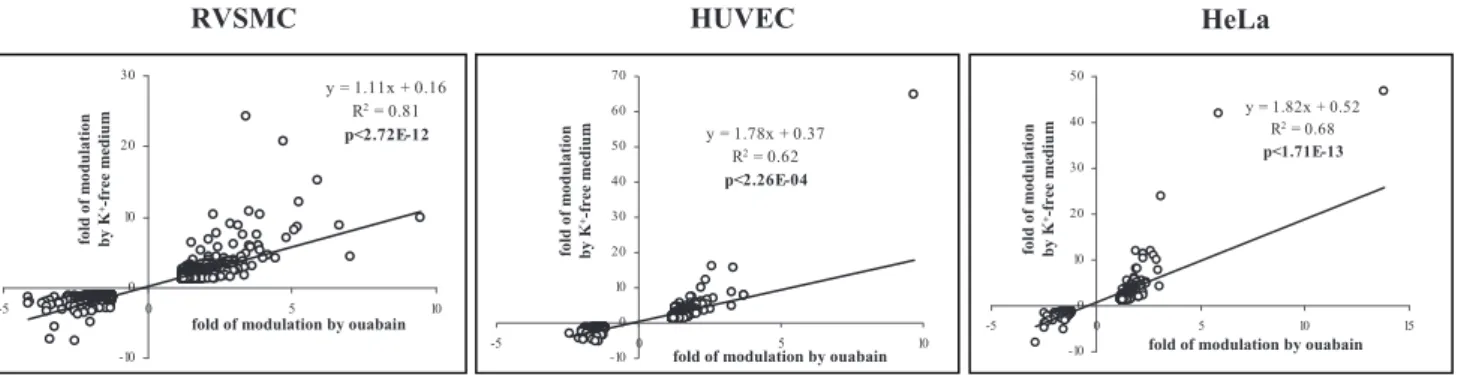
Further analysis determined that the expression of 684, 737 and 1839 transcripts in HeLa, HUVEC and RVSMC, respectively, was affected by both stimuli (Fig. 2B). Importantly, we observed highly significant (p,0.0003) and positive (R2.0.62) correlations between levels of differentially expressed transcripts identified in the presence of ouabain and K+-free medium (Fig. 4). Because the
gain of Na+
iand loss of K+iin cells treated with ouabain and K+
-free medium are similar (Fig. 1), the results strongly suggest that the changes in gene expression evoked by both stimuli occur in response to elevation of the [Na+]
i/[K+]iratio rather than due to
Na+
i,K+i-independent events. Considering this, we classified
Na+
i,K+i-sensitive transcriptomes as sets of genes whose expression
was impacted by both ouabain and K+-free medium.
To confirm the ability of microarrays to resolve the differences in expression levels, we selected several Na+
i/K+i-sensitive genes
(Egr1, Ptgs2andPpp1r15a) for additional validation by quantitative reverse transcription polymerase chain reaction (qRT-PCR) analysis. These experiments revealed highly significant correla-tions between the RT-PCR results and the validated microarray data (R2= 0.94, p,0.0000002; Fig. 5).
Ubiquitous Na+
i,K+i-sensitive transcriptome
Among the Na+
i,K+i-sensitive genes detected in HeLa, HUVEC
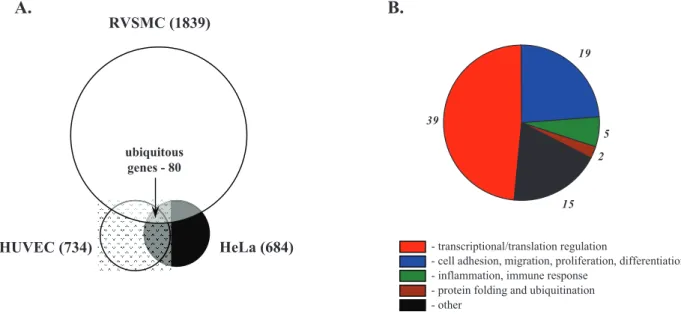
and RVSMC, we identified 80 common genes, i.e. genes whose differential expression was increased or decreased by both ouabain and K+
-free medium by at least 1.2-fold (p,0.05) in all 3 cell types (Fig. 6A). We noted that the list of ubiquitous Na+
i,K+i-sensitive
transcriptome was enriched with genes involved in the regulation of transcription/translation (49%), cell cycle, adhesion and migration (24%), and inflammatory and immune responses (6%) (Table 3, Fig. 6B).
Ubiquitous Na+
i/K+i-sensitive genes, whose expression was
hormone-retinoid receptor superfamilyNr4a2and the basic helix-loop-helix transcription regulatorHes1.NfkbizandNfkbiaare transcriptional regulators of genes encoding intermediates of inflammation whereas interleukin 6 (Il6) is a potent controller of the acute
inflammatory response phase. Prostaglandin-endoperoxide syn-thase 2 (Ptgs2) also known as cyclooxygenase-2 is a key enzyme in the biosynthesis of prostaglandins implicated in inflammatory responses and mitogenesis. Na+
i/K+i-sensitive regulators of cell Figure 1. Effect of ouabain and K+-free medium on intracellular Na+(a–c) and K+(d–f) content in HeLa (a,d), HUVEC (b,e) and RVSMC
(c,f).Cells were incubated in control or K+
-free medium during 3 hr and ouabain was added at a final concentration of 3mM (HeLa and HUVEC) or
3 mM (RVSMC). Mean6S.E. values of experiments performed in quadruplicate are shown. doi:10.1371/journal.pone.0038032.g001
Table 1.Lactate dehydrogenase release (LDH, %), caspase-3 activity (CAS, nmol per mg of protein per hr) and chromatin cleavage (CHR, %) in cells treated with ouabain, K+-free and Ca2+-free medium during 4 hr.
Incubation medium,
additions HeLa HUVEC RVSMC
LDH CAS CHR LDH CAS CHR LDH CAS CHR
None (control) 5.361.6 0.3660.05 3.360.9 7.062.1 0.2660.07 4.460.7 3.060.6 0.4660.04 5.161.2
Ouabain 6.360.6 0.4460.07 2.961.6 7.361.6 0.4160.08 6.961.8 4.361.1 0.3760.03 3.962.6
K+
-free medium 5.961.1 0.3060.05 4.061.0 5.961.7 0.3660.04 4.761.3 4.560.6 0.3860.05 4.861.0
Ca2+-fre medium 6.9
61.2 0.4660.09 4.961.6 8.563.0 0.5360.07 7.161.7 5.561.1 0.5760.08 6.962.2
Staurosporine 15.162.6* 1.3360.25* 19.164.4* 35.363.9* 1.7860.18* 32.166.4* 21.362.2* 2.9160.30* 23.165.0*
To measure LDH release and chromatin cleavage, the total content of LDH and [3H]-labelled DNA were taken as 100%. Ouabain was added at final concentration of
3mM (HeLa and HUVEC) or 3 mM (RVSMC). Ca2+-free medium contained 50mM EGTA and 10mM BAPTA-AM. Staurosporine, a potent trigger of apoptosis, was added as
a positive control at concentration of 1mM. Means6S.E. from experiments performed with quadruplicate are given. *p,0.05 as compared to controls.
proliferation, differentiation and death whose expression is sharply increased are represented by dual specificity protein phosphatase
Dusp8, inhibitor of the receptor-transduced mitogen-activated protein kinase signaling pathwaySpry4, the protein phosphatase 1 regulatory subunitPpp1r15a, the cytokine inducible kinasePlk3, a member of the epidermal growth factor (EGF) family amphir-egulin (Areg), and heparin-binding EGF-like growth factorHbegf.
Among ubiquitous Na+
i,K+i-sensitive genes from other
func-tional categories, we noted augmented expression of oxidative stress mediatorTxnip, the low-density lipoprotein receptorLdlr, the regulator of cholesterol synthesisInsig1and 2 carriers involved in intracellular phosphate handling, i.e. the Ca2+-dependent
mito-chondrial solute carrierSlc25a25mediating ATP-Mg/Piexchange
and the sodium-phosphate symporter Slc20a1 (Table 3). In
contrast to substantial number of ubiquitous Na+
i/K+i-sensitive
genes that were strongly up-regulated, we identified only one
transcript – the epsilon subunit of GABA-activated Cl2 channel (Gabre) – whose expression was decreased by more than 3-fold (Table 3).
Cell type-specific Na+
i,K+i-sensitive transcriptomes
Because the number of cell-type specific Na+
i,K+i-sensitive
transcripts is very large (Fig. 2B, Table 2), we restricted their functional characterization to genes whose expression was altered by more than 4-fold. The relevant analysis led us to several conclusions. First, ubiquitous genes comprised up to ,50% of
Na+
i,K+i-sensitive genes whose expression was increased in HeLa,
HUVEC and RVSMC by more than 4-fold (Tables 4,5,6).Second, strongly up-regulated Na+
i,K+i-sensitive genes are abundant with
the transcripts that were detected in 2 cell types. These transcripts (underlined andbold) accounted for 37%, 18% and 16% of the
total numbers of genes that manifested up- and down-regulation in
Figure 2. Comparative analysis of the actions of Na+,K+-ATPase inhibition by ouabain and K+-free medium on HeLa, HUVEC and
RVSMC transcriptomes. A.Principal component analysis of the transcriptomes of HeLa, HUVEC and RVSMC. Cells were incubated for 3 hr in control Ca2+-containing media and processed for oligonucleotide microarray analysis as indicated in the Methods section. Ouabain was added at a final concentration of 3mM (HeLa and HUVEC) or 3 mM (RVSMC). All experiments are repeated 4 times. Ellipsoids highlight portioning of samples
based on the type of treatment. The principal components in 3-dimensional graphs (PC#1, PC#2 and PC#3) represent the variability of gene expression level within datasets. The total percentage of PCA mapping variability is shown on top.B.The total number of genes whose expression is altered by ouabain and K+-free medium by more than 1.2-fold with p
HeLa, HUVEC and RVSMC, respectively. Third, similar to ubiquitously regulated genes (Table 3), the list of cell type-specific Na+
i,K+i-sensitive genes that were strongly up- and
down-regulated was enriched with the transcriptional regulators and
regulators of immune responses and inflammation. Examples included nuclear receptor subfamily 4 group ANr4a1andNr4a3in
HeLa and RVSMC, early growth response 2Egr2in HeLa and
RVSMC, immediate early response 2Ier2in RVSMC, interleukin
Figure 3. Kinetics of elevation of intracellular Na+in HeLa, HUVEC and RVSMC triggered by ouabain (A) or K+-free medium (B). Ouabain was added at a final concentration of 3mM (HeLa and HUVEC) or 3 mM (RVSMC). Intracellular Na+content in the absence of Na+,K+-ATPase
inhibitors was taken as 100%. Means obtained in experiments performed in triplicate are shown. doi:10.1371/journal.pone.0038032.g003
Table 2.Total numbers of differentially expressed transcripts in HeLa, HUVEC and RVSMC in 3-hr of Na+,K+-ATPase inhibition in
control (Ca2+containing) medium.
Ouabain-treated cells Cells treated with K+
-free medium
Transcripts affected by both stimuli
HeLa
Up-regulated transcripts
Number of transcripts 338 1371 278
Maximal fold of activation 13.78 46.86 N.A.
Down-regulated transcripts
Number of transcripts* 481 1707 406
Maximal fold of inhibition 2.85 7.96 N.A.
HUVEC
Up-regulated transcripts
Number of transcripts 400 1471 355
Maximal fold of activation 9.68 64.81 N.A.
Down-regulated transcripts
Number of transcripts* 486 1447 379
Maximal fold of inhibition 2.40 5.33 N.A.
RVSMC
Up-regulated transcripts
Number of transcripts 1288 1872 894
Maximal fold of activation 9.46 24.32 N.A.
Down-regulated transcripts
Number of transcripts* 1903 1805 945
Maximal fold of inhibition 4.15 7.50 N.A.
Transcripts whose expression was altered by more than 1.2-fold with p,0.05 were subjected to analysis. Ouabain was added at final concentration of 3mM (HeLa and
8IL8 in HeLa and HUVEC, tumour necrosis factora-induced protein 3TNFAIP3in HeLa and HUVEC. From other functional categories, we observed substantial cell type-specific elevation of colony stimulating factor 3 Csf3 in RVSMC, metallopeptidase
ADAMTS1and vasoactive intestinal peptideVIPin HUVEC, the regulator of G-protein signalling Rgs2in RVSMC, endothelin 1
EDN1 and the inhibitor of DNA binding-2 ID2 in HeLa cells
(Tables 4,5,6).
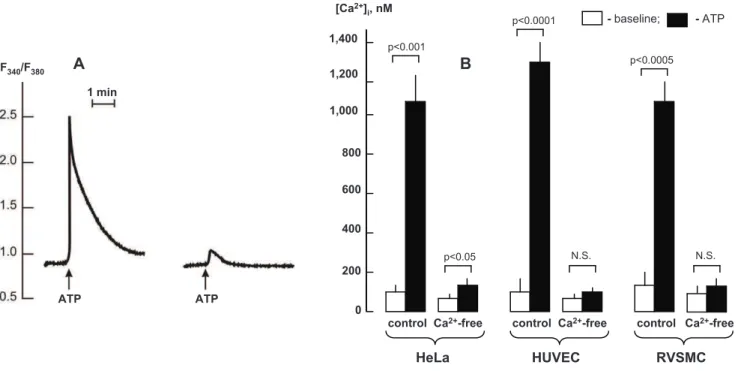
Effects of Ca2+-free medium and intracellular Ca2+
chelation on gene expression
To trigger Ca2+-depletion, we incubated cells in Ca2+-free
medium containing extra- and intracellular Ca2+chelators (50
mM EGTA and 10mM BAPTA-AM, respectively). Figure 7A displays that in HeLa cells this procedure almost completely abolished sharp elevation of [Ca2+
]i evoked by activation of purinergic
receptors by ATP. We did not reveal any significant elevation of [Ca2+
]i in Ca 2+
-depleted, ATP-treated HUVEC and RVSMC (Fig. 7B).
Similarly to the results obtained in Ca2+
-containing media, PCA
found that treatments with ouabain and K+
-free medium produced dramatic changes in gene expression in Ca2+
-depleted HUVEC, RVSMC and HeLa cells (Fig. 8A). Figures 8B and Table 7 show that in all types of Ca2+
-depleted cells, the numbers of differentially expressed genes were increased in comparison to cells incubated in Ca2+
-containing media (Fig. 3B, Table 2). As in Ca2+
-containing media, we ascertained significant positive corre-lations between the differential expression of transcripts triggered
by ouabain and K+
-free medium in Ca2+
-depleted RVSMC (R2= 0.98; p,0.03), HUVEC (R2= 0.96; p,361027) and HeLa cells (R2= 0.93; p,2610220) (Fig. 9). Importantly, the number of Na+
i,K+i-sensitive transcripts, i.e. transcripts whose expression is
affected by both ouabain and K+
-free medium, was also increased in the presence of extra- and intracellular Ca2+
chelators by,3
fold in HeLa and HUVEC and by 2-fold in RVSMC (Fig. 10A, compare to Fig. 6A).
Further analysis disclosed that (i) less than 25% of ubiquitous Na+
i,K+i-sensitive genes were detected in the Ca2+-containing Figure 4. Correlation analysis of transcripts whose expression is altered by ouabain and K+-free medium in HeLa, HUVEC and
RVSMC by more than by 1.2-fold with p,0.05.Cells were incubated during 3 hr; ouabain was added at a final concentration of 3mM (HeLa and
HUVEC) or 3 mM (RVSMC). Incubation medium contains 1.8 mM CaCl2. The total number of transcripts subjected to analysis is shown in Figure 2B.
Transcript expression in control cells was taken as 1.00. doi:10.1371/journal.pone.0038032.g004
Figure 5. Verification of microarray results by quantitative RT-PCR.Gene expression was quantified for 3 hr incubation of control and Ca2+ -depleted HUVEC in the presence of 3mM ouabain or in K+-free medium. Mean values obtained in 4 independent experiments are shown.Egr1- early
media only, (ii) the expression of,15% of ubiquitous Na+ i,K+i
-sensitive genes was independent on the presence of extra- and intracellular Ca2+
chelators, and (iii) more than 60% of ubiquitous and cell type-specific Na+
i,K+i-sensitive genes were found
exclu-sively in Ca2+-depleted cells (Fig. 11). In HeLa cells, among the
Na+
i,K+i-sensitive genes whose expression was changed by
ouabain or K+-free medium by more than 4-fold, we did not
observe any genes whose differential expression was abolished by Ca2+depletion (Table 4). In HUVEC and RVSMC this procedure
eliminated differential expression of ,3 and 20% of transcripts,
respectively (Tables 5,6).
To further verify the efficacy of Ca2+
depletion procedure employed in our study, we compared intracellular concentration of BAPTA, Ca2+
iand expression of 3 selected genes in HeLa cells
incubated in the presence of 10 or 100mM BAPTA-AM. In
control Ca2+
-containing medium, 3 hr incubation of HeLa cells with ouabain elevated [Ca2+
]iby,35% and increased content of
EGR1, PTGS2 and PPP1R15A RNAs by ,56-, 6- and 9-fold,
respectively (Table 8). Addition of 10mM BAPTA-AM in Ca2+
-free medium containing 50mM EGTA completely abolished an increment of [Ca2+
]i triggered by ouabain and increased the
content of EGR1, PTGS2 and PPP1R15A RNAs by,6-, 2- and
1.3-fold, respectively. Elevation of BATPA-AM concentration in the incubation medium up to 100mM increased intracellular
[BAPTA] from 127 to 735mM and augmented expression of
EGR1, PTGS2 and PPP1R15A by ,9-, 2,5- and 2.2-fold,
respectively. This action of Ca2+
-depletion procedure is probably caused by elevation of the passive permeability of the plasma membrane for Na+
and [Na+
]i/[K+]iratio detected in EGTA- and
BAPTA-AM-treated RVSMC [20]. Importantly, elevation of intracellular [BAPTA] up to 735mM did not abolished increments of gene expression evoked by 3 hr incubation with ouabain (Table 8).
Table 9 lists the ubiquitous Na+
i,K+i-sensitive genes, which were
detected in Ca2+
-depleted RVSMC, HUVEC and HeLa cells. Similarly to Ca2+
-containing conditions, ubiquitous Na+ i,K+i
-sensitive transcriptomes in the Ca2+
-depleted cells were abundant
with regulators of transcription/translation, cell cycle control and inflammatory/immune responses (Fig. 10B). Importantly, the actions of elevated [Na+
]i/[K+]iratio on the differential expression
of several genes shown in Table 8 in italics, such as nuclear receptor Nr4a1, anti-proliferative gene Btg2, angiogenic inducer
Cyr61, adrenomedulin Adm and regulator of G-protein signaling
Rgs2, were abolished in the presence of Ca2+
. We also noted that in Ca2+-depleted cells 23 genes or 13% of ubiquitous Na+
i,K+i
-sensitive transcriptome were involved in protein folding and ubiquitination. This is in contrast to 2 genes in the same functional category that were detected in the presence of Ca2+ (Fig. 6B).
These results are consistent with numerous observations that Ca2+
-depletion causes endoplasmic reticulum stress and activates unfolded protein response (for review, see [21]).
Based on this work we selected 8 ubiquitous Na+
i,K+i-sensitive
genes whose expression was increased by more than 5-fold in Ca2+
-containing media, and whose augmented expression was preserved in the presence of extra- and intracellular Ca2+
chelators. As seen in Figure 12, Ca2+-depletion strongly attenuated
(but did not completely abolish) Na+
i/K+i-dependent changes in
gene expression forFosB, Il6, Pppr1r15aandPtgs2in all cell types. In contrast, Ca2+-depletion slightly decreased, did not affect, or
increased expression ofFos, Zfp36, Jun andDusp8 in a cell type-specific manner. These results further illustrate that (i) [Ca2+
]i
elevation is not obligatory for changes in gene expression, and (ii) Ca2+
i-dependent signaling may have complex effects on ubiquitous
and cell type specific Na+
i,K+i-sensitive transcriptomes.
Discussion
In the present study we utilized genome-wide Affymetrix arrays to identify [Na+
]i/[K+]i-sensitive transcriptomes in 3 diverse cell
lines. Based on the results presented here we can conclude that elevation of the [Na+
]i/[K+]i-ratio causes robust changes in gene
expression in both ubiquitous and cell type-dependent manners. The number of regulated transcripts was high and represented more than 2% of the total genome. Surprisingly, Ca2+
-depletion increased rather than decreased number of the [Na+
]i/[K+]i -Figure 6. Na+
i,K+i-sensitive transcriptomes identified in control Ca2+-containing media. A.Pie-chart showing the numbers of Na+i,K+i
-sensitive genes detected in HeLa, HUVEC and RVSMC and ubiquitous Na+
i,K+i-sensitive genes found in all 3 cell types.B.Distribution of ubiquitous
Na+
i,K+i-sensitive genes among major functional groups. Digitals shown initalicscorrespond to gene numbers for each functional group.
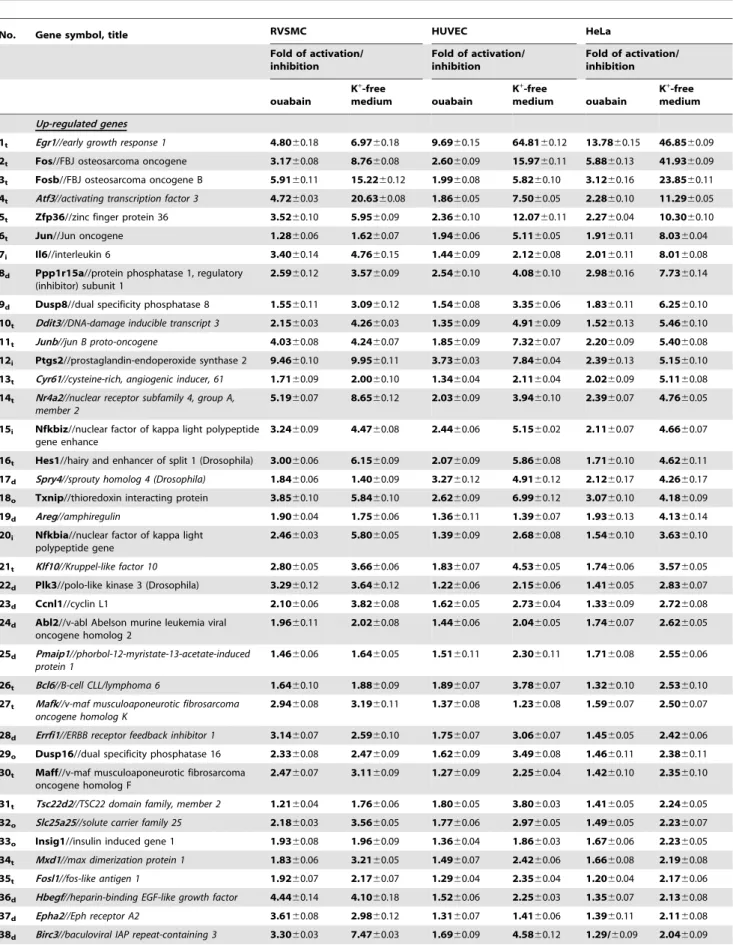
Table 3.Ubiquitous Na+i/K+
i-sensitive genes whose expression was up- and down-regulated by more than 1.2-fold (p#0.05) in control (Ca2+-containing) medium.
No. Gene symbol, title RVSMC HUVEC HeLa
Fold of activation/ inhibition
Fold of activation/ inhibition
Fold of activation/ inhibition
ouabain
K+ -free
medium ouabain
K+ -free
medium ouabain K+
-free medium
Up-regulated genes
1t Egr1//early growth response 1 4.8060.18 6.9760.18 9.6960.15 64.8160.12 13.7860.15 46.8560.09
2t Fos//FBJ osteosarcoma oncogene 3.1760.08 8.7660.08 2.6060.09 15.9760.11 5.8860.13 41.9360.09
3t Fosb//FBJ osteosarcoma oncogene B 5.9160.11 15.2260.12 1.9960.08 5.8260.10 3.1260.16 23.8560.11
4t Atf3//activating transcription factor 3 4.7260.03 20.6360.08 1.8660.05 7.5060.05 2.2860.10 11.2960.05
5t Zfp36//zinc finger protein 36 3.5260.10 5.9560.09 2.3660.10 12.0760.11 2.2760.04 10.3060.10
6t Jun//Jun oncogene 1.2860.06 1.6260.07 1.9460.06 5.1160.05 1.9160.11 8.0360.04
7i Il6//interleukin 6 3.4060.14 4.7660.15 1.4460.09 2.1260.08 2.0160.11 8.0160.08
8d Ppp1r15a//protein phosphatase 1, regulatory (inhibitor) subunit 1
2.5960.12 3.5760.09 2.5460.10 4.0860.10 2.9860.16 7.7360.14
9d Dusp8//dual specificity phosphatase 8 1.5560.11 3.0960.12 1.5460.08 3.3560.06 1.8360.11 6.2560.10
10t Ddit3//DNA-damage inducible transcript 3 2.1560.03 4.2660.03 1.3560.09 4.9160.09 1.5260.13 5.4660.10
11t Junb//jun B proto-oncogene 4.0360.08 4.2460.07 1.8560.09 7.3260.07 2.2060.09 5.4060.08
12i Ptgs2//prostaglandin-endoperoxide synthase 2 9.4660.10 9.9560.11 3.7360.03 7.8460.04 2.3960.13 5.1560.10
13t Cyr61//cysteine-rich, angiogenic inducer, 61 1.7160.09 2.0060.10 1.3460.04 2.1160.04 2.0260.09 5.1160.08
14t Nr4a2//nuclear receptor subfamily 4, group A, member 2
5.1960.07 8.6560.12 2.0360.09 3.9460.10 2.3960.07 4.7660.05
15i Nfkbiz//nuclear factor of kappa light polypeptide gene enhance
3.2460.09 4.4760.08 2.4460.06 5.1560.02 2.1160.07 4.6660.07
16t Hes1//hairy and enhancer of split 1 (Drosophila) 3.0060.06 6.1560.09 2.0760.09 5.8660.08 1.7160.10 4.6260.11
17d Spry4//sprouty homolog 4 (Drosophila) 1.8460.06 1.4060.09 3.2760.12 4.9160.12 2.1260.17 4.2660.17
18o Txnip//thioredoxin interacting protein 3.8560.10 5.8460.10 2.6260.09 6.9960.12 3.0760.10 4.1860.09
19d Areg//amphiregulin 1.9060.04 1.7560.06 1.3660.11 1.3960.07 1.9360.13 4.1360.14
20i Nfkbia//nuclear factor of kappa light polypeptide gene
2.4660.03 5.8060.05 1.3960.09 2.6860.08 1.5460.10 3.6360.10
21t Klf10//Kruppel-like factor 10 2.8060.05 3.6660.06 1.8360.07 4.5360.05 1.7460.06 3.5760.05
22d Plk3//polo-like kinase 3 (Drosophila) 3.2960.12 3.6460.12 1.2260.06 2.1560.06 1.4160.05 2.8360.07
23d Ccnl1//cyclin L1 2.1060.06 3.8260.08 1.6260.05 2.7360.04 1.3360.09 2.7260.08
24d Abl2//v-abl Abelson murine leukemia viral oncogene homolog 2
1.9660.11 2.0260.08 1.4460.06 2.0460.05 1.7460.07 2.6260.05
25d Pmaip1//phorbol-12-myristate-13-acetate-induced protein 1
1.4660.06 1.6460.05 1.5160.11 2.3060.11 1.7160.08 2.5560.06
26t Bcl6//B-cell CLL/lymphoma 6 1.6460.10 1.8860.09 1.8960.07 3.7860.07 1.3260.10 2.5360.10
27t Mafk//v-maf musculoaponeurotic fibrosarcoma
oncogene homolog K
2.9460.08 3.1960.11 1.3760.08 1.2360.08 1.5960.07 2.5060.07
28d Errfi1//ERBB receptor feedback inhibitor 1 3.1460.07 2.5960.10 1.7560.07 3.0660.07 1.4560.05 2.4260.06
29o Dusp16//dual specificity phosphatase 16 2.3360.08 2.4760.09 1.6260.09 3.4960.08 1.4660.11 2.3860.11
30t Maff//v-maf musculoaponeurotic fibrosarcoma oncogene homolog F
2.4760.07 3.1160.09 1.2760.09 2.2560.04 1.4260.10 2.3560.10
31t Tsc22d2//TSC22 domain family, member 2 1.2160.04 1.7660.06 1.8060.05 3.8060.03 1.4160.05 2.2460.05
32o Slc25a25//solute carrier family 25 2.1860.03 3.5660.05 1.7760.06 2.9760.05 1.4960.05 2.2360.07
33o Insig1//insulin induced gene 1 1.9360.08 1.9660.09 1.3660.04 1.8660.03 1.6760.06 2.2360.05
34t Mxd1//max dimerization protein 1 1.8360.06 3.2160.05 1.4960.07 2.4260.06 1.6660.08 2.1960.08
35t Fosl1//fos-like antigen 1 1.9260.07 2.1760.07 1.2960.04 2.3560.04 1.2060.04 2.1760.06
36d Hbegf//heparin-binding EGF-like growth factor 4.4460.14 4.1060.18 1.5260.06 2.2560.03 1.3560.07 2.1360.08
37d Epha2//Eph receptor A2 3.6160.08 2.9860.12 1.3160.07 1.4160.06 1.3960.11 2.1160.08
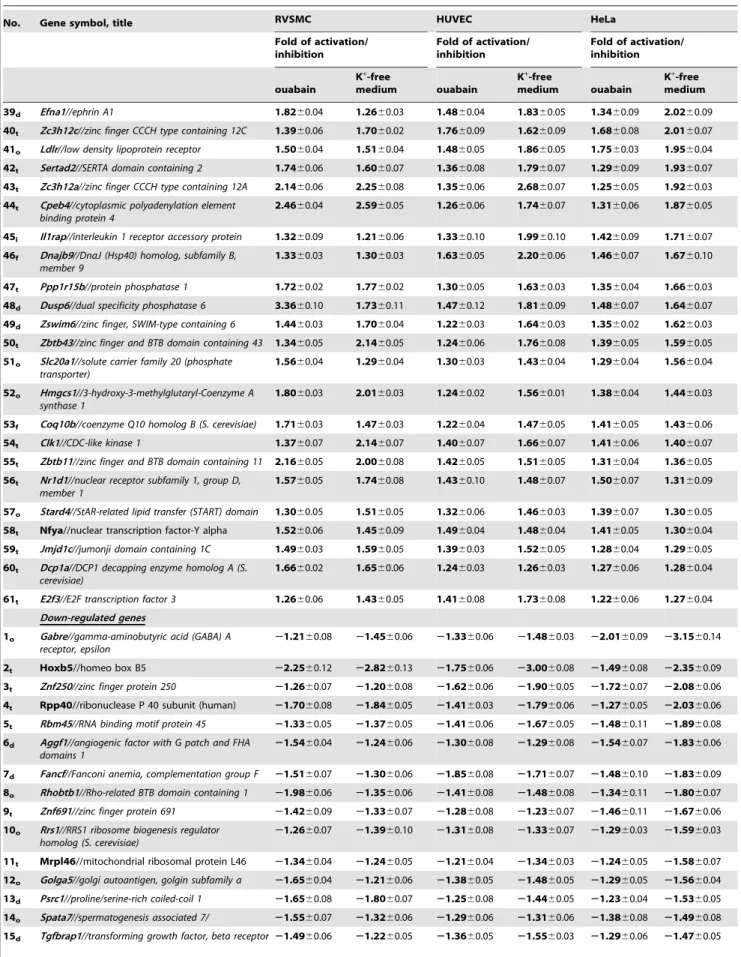
Table 3.Cont.
No. Gene symbol, title RVSMC HUVEC HeLa
Fold of activation/ inhibition
Fold of activation/ inhibition
Fold of activation/ inhibition
ouabain
K+-free
medium ouabain
K+-free
medium ouabain
K+-free medium
39d Efna1//ephrin A1 1.8260.04 1.2660.03 1.4860.04 1.8360.05 1.3460.09 2.0260.09
40t Zc3h12c//zinc finger CCCH type containing 12C 1.3960.06 1.7060.02 1.7660.09 1.6260.09 1.6860.08 2.0160.07
41o Ldlr//low density lipoprotein receptor 1.5060.04 1.5160.04 1.4860.05 1.8660.05 1.7560.03 1.9560.04
42t Sertad2//SERTA domain containing 2 1.7460.06 1.6060.07 1.3660.08 1.7960.07 1.2960.09 1.9360.07
43t Zc3h12a//zinc finger CCCH type containing 12A 2.1460.06 2.2560.08 1.3560.06 2.6860.07 1.2560.05 1.9260.03
44t Cpeb4//cytoplasmic polyadenylation element binding protein 4
2.4660.04 2.5960.05 1.2660.06 1.7460.07 1.3160.06 1.8760.05
45i Il1rap//interleukin 1 receptor accessory protein 1.3260.09 1.2160.06 1.3360.10 1.9960.10 1.4260.09 1.7160.07
46f Dnajb9//DnaJ (Hsp40) homolog, subfamily B, member 9
1.3360.03 1.3060.03 1.6360.05 2.2060.06 1.4660.07 1.6760.10
47t Ppp1r15b//protein phosphatase 1 1.7260.02 1.7760.02 1.3060.05 1.6360.03 1.3560.04 1.6660.03
48d Dusp6//dual specificity phosphatase 6 3.3660.10 1.7360.11 1.4760.12 1.8160.09 1.4860.07 1.6460.07
49d Zswim6//zinc finger, SWIM-type containing 6 1.4460.03 1.7060.04 1.2260.03 1.6460.03 1.3560.02 1.6260.03
50t Zbtb43//zinc finger and BTB domain containing 43 1.3460.05 2.1460.05 1.2460.06 1.7660.08 1.3960.05 1.5960.05
51o Slc20a1//solute carrier family 20 (phosphate transporter)
1.5660.04 1.2960.04 1.3060.03 1.4360.04 1.2960.04 1.5660.04
52o Hmgcs1//3-hydroxy-3-methylglutaryl-Coenzyme A synthase 1
1.8060.03 2.0160.03 1.2460.02 1.5660.01 1.3860.04 1.4460.03
53f Coq10b//coenzyme Q10 homolog B (S. cerevisiae) 1.7160.03 1.4760.03 1.2260.04 1.4760.05 1.4160.05 1.4360.06
54t Clk1//CDC-like kinase 1 1.3760.07 2.1460.07 1.4060.07 1.6660.07 1.4160.06 1.4060.07
55t Zbtb11//zinc finger and BTB domain containing 11 2.1660.05 2.0060.08 1.4260.05 1.5160.05 1.3160.04 1.3660.05
56t Nr1d1//nuclear receptor subfamily 1, group D, member 1
1.5760.05 1.7460.08 1.4360.10 1.4860.07 1.5060.07 1.3160.09
57o Stard4//StAR-related lipid transfer (START) domain 1.3060.05 1.5160.05 1.3260.06 1.4660.03 1.3960.07 1.3060.05
58t Nfya//nuclear transcription factor-Y alpha 1.5260.06 1.4560.09 1.4960.04 1.4860.04 1.4160.05 1.3060.04
59t Jmjd1c//jumonji domain containing 1C 1.4960.03 1.5960.05 1.3960.03 1.5260.05 1.2860.04 1.2960.05
60t Dcp1a//DCP1 decapping enzyme homolog A (S. cerevisiae)
1.6660.02 1.6560.06 1.2460.03 1.2660.03 1.2760.06 1.2860.04
61t E2f3//E2F transcription factor 3 1.2660.06 1.4360.05 1.4160.08 1.7360.08 1.2260.06 1.2760.04
Down-regulated genes
1o Gabre//gamma-aminobutyric acid (GABA) A receptor, epsilon
21.2160.08 21.4560.06 21.3360.06 21.4860.03 22.0160.09 23.1560.14
2t Hoxb5//homeo box B5 22.2560.12 22.8260.13 21.7560.06 23.0060.08 21.4960.08 22.3560.09
3t Znf250//zinc finger protein 250 21.2660.07 21.2060.08 21.6260.06 21.9060.05 21.7260.07 22.0860.06
4t Rpp40//ribonuclease P 40 subunit (human) 21.7060.08 21.8460.05 21.4160.03 21.7960.06 21.2760.05 22.0360.06
5t Rbm45//RNA binding motif protein 45 21.3360.05 21.3760.05 21.4160.06 21.6760.05 21.4860.11 21.8960.08
6d Aggf1//angiogenic factor with G patch and FHA domains 1
21.5460.04 21.2460.06 21.3060.08 21.2960.08 21.5460.07 21.8360.06
7d Fancf//Fanconi anemia, complementation group F 21.5160.07 21.3060.06 21.8560.08 21.7160.07 21.4860.10 21.8360.09
8o Rhobtb1//Rho-related BTB domain containing 1 21.9860.06 21.3560.06 21.4160.08 21.4860.08 21.3460.11 21.8060.07
9t Znf691//zinc finger protein 691 21.4260.09 21.3360.07 21.2860.08 21.2360.07 21.4660.11 21.6760.06
10o Rrs1//RRS1 ribosome biogenesis regulator
homolog (S. cerevisiae)
21.2660.07 21.3960.10 21.3160.08 21.3360.07 21.2960.03 21.5960.03
11t Mrpl46//mitochondrial ribosomal protein L46 21.3460.04 21.2460.05 21.2160.04 21.3460.03 21.2460.05 21.5860.07
12o Golga5//golgi autoantigen, golgin subfamily a 21.6560.04 21.2160.06 21.3860.05 21.4860.05 21.2960.05 21.5660.04
13d Psrc1//proline/serine-rich coiled-coil 1 21.6560.08 21.8060.07 21.2560.08 21.4460.05 21.2360.04 21.5360.05
14o Spata7//spermatogenesis associated 7/ 21.5560.07 21.3260.06 21.2960.06 21.3160.06 21.3860.08 21.4960.08
sensitive genes. These findings point to the existence of novel, yet unidentified Ca2+
i-independent mechanisms of transcriptional
regulation, which are determined by the intracellular concentra-tion of monovalent caconcentra-tions.
Characterization of ubiquitous Na+
i,K+i-sensitive
transcriptome
We observed that sustained Na+,K+-ATPase inhibition by
ouabain led to the differential expression of 886 transcripts in primary cultured human endothelial cells, 819 transcripts in human epitheloid carcinoma cell line and 3191 transcripts in smooth muscle cells obtained from the rat aorta (Fig. 2). Differentially regulated genes represent ,3 and,10% of genes
in human and rat genome, respectively. Keeping in mind that ouabain may affect signaling pathways independently of inhibition of Na+
,K+
-ATPase [14,15], we tested K+
-free medium as an alternative approach to elevation of the [Na+
]i/[K+]iratio. Three
hour incubation of cells in K+
-free medium resulted in gain of Na+ i
and loss of K+
ithat were quantitatively similar to those triggered
by ouabain (Fig. 1). We found highly significant positive correlations between the levels of transcripts impacted by both stimuli (Fig. 4). These data strongly indicate that differential gene expression is evoked by elevation of the [Na+]
i/[K+]iratio rather
than by Na+
i,K+i-independent mechanisms.
Among 684, 737 and 1839 Na+
i,K+i-sensitive transcripts
detected in HeLa, HUVEC and RVSMC, we discerned 80 genes whose expression was increased up to 60-fold or decreased up to
,3-fold independently of the origin of cultured cells (Table 3). It
should be noted that because of the retarded kinetics of elevation of the [Na+]
i/[K+]iratio in human cells (Fig. 3), the number of
Na+
i,K+i-sensitive genes in HeLa and HUVEC as well as the
number of ubiquitous Na+
i,K+i-sensitive genes is probably
underestimated.
Functional analysis demonstrated that almost the half of the ubiquitous Na+
i,K+i-sensitive genes belonged to transcription and
translation regulators (Fig. 6). Important examples include Egr1, Fos, Fosb, Atf3, Jun, Ddit3, Junb, Cyr61. Although functional characterization is somewhat artificial – because genes are usually multifunctional and fall into several categories – the relative content of transcriptional regulators identified in the ubiquitous Na+
i,K+i-sensitive transcriptome was,7-fold higher than in total
human genome [22]. These findings strongly suggest that
heightened expression of ubiquitous Na+
i,K+i-sensitive regulators
of transcription underlie ubiquitous and cell-type specific tran-scriptomic modifications triggered by elevation of the [Na+
]i/
[K+
]i. This conclusion is supported by analysis of the top gene
expression network revealed using the IPA Knowledge Base software. Indeed, Figure 13 illustrates the central role of ubiquitous Na+
i/K+i-sensitive regulators of gene expression such
as Fos, FosB, Jun, JunB, Atf3, Cyr61 in the triggering of diverse cellular signals.
Figure 14 shows that cellular development, gene expression, cell death, immunological and inflammatory responses are among top altered biological functions controlled by ubiquitous Na+
i/K+i
-sensitive transcriptome and mapped in this software with p,1025. Importantly, cellular responses triggered by differential expression of Na+
i,K+i-sensitive genes might be cell type-specific. Thus, for
example 24 hr incubation with ouabain resulted in death of renal epithelial cells [23] but rescued RVSMC from apoptosis triggered by serum deprivation [24].
Ca2+-depletion increases the number of [Na+]
i/[K+]i
-sensitive genes
Numerous studies have demonstrated that elevation of the [Na+
]i/[K+]iratio heightens [Ca2+]ivia activation of Na+i/Ca2+o
exchanger as well as via depolarization and activation of voltage-gated Ca2+
channels (for review, see [9,10]). It has also been well-documented that elevation of [Ca2+]
iaffects gene expression by
activation of SRE via Ras-Raf-Erk-Elk1-mediated signaling, CRE via phosphorylation of CRE binding protein and nuclear factor AT (NFAT) binding sites via NFAT dephosphorylation by calcineurin [7,25–27]. Unexpectedly, we found that in the presence of extra- and intracellular Ca2+ chelators (EGTA and
BAPTA, respectively) the number of cell type-specific and ubiquitous Na+
i,K+i-sensitive genes was increased rather than
decreased. Importantly, differential expression of more than 50% of ubiquitous and cell type-specific Na+
i,K+i-sensitive genes was
detected in Ca2+
-depleted cells only (Fig. 11). Furthermore, the expression of several genes such asFos, Zfp36, JunandDusp8was not affected or even activated in the presence of extra- and intracellular Ca2+
chelators (Fig. 12).
Recently, Akita and Okada reported that activation of volume-sensitive anion channels in astrocytes by bradykinin was suppressed by addition of BAPTA-AM at concentration higher
Table 3.Cont.
No. Gene symbol, title RVSMC HUVEC HeLa
Fold of activation/ inhibition
Fold of activation/ inhibition
Fold of activation/ inhibition
ouabain
K+-free
medium ouabain
K+-free
medium ouabain
K+-free medium
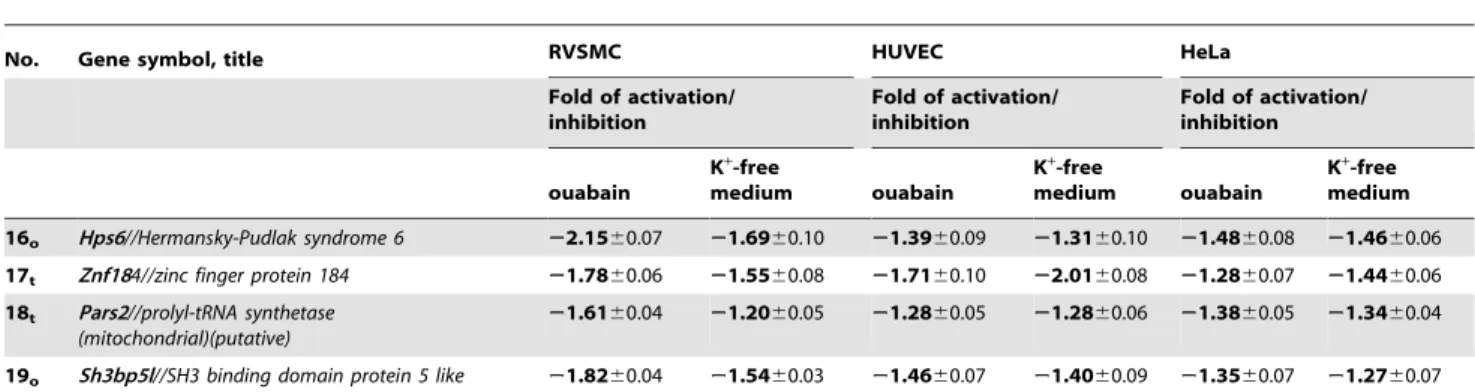
16o Hps6//Hermansky-Pudlak syndrome 6 22.1560.07 21.6960.10 21.3960.09 21.3160.10 21.4860.08 21.4660.06
17t Znf184//zinc finger protein 184 21.7860.06 21.5560.08 21.7160.10 22.0160.08 21.2860.07 21.4460.06
18t Pars2//prolyl-tRNA synthetase (mitochondrial)(putative)
21.6160.04 21.2060.05 21.2860.05 21.2860.06 21.3860.05 21.3460.04
19o Sh3bp5l//SH3 binding domain protein 5 like 21.8260.04 21.5460.03 21.4660.07 21.4060.09 21.3560.07 21.2760.07
HeLa, HUVEC and RVSMC were treated with ouabain or K+-free medium for 3 hr. Genes whose expression is not affected by Na+,K+-ATPase inhibition at least in one type of Ca2+
-depleted cells are shown initalics. Genes whose expression is not affected by Na+ ,K+
-ATPase inhibition in all 3 types of cells are shown inunderlined italics. Functional categories are indicated in the left column as:t– regulators of transcription/translation, RNA processing and degradation;d– regulators of cell adhesion, migration, proliferation, differentiation and death;f- protein folding and ubiquitination;i– inflammation and immune response;o– other functional categories and genes with unknown function.
than 100mM [28]. Thus, it may be proposed that at concentration
10mM used in our study BAPTA-AM was unable completely
abolish elevation of [Ca2+
]itriggered by sustained inhibition of the
Na+
/K+
-ATPase. However, data listed below did not support this assumption. First, 30 min incubation in Ca2+
-free medium
containing 10mM BAPTA-AM and 50mM EGTA sharply
suppressed or completely abolished an increment of [Ca2+
]i
triggered by activation of purinergic receptors (Fig. 7).Second, in contrast to overwhelming number of electrically excitable cells, 2 hr exposure of RVSMC to ouabain did not affect [Ca2+
]ibut Table 4.HeLa cells:the list of genes whose expression was changed by more than 4-fold in 3 hr of Na+,K+-ATPase inhibition in
control (Ca2+containing) medium.
Gene symbol, title Affymetrix ID
Fold of activation or inhibition (-) by ouabain/p value
Fold of activation or inhibition (-) by K+
-free medium/p value
Fold of activation by ouabain/K+
-free medium in HUVEC or RVSMC
EGR1//early growth response 1 8108370 13.78/7.27E-08 46.85/8.18E-05
FOS//FBJ murine osteosarcoma viral oncogene 7975779 5.88/7.27E-08 41.93/8.56E-06
FOSB//FBJ murine osteosarcoma viral oncogene 8029693 3.12/2.78E-07 23.85/1.51E-05
NR4A1//nuclear receptor subfamily 4, group A, 7955589 2.63/1.39E-07 11.79/8.56E-06 3.52/10.73(HUVEC)
TNFAIP3//tumor necrosis factor, alpha-induced protein 3
8122265 1.90/2.27E-07 11.77/8.56E-06 3.34/15.71(HUVEC)
ATF3//activating transcription factor 3 7909610 2.28/9.86E-08 11.29/8.56E-06
EDN1//endothelin 1 8116921 2.31/2.55E-06 11.15/1.10E-04
NR4A3//nuclear receptor subfamily 4, group A 8156848 2.77/8.28E-08 11.06/8.56E-06 4.16/4.68(HUVEC)
ZFP36//zinc finger protein 36, C3H type, homolog (mouse)
8028652 2.27/9.86E-08 10.30/8.56E-06
IL8//interleukin 8 8095680 2.93/5.07E-06 10.00/5.31E-04 1.96/4.45(HUVEC)
JUN//jun oncogene 7916609 1.91/1.68E-07 8.03/8.56E-06
IL6//interleukin 6 (interferon, beta 2) 8131803 2.01/3.12E-07 8.01/1.51E-05
PPP1R15A//protein phosphatase 1, regulatory (inhibitor) subunit 15A
8030128 2.98/2.08E-06 7.73/5.19E-04
DUSP8//dual specificity phosphatase 8 7945641 1.83/4.85E-07 6.25/2.05E-05
EGR2//early growth response 2 7933872 1.85/1.39E-06 5.79/6.41E-05 2.87/9.08(RVSMC)
DDIT3//DNA-damage-inducible transcript 3 7964460 1.52/2.19E-06 5.46/4.39E-05
JUNB//jun B proto-oncogene 8026047 2.20/5.35E-07 5.40/7.13E-05
PTGS2//prostaglandin-endoperoxide synthase 2 7922976 2.39/4.30E-06 5.15/9.30E-04
CYR61//cysteine-rich, angiogenic inducer, 61 7902687 2.02/2.78E-07 5.11/2.71E-05
CSRNP1//cysteine-serine-rich nuclear protein 1 8086330 2.32/2.88E-06 4.80/7.31E-04
HIST1H3J//histone cluster 1, H3j 8124537 1.69/2.25E-05 4.77/6.25E-04 1.40/1.62(HUVEC)
NR4A2//nuclear receptor subfamily 4, group A, 8055952 2.39/1.39E-07 4.76/4.04E-05
NFKBIZ//nuclear factor of kappa light polypeptide gene enhancer in B-cells inhibitor, zeta
8081386 2.11/3.12E-07 4.66/5.06E-05
AREG//amphiregulin 8095744 2.10/2.01E-05 4.64/2.04E-03
DUSP1//dual specificity phosphatase 1 8115831 2.24/1.60E-07 4.64/4.09E-05 1.59/3.81(HUVEC)
HES1//hairy and enhancer of split 1, (Drosophila) 8084880 1.71/1.05E-06 4.62/4.57E-05
SPRY4//sprouty homolog 4 (Drosophila) 8114797 2.12/3.80E-05 4.26/5.65E-03
TXNIP//thioredoxin interacting protein 7904726 3.07/6.87E-07 4.18/1.03E-02
DUSP10//dual specificity phosphatase 10 7924450 1.88/3.99E-07 4.04/4.71E-05 1.32/3.02(HUVEC)
CDKN2AIP//CDKN2A interacting protein 8098500 1.84/2.19E-06 4.01/2.10E-04 1.26/2.05(HUVEC)
ID2//inhibitor of DNA binding 2, dominant negative helix-loop-helix protein
8040103 1.64/2.91E-06 4.01/1.25E-04
LOC100287934//similar to hCG2042721 7909990 22.41/2.12E-03 24.01/3.18E-05 21.96/24.68(HUVEC)
LOC100131860//hypothetical protein 7991047 22.47/3.26E-03 24.73/3.32E-05
TRIM52//tripartite motif-containing 52 8110666 21.57/6.01E-03 25.03/8.88E-07 21.64/23.85(HUVEC)
C9orf3//chromosome 9 open reading frame 3 8156571 22.85/4.40E-05 27.96/1.39E-07 21.71/22.24(HUVEC)
Genes whose differential expression is limited to HeLa cells are shown inbold. Genes whose differential expression were also detected in HUVEC or RVSMC are shown inunderlined bold. All transcripts listed in this table were also differentially expressed in Ca2+
Table 5.HUVEC:the list of genes whose expression was changed in by more than 4-fold in 3 hr of Na+,K+-ATPase inhibition in
control (Ca2+containing) medium.
Gene symbol, title Affymetrix ID
Fold of activation or inhibition (-) by ouabain/p value
Fold of activation or inhibition (-) by K+
-free medium/p value
Fold of modulation by ouabain/K+-free medium in HeLa or RVSMC
EGR1//early growth response 1 8108370 9.69/1.10E-05 64.81/1.98E-08
FOS//FBJ murine osteosarcoma viral oncogene 7975779 2.60/2.41E-04 15.97/7.24E-08
TNFAIP3//tumor necrosis factor, alpha-induced protein 3
8122265 3.34/7.23E-05 15.71/7.53E-08 1.90/11.77(HeLa)
ZFP36//zinc finger protein 36, C3H type, 8028652 2.36/5.36E-04 12.07/1.99E-07
NUAK2//NUAK family, SNF1-like kinase, 2 7923753 2.22/3.28E-04 9.97/9.48E-08
IL1A//interleukin 1, alpha 8054712 3.30/5.79E-05 8.88/2.11E-07
CD274//CD274 molecule 8154233 3.71/1.71E-05 7.96/8.93E-08 1.42/2.31(HeLa)
PTGS2//prostaglandin-endoperoxide synthase 2 7922976 3.73/6.24E-08 7.84/1.12E-09
ATF3//activating transcription factor 3 7909610 1.86/7.23E-05 7.50/1.46E-08
JUNB//jun B proto-oncogene 8026047 1.85/6.08E-04 7.32/1.26E-07
TXNIP//thioredoxin interacting protein 7904726 2.62/3.51E-04 6.99/7.32E-07
ADAMTS1//ADAM metallopeptidase with thrombospondin type 1 motif, 1
8069676 2.42/2.49E-04 6.31/4.46E-07
est (ncrna:misc_RNA) 7919749 2.20/4.60E-03 6.23/7.44E-06
HES1//hairy and enhancer of split 1, (Drosophila) 8084880 2.07/2.77E-04 5.86/2.11E-07
KITLG//KIT ligand 7965322 1.85/4.92E-05 5.85/1.70E-08
FOSB//FBJ murine osteosarcoma viral oncogene 8029693 1.99/6.50E-04 5.82/4.46E-07
Novel scRNA pseudogene 8160086 1.47/2.70E-02 5.64/1.49E-06
SNAPC1//small nuclear RNA activating complex, polypeptide 1, 43 kD
7974870 2.17/2.13E-05 5.48/1.98E-08
NFKBIZ//nuclear factor of kappa light polypeptide gene enhancer in B-cells inhibitor, zeta
8081386 2.44/1.10E-05 5.15/2.16E-08
JUN//jun oncogene 7916609 1.94/3.43E-05 5.11/1.98E-08
FAM148B//family with sequence similarity 148, member B
7989473 2.28/4.60E-03 5.09/2.05E-05
CXCL1//chemokine (C-X-C motif) ligand 1 8095697 2.03/2.26E-03 5.02/3.75E-06 2.97/4.02 (RVSMC)
SPRY4//sprouty homolog 4 (Drosophila) 8114797 3.27/5.05E-05 4.91/9.53E-07
DDIT3//DNA-damage-inducible transcript 3 7964460 1.35/1.12E-02 4.91/2.20E-07
HSPA1B//heat shock 70 kDa protein 1B 8178086 1.81/1.22E-02 4.78/1.22E-05
BIRC3//baculoviral IAP repeat-containing 3 7943413 1.69/5.91E-03 4.58/2.71E-06
KLF10//Kruppel-like factor 10 8152215 1.83/2.41E-04 4.53/1.34E-07
IL8//interleukin 8 8095680 1.96/2.61E-03 4.45/4.97E-06 2.93/10.00(HeLa)
est (ncrna:snoRNA) 8126093 1.88/4.07E-04 4.41/4.46E-07
HSPA1A//heat shock 70 kDa protein 1A 8118310 1.85/7.33E-03 4.39/1.10E-05
SNORD3A//small nucleolar RNA, C/D box 3A 8005547 1.29/2.70E-02 4.31/4.46E-07
est (ncrna:misc_RNA) 8122816 1.52/8.96E-03 4.30/1.59E-06
PPP1R15A//protein phosphatase 1, regulatory (inhibitor) subunit 15A
8030128 2.54/1.58E-04 4.08/1.26E-06
VIP//vasoactive intestinal peptide 8122865 1.53/4.54E-02 4.02/1.97E-05
KDM6B//lysine (K)-specific demethylase 6B 8004671 1.63/5.12E-03 4.01/2.53E-06 1.73/2.83(HeLa)
SNORD52//small nucleolar RNA, C/D box 52 8118322 22.12/5.04E-03 24.14/2.96E-05
est(ncrna:snoRNA) 8012906 21.94/5.91E-04 24.39/8.68E-07
LOC100287934//similar to hCG2042721 7896754 21.93/2.58E-03 24.46/4.31E-06 22.41/24.01(HeLa)
est(ncrna:misc_RNA) 8007990 21.37/4.92E-02 25.03/1.59E-06
Genes whose differential expression is limited to HUVEC are shown inbold. Genes whose expression were also detected in HeLa or RVSMC are shown inunderlined bold. Genes whose expression was not affected by Na+
,K+
-ATPase inhibition in Ca2+
Table 6.RVSMC:the list of genes whose expression was changed by more than 4-fold in 3 hr of Na+,K+-ATPase inhibition in
control (Ca2+containing) medium.
Gene symbol, title Affymetrix ID
Fold of activation or inhibition (-) by ouabain/p value
Fold of activation or inhibition (-) by K+
-free medium/p value
Fold of modulation by ouabain/K+
-free medium in HUVEC or HeLa
Cxcl2//chemokine (C-X-C motif) ligand 2 10775896 3.44/7.21E-07 24.32/1.69E-09 1.38/2.58(HUVEC)
Atf3//activating transcription factor 3 10770710 4.72/2.24E-07 20.63/2.72E-09
Fosb//FBJ osteosarcoma oncogene B 10719432 5.91/1.15E-06 15.22/4.45E-08
Btg2//B-cell translocation gene 2, anti-proliferative 10767767 5.28/1.08E-05 12.02/6.67E-07
Nr4a1//nuclear receptor subfamily 4, group A 10899387 3.52/2.89E-05 10.73/4.79E-07 2.63/11.79(HeLa)
Csf2//colony stimulating factor 2 10742663 2.26/2.74E-05 10.35/4.23E-08
cDNA:known 10708091 3.89/1.50E-07 10.31/3.10E-09
Ptgs2//prostaglandin-endoperoxide synthase 2 10764551 9.46/1.08E-07 9.95/3.97E-08
Egr2//early growth response 2 10832802 2.87/2.64E-06 9.08/2.01E-08 1.85/5.79 (HeLa)
Fos//FBJ osteosarcoma oncogene 10886031 3.17/3.92E-06 8.76/5.28E-08
Lif//leukemia inhibitory factor 10773853 6.68/7.21E-07 8.68/1.47E-07
Nr4a2//nuclear receptor subfamily 4, group A 10845384 5.19/1.51E-06 8.65/1.47E-07
Axud1//AXIN1 up-regulated 1 10920967 5.10/7.51E-08 8.22/4.42E-09
Rgs2//regulator of G-protein signaling 2 10768332 2.41/6.15E-04 7.67/3.13E-06 1.31/2.65(HUVEC)
Snf1lk//SNF1-like kinase 10832197 3.80/4.77E-06 7.55/2.42E-07
Birc3//baculoviral IAP repeat-containing 3 10914799 3.30/2.04E-08 7.47/3.66E-10
Egr1//early growth response 1 10800919 4.80/8.98E-06 6.97/1.76E-06
Plk2//polo-like kinase 2 (Drosophila) 10812954 2.14/1.27E-06 6.773.10E-09
Irf1//interferon regulatory factor 1 10733553 1.51/1.47E-04 6.33/1.70E-08
Hes1//hairy and enhancer of split 1 10754943 3.00/2.07E-06 6.15/5.28E-08
Egr3//early growth response 3 10781337 3.87/4.79E-07 6.00/4.45E-08
Zfp36//zinc finger protein 36 10720215 3.52/1.19E-06 5.95/7.06E-08
Txnip//thioredoxin interacting protein 10817552 3.85/1.47E-06 5.84/1.46E-07
Nfkbia//nuclear factor of kappa light polypeptide gene enhancer in B-cells inhibitor, alpha
10890024 2.46/3.55E-07 5.80/3.36E-09
Cish//cytokine inducible SH2-containing protein 10912908 3.59/8.97E-08 5.76/4.42E-09
Ier2//immediate early response 2 10806685 3.88/1.82E-06 5.26/2.80E-07
Hand1//heart and neural crest derivatives 10719358 1.86/7.51E-03 5.16/1.95E-05
Il6//interleukin 6 10859799 3.40/1.21E-05 4.76/2.03E-06
Nr4a3//nuclear receptor subfamily 4, group A 10868940 4.16/1.99E-05 4.68/9.44E-06 2.77/11.06 (HeLa)
Nfkbiz//nuclear factor of kappa light polypeptide gene enhancer in B-cells inhibitor, zeta
10750848 3.24/8.70E-07 4.47/9.70E-08
Csf3//colony stimulating factor 3 (granulocyte) 10738051 7.04/2.47E-06 4.34/7.97E-06
Arrdc4//arrestin domain containing 4 10722720 2.39/2.99E-05 4.32/9.50E-07
Ddit3//DNA-damage inducible transcript 3 10895861 2.15/1.08E-07 4.26/1.52E-09
Junb//jun B proto-oncogene 10806585 4.03/2.54E-07 4.24/8.44E-08
Tiparp//TCDD-inducible poly(ADP-ribose) polymerase 10815763 2.64/1.51E-06 4.20/7.06E-08
Hbegf//heparin-binding EGF-like growth factor 10803947 4.44/1.55E-05 4.10/1.63E-05
Cxcl1//chemokine (C-X-C motif) ligand 1 10775900 2.97/3.28E-07 4.02/3.72E-08 2/03/5.02 (HUVEC)
Ttc30b//tetratricopeptide repeat domain 30B 10846293 24.13/3.19E-05 21.44/4.97E-02 21.38/21.54(HUVEC)
Gemin4//gem (nuclear organelle) associated protein 10745022 24.08/2.21E-06 22.10/6.59E-05
RGD1566325//similar to regulator of sex-limitation candidate 16
10796900 24.15/4.85E-06 22.16/1.38E-04
est(ncrna: snoRNA) 10765034 21.99/1.58E-06 25.01/4.91E-09
est(ncrna: snoRNA) 10713606 23.21/2.51E-06 25.56/1.42E-07
est(ncrna: snoRNA) 10713604 23.37/7.17E-06 27.34/2.44E-07
Genes whose differential expression is limited to RVSMC are shown inbold. Genes whose expression were also detected in HeLa or HUVEC are shown inunderlined bold. Genes whose expression was not affected by Na+
,K+
-ATPase inhibition in Ca2+
sharply increased expression ofFosandJunsuperfamily IRG [12]. Here, we demonstrated that addition of 50mM EGTA and 10mM BAPTA-AM completely abolished a modest increment of [Ca2+
]i
triggered by 3 hr incubation of HeLa cells with ouabain whereas augmented expression of EGR1, PTGS2 and PPP1R15A was preserved (Table 8).Third, in the presence of 10mM BAPTA-AM, intracellular concentration BAPTA in HeLa cells reached a value of,130mM (Table 8). Based on the volume of intracellular water (,2ml/mg of protein), the intracellular BAPTA content on these cells (,260 pmol/mg protein) was sufficient to bind the total pool
of intracellular exchangeable calcium (,200 pmol/mg protein)
[13].Fourth, elevation of intracellular [BAPTA] up to,700mM did not abolished increments of gene expression evoked by ouabain (Table 8). It is important to note that long-term exposure of cells to Ca2+chelators at higher concentrations causes diverse
side-effects including elevated permeability of the plasma mem-brane for Na+
[20]. Moreover, because of the high affinity to other di- and trivalent cations [29], Ca2+ chelators can affect
transcriptome via irreversible conformational transition and inactivation of transcriptional adaptor Zn2+
-binding domain [30]. Viewed collectively, these data strongly indicate that besides canonical Ca2+
-mediated signalling, gain of [Na+
]iand/or loss of
[K+
]i influence gene expression via Ca2+i-independent
mecha-nism.
Physiological and pathophysiological implications
The Na+
i/K+i-dependent regulation of gene expression may
have numerous physiological and pathological implications (Fig. 15). Here, we discuss a few of tissue-specific examples.
Excitation of neuronal cells. Almost 30 years ago, several
research teams reported that expression of Erg1 and other
Na+
i,K+i-sensitive IGR listed in Table 2 is strongly increased in
neuronal cell subjected to excitation by diverse stimuli including neurotransmitters, depolarization and light [31–33]. The mecha-nisms of this phenomenon, widely employed for the identification of excited brain areas, remain largely unknown. It has been shown that activation of N-methyl-D-aspartate (NMDA) receptor con-tributes to elevation ofEgr1mRNA content in excited neuronal cells. This link is so prominent that monitoringEgr1expression has been proposed as a biological assay for NMDA receptor activity. Given a key role of NMDA receptor activation in regulating synaptic strength,Egr1accumulation has also been connected with learning and memory (for review, see [34]). Indeed, experiments performed on Egr1deficient mice showed that their inability to form long-term memory in a variety of behavioural tasks [35]. It is generally accepted that Egr1 expression in neuronal cells is triggered by [Ca2+
]ielevation [25]. However, ion currents through
NMDA channels are mainly mediated by monovalent cations (PNa,PK&PCa), and short periods of synaptic activity in apical
dendrites and dendritic spines produce increases in [Na+
]i, from
,10 to 30 and 100 mM, respectively [36]. Recently, sharp
elevation of [Na+
]iin response to local application of glutamate
was demonstrated in neocortical neurons loaded with sodium-sensitive nanoprobe [37]. Here, we report that elevation of the [Na+
]i/[K+]i ratio in Ca2+-depleted HUVEC and HeLa cells
augmentedEgr1expression by,10-fold, which is comparable to
increments detected in Ca2+
-containing medium (Tables 4,5). In contrast, in RVSMC,Egr1up regulation was exclusively detected in the presence of Ca2+
(Table 6). Therefore, the relative impact of Ca2+
i- mediated and Ca2+i -independent mechanisms on Egr1
expression triggered by elevation of the [Na+
]i/[K+]i ratio in
neuronal cells and their roles in memory formation and storage should be further examined in light of the data presented here.
Figure 7. Effect of EGTA and BAPTA on Ca2+signalling triggered by activation of purinergic receptors. A.Representative records showing kinetics of elevation of intracellular Ca2+
-concentration (F340/F360ratio) in HeLa cells triggered by addition of 100mM ATP.1– Control (Ca2+
-containing medium);2– cells were preincubated for 10 min in Ca2+-free medium containing 50
mM EGTA and 10mM BAPTA-AM.B.Baseline and maximal values of [Ca2+
]iin ATP-treated HeLa, HUVEC and RVSMC in control and Ca2+-free medium containing 50mM EGTA and 10mM BAPTA-AM.
Figure 8. Comparative analysis of the actions of Na+,K+-ATPase inhibition by ouabain and K+-free medium on the transcriptome of
Ca2+-depleted HeLa, HUVEC and RVSMC. A.Principal component analysis of HeLa, HUVEC and RVSMC transcriptomes. Cells were incubated for 3 hr in Ca2+
-free medium containing 50mM EGTA and 10mM BAPTA-AM and processed for oligonucleotide microarray analysis as indicated in the
Methods section. Ouabain was added at a final concentration of 3mM (HeLa and HUVEC) or 3 mM (RVSMC). Ellipsoids highlight portioning of samples
based on the type of cell treatment. The principal components in 3-dimensional graphs (PC#1, PC#2 and PC#3) represent the variability in gene expression level within datasets. The total percentage of PCA mapping variability is shown on top.B.Total numbers of genes whose expression is altered by ouabain and K+
-free medium by more than 1.2-fold with p,0.05 are indicated; numbers of genes affected by both stimuli appears inbold. doi:10.1371/journal.pone.0038032.g008
Figure 9. Correlation analysis of transcripts whose expression is altered by ouabain and K+-free medium in Ca2+-depleted HeLa,
HUVEC and RVSMC more than by 1.2-fold with p,0.05.Cells were incubated during 3 hr in Ca2+
-free medium containing 50mM EGTA and
10mM BAPTA-AM. Ouabain was added at a final concentration of 3mM (HeLa and HUVEC) or 3 mM (RVSMC). The total number of transcripts
Intensive exercise. Numerous studies demonstrated that the
plasma concentration of IL6 increases up to 100-fold during muscular exercise. This increase is followed by the expression of the IL1 receptor agonist (Il1ra) and the anti-inflammatory cytokine
IL10. Importantly, contracting skeletal muscle rather than the immune cells is the only source of the IL6 in circulation in response to exercise. The mechanism of this phenomenon, which plays a key role in the energy supply via elevation of glucose
Figure 10. Na+
i,K+i-sensitive transcriptomes identified in Ca2+-depleted cells. A.Pie-chart showing the numbers of and cell type-specific,
Na+
i,K+i-sensitive genes detected in HeLa, HUVEC and RVSMC and ubiquitous Na+i,K+i-sensitive genes found in all 3 types of cells. Experiments were
performed in Ca2+
-free medium containing 50mM EGTA and 10mM BAPTA-AM.B.The distribution of ubiquitous and cell type-specific Na+i,K+i
-sensitive among major functional groups. Digitals shown initalicscorrespond to gene numbers in each functional group. doi:10.1371/journal.pone.0038032.g010
Table 7.Total numbers of differentially expressed transcripts in HeLa, HUVEC and RVSMC in 3-hr of Na+,K+-ATPase inhibition in
Ca2+-free medium containing extra- and intracellular Ca2+chelators.
Ouabain-treated cells Cells treated with K+
-free medium Transcripts affected by both stimuli
HeLa
Up-regulated transcripts
Number of transcripts 1007 1633 755
Maximal fold of activation 13.52 28.33 N.A.
Down-regulated transcripts
Number of transcripts* 1204 1868 996
Maximal fold of inhibition 5.18 9.31 N.A.
HUVEC
Up-regulated transcripts
Number of transcripts 1521 1696 1177
Maximal fold of activation 12.58 19.96 N.A.
Down-regulated transcripts
Number of transcripts* 1631 1813 1329
Maximal fold of inhibition 8.19 10.91 N.A.
RVSMC
Up-regulated transcripts
Number of transcripts 2342 3107 1911
Maximal fold of activation 7.60 10.17 N.A.
Down-regulated transcripts
Number of transcripts* 1835 2400 1543
Maximal fold of inhibition 13.49 12.91 N.A.
Transcripts whose expression was altered by more than 1.2-fold with p,0.05 were subjected to analysis. EGTA and BAPTA-AM were added at concentrations of 50 and 10mM, respectively. Ouabain was added at final concentration of 3mM (HeLa and HUVEC) or 3 mM (RVSMC). N.A. – non-applicable.
uptake in hepatocytes and lipolysis in adipose tissue, remains poorly understood (for comprehensive review, see [38]). It is known, however, that in both humans and experimental animals, intensive exercise increases [Na+
]iin skeletal muscles by 3–4-fold
and decreases [K+
]iby 15–25% via activation of voltage-gated K+
and Na+
channels and partial inactivation of Na+
,K+
-ATPase [39,40]. Here, we demonstrated thatIl6is among the ubiquitous genes whose expression is strongly increased by elevation of the [Na+
]i/[K+]i ratio (Table 3). Therefore, our data allow us
hypothesize that elevation of plasma level of IL6 during intensive exercise is caused by elevation of the [Na+
]i/[K+]iratio in skeletal
muscle that, in turn, increases expression of the [Na+
]i/[K+]i
-sensitive genes, includingIl6.
Ischemia. To date, transcriptomic alterations in response to oxygen deprivation, such as modest hypoxia in solid tumours or in the adipose tissue of obese patients, have been largely ascribed to the overexpression of hypoxia-inducible factor 1 (HIF-1) known to be the molecular pO2 sensor that affects gene expression via its
binding to cis-acting hypoxic-response elements (HRE) [41]. It should be noted, however, that the overwhelming number of
genes, such asEgr1, Atf3, Ptgs2, Il6, Ppp1r5, Hes1, Nfkbiz, Txnip, Adamts1, Egr 3, Cxcl2, Hsp70, whose expression is strongly increased in cells subjected to ischemia/reperfusion both in vivo and in vitro [42–52], lack HRE. Significantly, we detected the above-listed genes among ubiquitous (Egr1, Atf3, Ptgs2, Il6, Ppp1r5, Hes1, Nfkbiz, Txnip, Tables 3 and 9) or cell-type specific (Adamts1, Egr 3, Cxcl2, Hsp70, Table 4,5,6) [Na+
]i/[K+]i-sensitive genes.
Since even transient ischemia increases [Na+
]ifrom 5–8 to 25–
40 mM and causes reciprocal changes in [K+
]i [53], it can be
hypothesized that inversion of the [Na+
]i/[K+]iratio contributes to
transcriptomic changes triggered by ischemia, with pathways that are complementary to those previously associated with activation of HIF-1. This conclusion is consistent with IPA Knowledge Base data showing abnormalities of gene expression revealed in ischemic liver, heart and kidney among disorders linked with ubiquitous Na+
i/K+i-sensitive transcriptome (Fig. 16).
In conclusion, we report here that elevation of the [Na+
]i/[K+]i
ratio affects expression of hundreds of genes via the activation of Ca2+
-mediated and most importantly Ca2+
-independent signaling pathways. The proposed hypothetical hierarchy of these pathways
Figure 11. Pie-chart showing the action of Ca2+depletion on Na+
i,K+i-sensitive transcriptomes.Ca2+-depletion was triggered by omission
of extracellular Ca2+
and addition of 50mM EGTA and 10mM BAPTA-AM. The numbers of ubiquitous Na+i,K+i-sensitive genes and Na+i,K+i-sensitive
genes detected in HUVEC, HeLa and RVCSM are shown initalics. doi:10.1371/journal.pone.0038032.g011
Table 8.Intracellular concentration of BAPTA, Ca2+and expression of EGR1, PTGS2 and PPP1R15A in HeLa cells.
Incubation medium Ouabain,mM
Intracellular [BAPTA],
mM [Ca2+]
i, nM Gene expression, arbitrary units,
EGR1 PTGS2 PPP1R15A
1.Control 0 ND 121612 1.0 1.0 1.0
3 ND 164611* 56.462.3*** 6.160.8*** 9.361.1***
2.Ca2+-free
+10mM 0 127633 9768 6.060.6 1.960.3 1.360.2
BAPTA-AM 3 ND 92614 59.961.7*** 4.860.7** 5.160.7**
3.Ca2+
-free+100mM 0 7356101 91615 9.360.8 2.560.3 2.260.4
BAPTA-AM 3 ND 10469 55.263.4*** 7.260.8** 6.460.5***
HeLa cells were incubated during 3 hrs with or without ouabain in control medium containing 1.8 mM CaCl2(1) or in Ca2+-free medium containing 50mM EGTA and 10
or 100mM BAPTA-AM (2and3, respectively). Changes in the expression of of EGR1, PTGS2 and PPP1R15A were measured by qRT-PCR. For more details, see Methods
section. Means6S.E. obtained in experiments performed in quadruplicate are shown. ND – these values were not determined. *, ** and ***- p,0.05, 0.01 and 0.001 compared to values obtained in the absence of ouabain, respectively.