Forest structure and species composition along a successional gradient of Lowland
Atlantic Forest in Southern Brazil
Ma´rcia C.M. Marques1,4, Victor P. Zwiener1, Fernando M. Ramos1, Marı´lia Borgo2& Renato Marques3
1Departamento de Botaˆnica, Laborato´rio de Ecologia Vegetal, SCB, Universidade Federal do Parana´, Caixa Postal 19031, 81531-980, Curitiba, PR, Brazil.
2
The Nature Conservancy, Rua Padre Anchieta, 392, 80410-030, Curitiba, PR, Brazil. 3
Departamento de Solos e Engenharia Agrı´cola, SCA, Universidade Federal do Parana´, Rua dos Funciona´rios, 1540, 80035-050, Curitiba, PR, Brazil.
4
Corresponding author: Ma´rcia C.M. Marques, e-mail:[email protected]
MARQUES, C.M.M., ZWIENER, V.P., RAMOS, F.M., BORGO, M., MARQUES, R.Forest structure
and species composition along a successional gradient of Lowland Atlantic Forest in Southern Brazil.Biota
http://dx.doi.org/10.1590/1676-06032014009414
Abstract:The Lowland Forest is one of the most disturbed and fragile ecosystems in the Atlantic Forest biome, yet little is known regarding its successional trajectory and resilience. We evaluated changes in species assemblages and forest structure of the canopy and understory along a successional gradient (young 21-yrs old forest, immature 34-yrs old forest and late successional 59-yrs old forest) aiming to assess changes in species composition and successional trajectory of different strata of secondary forests. A 0.1 ha plot (ten 10x10 m sub-plots) from each forest stand was surveyed for trees and shrubs with a diameter at breast height (DBH)>4.8 cm (canopy) and for individuals with heights>1 m and DBH, 4.8 cm (understory). A total of 3,619 individuals from 82 plant species were sampled. The successional gradient was marked by a unidirectional increase in species richness and a bidirectional pattern of density changes (increasing from young to immature forest and decreasing from immature to late successional forest). Community assemblages were distinct in the three forests and two strata; indicator species were only weakly shared among stands. Thus, each successional forest and stratum was observed to be a unique plant community. Our results suggest slight predictability of community assemblages in secondary forests, but a relatively fast recovery of forest structure.
Keywords:canopy, chronosequence, Restinga, understory.
MARQUES, C.M.M., ZWIENER, V.P., RAMOS, F.M., BORGO, M., MARQUES, R. Estrutura e
composic¸a˜o ao longo de um gradiente sucessional de Floresta de Terras Baixas no sul do Brasil. Biota
http://dx.doi.org/10.1590/1676-06032014009414
Resumo:As Florestas de Terras Baixas constituem um dos ecossistemas mais perturbados e fra´geis no bioma Mata Atlaˆntica, mas ainda pouco se sabe sobre sua trajeto´ria sucessional e resilieˆncia. Foram avaliadas alterac¸o˜es na composic¸a˜o de espe´cies e a estrutura florestal do dossel e sub-bosque ao longo de um gradiente sucessional (floresta jovem-21 anos, floresta imatura-34 anos, floresta madura-59 anos) com o objetivo de verificar as mudanc¸as na composic¸a˜o de espe´cies e a trajeto´ria sucessional de diferentes estratos destas florestas secunda´rias. Uma parcela de 0,1 ha (dez sub-parcelas de 10x10 m) foi estabelecida em cada floresta, amostrando-se a´rvores e arbustos com um diaˆmetro a` altura do peito (DAP)>4,8 cm (dossel) e para indivı´duos com altura.1 m e DAP,4,8 cm (sub-bosque). Um total de 3.619 indivı´duos de 82 espe´cies de plantas foram amostrados. O gradiente sucessional foi marcado por um aumento unidirecional na riqueza de espe´cies com o tempo, e um padra˜o bidirecional de mudanc¸as de densidade (aumentando da floresta jovem para a imatura e diminuindo da imatura para a madura). As assemble´ias de plantas eram distintas nas treˆs florestas e nos dois estratos; espe´cies indicadoras foram pouco compartilhadas entre as florestas. Portanto, cada esta´dio da cronosequeˆncia e cada estrato representam uma comunidade u´nica de plantas. Nossos resultados sugerem pouca previsibilidade das assembleias de plantas destas florestas secunda´rias, mas uma recuperac¸a˜o relativamente ra´pida da estrutura da floresta.
Palavras-chave:cronossequeˆncia, dossel, Mata Atlaˆntica, Restinga, sub-bosque.
article
Neotropica. 14(3): e20140094.
Introduction
Secondary forests are increasing worldwide as a result of shifting cultivation patterns and rural-urban migration (Aide & Grau 2004; Wright & Muller-Landau 2006). Future global land cover scenarios include forests that have resulted from multiple successional pathways (Corlett 1995). For decades, studies have focused on factors that have influenced the structure and diversity of secondary tropical forests (Denslow 1980; Brown & Lugo 1990; Finegan 1996; Guariguata & Ostertag 2001; Chazdon 2008). However, the successional trajectories of these forests still remain uncertain. Determining changes in tropical forests during secondary succession is crucial for understanding forest resilience, resistance and, ultimately, the role of secondary forests in the conservation of biodiversity and the provision of ecosystem services (Brown & Lugo 1990; Chazdon 2008; Chazdon et al. 2009).
Plant communities are affected by multiple factors during successional processes. Features of the landscape, such as the distance and quality of nearby habitats, affect rates of seed arrival and colonization (Pickett et al. 1987; Zwiener et al. 2014). The disturbance history and previous land use strongly influence soil properties (Ding et al. 2012; Larkin et al. 2012; Long et al. 2012), presence of remnant seeds, sprouts and saplings, and current species composition of the plant commu-nity (Uhl 1987; Holl et al. 2000). All of these factors determine different paths and rates of forest recovery, which can vary from decades to centuries (Liebsch et al. 2008).
The recovery of forest structure after disturbance is often assessed in terms of how density, basal area and diversity of the canopy stratum compare with those of old-growth/primary forests (Guariguata & Ostertag 2001; Letcher & Chazdon 2009). Four structural phases are generally recognized for the recovery process in tropical forests (Chazdon 2008): stand initiation, stem exclusion, understory re-initiation and the old-growth stage. Such phases are reflected in forest physiognomy and structure, but directional changes for each community vary according to the amount of time that has passed since the last disturbance. For example, species richness is relatively low in young and undisturbed communities, but the immature phase can have a higher number of species than might be found in the other phases because of the intermediate disturbance level in these sites (Connell 1978).
Whereas sufficient knowledge exists concerning the mechanisms of structural change during secondary succession (e.g., Chazdon et al. 2007), issues about successional trends in species composition still remain contentious. Changes in temperature, humidity and light availability create new habitats that are occupied by species that differ in their resource requirements (Mesquita et al. 2001). In these situations, not only the species composition but also the community guilds are distinctive from those of primary forests (Norden et al. 2009). Decreasing light availability during succession favors shade tolerant species and decreases numbers of understory species in secondary forests (Guariguata & Ostertag 2001). Thus, species composition during the succession is still one of the most difficult approaches to succession theory, but it is highly important for forest management.
The Brazilian Atlantic Forest has been systematically altered by human occupation over successive economic cycles and a large portion of the impacted areas has now been abandoned and is undergoing secondary succession. In this
biome, the Lowland Atlantic Forest type is characterized by a lower floristic diversity compared to other types of Atlantic Forests occurring mostly in sandy and nutrient poor soils (Marques et al. 2011). These forests originally covered the southern and southeastern coast of Brazil, in terrains up to 100m of altitude, but its distribution was drastically reduced due to the expansion of cities, real estate market and agricultural areas (Galindo-Leal & Caˆmara 2003). Thus, an effective conservation and management policy for these highly threatened forests is urgently necessary, but little is known regarding their successional trajectory and resilience in order to give support to such practices.
We evaluate the floristic and structural changes across a successional gradient of secondary Lowland Atlantic forests once disturbed by slash-and-burn agriculture in southern Brazil. We compared regenerating forests at 21 (young forest), 34 (immature forest) and 59 (late successional forest) years since abandonment of agricultural practices, seeking to answer the following questions: 1) Do forest structure (basal area and stem density) and species richness, and diversity follow the same successional trajectory in the canopy and the understory? 2) Are the species assemblages in secondary forests associated to the stratum (canopy and understory) and/or successional stage? 3) Are there species that characterize the successional stages and forest strata?
Material and methods
Study siteThe study was conducted in a region of the Atlantic Forest within a protected area (Palmito State Forest, total area of approximately 300 ha) in the municipality of Paranagua´ (25635’S, 48632’W, at sea level) in the state of Parana´, southern Brazil. The climate (Af in Ko¨ppen’s classification) is tropical and superhumid, without a pronounced dry season or frosts. The 46-year running average temperature is 216C; the average annual precipitation is 2,218 mm, and it is always greater than 60 mm during the driest month (Britez & Marques 2005). Soils (Spodozols) are sandy (90-98% sand) and acidic (pH 3.2-3.9; C. Wisniewski pers. comm.).
The southern coast of Brazil is in the Atlantic Forest biome, which includes a complex of vegetation types (mainly forest and scrub) on both upland and lowland areas. In lowland areas, where the soil is composed of marine (Holocene) deposits, the vegetation type is locally called ‘‘restinga’’ (Marques et al. 2011). Specifically, in thePalmitoreserve, the vegetation type is arestingaforest that is very similar in floristics and structure to those typical of Lowland Atlantic forests that are not found over Holocene deposits (Marques et al. 2011). However, the vegetation in the reserve has been modified by the last 100 years of occupation. Historically, agricultural practices have been rudimentary, using subsistence cultivation based on slashing and burning. In thePalmitoreserve, forest cutting, planting and burning for agriculture occurred successively over several years. As a result of these practices, the reserve today is a mosaic of different successional stages (including a very small area of old-growth forest).
agricultural workers and with the Palmitoreserve managers. Despite some uncertainty concerning the exact ages and historical conditions, this is considered an appropriate approach for estimating forest dynamics during succession (Pickett 1989; Foster & Tilman 2000). The three forest stands were relatively close to each other (,1000 m), in the same soil type (Spodozols) and surrounded by old growth and secondary forest fragments, mangroves, and agricultural areas. The three plots had previously been slashed and burned several times for pineapple and manioc cultivation over the course of approxi-mately 10 years, and had then been abandoned. Although replication of sample units would be necessary to allow robust generalizations (Hurlbert 1984), the use of multiple plots in the studied region is virtually impossible, given the highly fragmented and reduced distribution ofRestingaForests. We dealt with this limitation by avoiding the use of analysis requiring variance homogeneity.
Data collection
We placed 10 contiguous 10x10 m subplots in each plot in the young, immature and late successional forests. In each subplot, we sampled all trees and shrubs in both the canopy and understory, selecting individuals with a diameter at breast height (DBH)>4.8 cm and individuals with a height.1 m and a DBH , 4.8 cm, respectively. For each individual, we recorded the species name, the DBH (canopy) and the basal stem diameter (understory). For coppiced trees, we counted the number of stems per individual to estimate the capacity of plant re-sprouting during the succession. We classified each species in shade-tolerant or shade-intolerant, based on previous studies in this forest type (Larcher et al. 2012). Vouchers of the species collected were deposited at the UPCB Herbarium (Herba´rio do Departamento de Botaˆnica da Universidade Federal do Parana´). Species names and family names followed the International Plant Names Index (http://www.ipni.org) and taxa were systematized according to APG III (APG III, 2009).
Analysis
We considered each plot (young, immature and late successional forests) and stratum (canopy and understory) separately to compare species compositions, species richness, Shannon’s index (H’, Log10), and forest structure. To reduce bias due to plot size, lack of replication and differences in plant size between strata, we compared the observed accumulated species richness (S obs) of the canopy and understory assemblages with two different estimators (bootstrap and ACE) using EstimateS (Colwell 2006) software. We used subplots from each plot as the sample units and randomized 1000 times the number of individuals. Successional stages and strata structures were analyzed by comparing the average, height, density and number of stems using Kruskal-Wallis test (Zar 1999).
To visualize differences in species assemblages among the three successional stages and two strata, we performed a multivariate analysis of the communities’ composition using non-metric multidimensional scaling (NMDS) and using species abundance and Bray-Curtis distance; the first two axes were selected a priori (Legendre & Legendre 1998).
The indicator species value (IndVal) approach was applied to find typical species for the young, immature and late successional forests. The indicator value of a species is the
product of its group specificity (Aij) and its group fidelity (Bij): IndValij = Aij x Bij x 100, where Aij is the abundance of species iacross sites in group j divided by the abundance of species i over all groups, and Bij is the number of sites in groupjwhere speciesiis present, divided by the total number of sites in group j. IndVal is maximized (100%) when all individuals of speciesiare found in one group and when that species occurs in all of the plots in that group. The statistical significance of the resulting IndVal was evaluated for each species by a random re-allocation procedure for sites (999 permutations) among the three groups (Dufreˆne & Legendre 1997).
Results
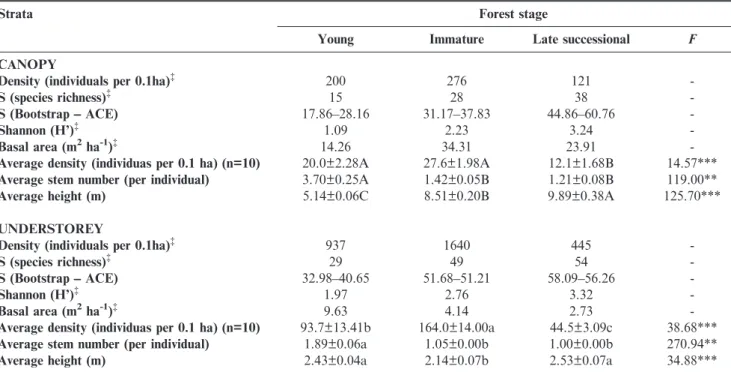
A total of 3,619 individuals from 82 plant species and 36 families were sampled in the three successional stages and two strata (Appendix 1). The understory in the three forests had always higher density than the canopy. In the immature forest, the densest forest, the understory was six times denser than the canopy (Table 1). Species richness and diversity in the understory were higher than in the canopy, in all three forests. The late successional forest had greater understory and canopy species richness and diversity than young and immature forests. When species richness estimators were used, the richness was even higher than the observed, and differences among forests remained (Table 1).
Forest structure changed along the successional gradient. The basal area of the canopy was greater than the understory for all three forests, and peaked in the immature forest, where it was twofold higher than in the young forest and 50% higher than in the late successional forest (Table 1). The average density of canopy trees was significantly higher in young and immature forests (about 50%) than in the late successional forest, whereas young and immature forests did not signifi-cantly differ. All forests differed regarding understory density, with the highest values in the immature forest. The late successional forest had 70% and 50% lower understory density than immature and young forests, respectively (Table 1). Stem ramification, measured as the average number of stems per individual, was highest in the young forest, for both the canopy and the understory strata, whereas immature and late successinal forests did not significantly differ in both strata (Table 1). The late successional forest had the highest average canopy height, while the understory was significantly taller in the late successional and young forests (Table 1).
Community assemblages were distinct in the three forests and in the two strata. The NMDS community ordination values (Kruskal stress = 16.66) showed six well defined groups. The sub-plots of the late successional forest canopy were less clumped in the ordination (Fig. 1).
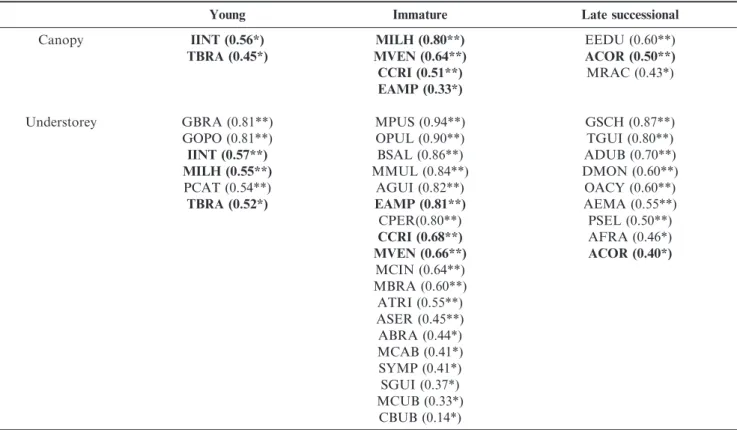
Differences in community assemblages were followed by changes in indicator species (Table 2): the canopies of the three forests were marked by a reduced number of indicator species (young=2, immature=4, late=3), while in the understories, the number of indicator species was much higher (6, 19 and 9, respectively). From the total of 36 indicator species, only 20% were shared between two forests or strata. Shade-intolerant species, such as the trees Ilex integerrima, Ternstroemia brasiliensis, Gaylussacia brasiliensis and Myrcia ilheosensis
Aparisthmium cordatum, Myrcia racemosa and the shrub
Geonoma schottiana, characterized the late successional forest (Table 2). The immature forest exhibited a mix of shade-intolerant species in the canopy (for example,Myrcia ilheoensis
and Myrsine venosa) and shade-tolerant species in the understory (for example, Miconia pusilliflora and Ocotea pulchella) (Table 2). During succession, shade-intolerant trees and shrubs were progressively replaced by shade-tolerant trees and shrubs in the canopy and understory (Fig. 2).
Discussion
Our study encompassing three Lowland Atlantic forests in southern Brazil showed differences between understory and canopy strata among forests differing in age since abandon-ment of impacting activities. The canopy of the forests contained a subset of different species from the respective understory, suggesting that biotic and/or abiotic filters selected the species that reached the canopy during forest development. Species richness, individual abundance, and basal area increase rapidly during the succession, indicating that forest recovery is relatively high in these Lowland Forests.
The species richness (observed and estimated) and diversity in the canopy and understory increased with forest age along the successional gradient. Patterns of changes in species richness and diversity varied across different chronosequence studies and were strongly influenced by soil fertility and land use history (Brown & Lugo 1990; Chazdon 2008). Whereas initial successional areas generally contain few tree species and low diversity (Siminski et al. 2004), the peak of tree diversity might be found in intermediate (Sheil 2001; Kalacska et al. 2004; Liebsch et al. 2007) or in late (Saldarriaga et al. 1988; Chinea 2002) phases of succession. Our results indicate an accumulation of species in the understory and the recruitment of a portion of these species to the canopy. Despite variations in methods and diversity estimates among various studies (Chazdon 2008), the unidirectional increase in species richness in our study was supported even for other stem size inclusion criteria (see Appendix 2). The diversity of the late successional forest (H’canopy = 3.24) is comparable to old-growth forests
(H’= 3.22-5.00) in the Atlantic Forest region (Liebsch et al. 2007; Martini et al. 2007; Siminski et al. 2011), and suggests that 59 years of abandonment is sufficient for recovering a large part of the forest diversity and composition originally found in Table 1.General structural characteristics of the canopy (diameter at the breast height, DBH>4.8cm) and understorey (DBH,4.8cm; h>1m) of three successional Lowland Atlantic forests in southern Brazil. Averages followed by the same letter do not differ (Kruskal-Wallis). **p,0.01; ***p,0.001
Strata Forest stage
Young Immature Late successional F
CANOPY
Density (individuals per 0.1ha){ 200 276 121
-S (species richness){ 15 28 38
-S (Bootstrap –– ACE) 17.86––28.16 31.17––37.83 44.86––60.76
-Shannon (H’){ 1.09 2.23 3.24
-Basal area (m2ha-1){ 14.26 34.31 23.91
-Average density (individuas per 0.1 ha) (n=10) 20.0±2.28A 27.6±1.98A 12.1±1.68B 14.57***
Average stem number (per individual) 3.70±0.25A 1.42±0.05B 1.21±0.08B 119.00**
Average height (m) 5.14±0.06C 8.51±0.20B 9.89±0.38A 125.70***
UNDERSTOREY
Density (individuals per 0.1ha){ 937 1640 445
-S (species richness){ 29 49 54
-S (Bootstrap –– ACE) 32.98––40.65 51.68––51.21 58.09––56.26
-Shannon (H’){ 1.97 2.76 3.32
-Basal area (m2ha-1){ 9.63 4.14 2.73
-Average density (individuas per 0.1 ha) (n=10) 93.7±13.41b 164.0±14.00a 44.5±3.09c 38.68***
Average stem number (per individual) 1.89±0.06a 1.05±0.00b 1.00±0.00b 270.94**
Average height (m) 2.43±0.04a 2.14±0.07b 2.53±0.07a 34.88***
{Estimates for trees with DBH
>5cm and DBH>10cm in Appendix 2, for comparisons.
the study region. Despite our findings, the recovery of forest diversity is not necessarily followed by forest functionality (Dı´az & Cabido 2001), which may take a longer time period and limit ecosystem processes (Liebsch et al. 2008). Therefore, forest conservation and management initiatives should consider the relative fast recovery of diversity and structure but be aware of a possible lag in the recovery of forest functionality.
The chronosequence studied was marked by a peak in basal area and tree density in the intermediate stand, for both the understory and canopy strata; the late successional forest was the least dense stand. In general, young stands are characterized by higher tree densities, lower basal areas and shorter canopy
heights (Saldarriaga et al. 1988; Aide et al. 1995; Denslow & Guzman 2000) and the increase in density and basal area is either asymptotic (Saldarriaga et al. 1988; Piotto et al. 2009) or exhibits a peak in intermediate stands (Aide et al. 1995; Feldpausch et al. 2005). The immature forest is a habitat where the shade-intolerant trees and shrubs of the initial succession are still present and where the shade-tolerant species can also become established, resulting in a dense forest. The decreases in stem density and basal area from the immature forest to the late successional forest suggest a density-dependent (sensu Janzen 1970) mortality mechanism. Thus, the first part of the succession is marked by colonization of shade-intolerant shrubs Table 2. Indicator species (and respectiveIndVals) of three successional Lowland Atlantic forests in southern Brazil. Species acronyms, see Appendix 1. *p,0.05; **p,0.01. In bold, species shared by two forests or strata.
Young Immature Late successional
Canopy IINT (0.56*) MILH (0.80**) EEDU (0.60**)
TBRA (0.45*) MVEN (0.64**) ACOR (0.50**)
CCRI (0.51**) MRAC (0.43*)
EAMP (0.33*)
Understorey GBRA (0.81**) MPUS (0.94**) GSCH (0.87**)
GOPO (0.81**) OPUL (0.90**) TGUI (0.80**)
IINT (0.57**) BSAL (0.86**) ADUB (0.70**)
MILH (0.55**) MMUL (0.84**) DMON (0.60**)
PCAT (0.54**) AGUI (0.82**) OACY (0.60**)
TBRA (0.52*) EAMP (0.81**) AEMA (0.55**)
CPER(0.80**) PSEL (0.50**)
CCRI (0.68**) AFRA (0.46*)
MVEN (0.66**) ACOR (0.40*)
MCIN (0.64**) MBRA (0.60**) ATRI (0.55**) ASER (0.45**) ABRA (0.44*) MCAB (0.41*) SYMP (0.41*) SGUI (0.37*) MCUB (0.33*)
CBUB (0.14*)
and trees; during the second part, there is an accumulation of species (both shade-tolerant and intolerant) in the limited habitat of the immature forest where intraspecific light competition may occur. During the third phase of succession, the establishment of shade-tolerant species occurs, increasing the species richness.
The three forests were marked by the occurrence of multiple stems, especially in the canopy of the young forest (3.7 stems per individual). This most likely resulted from previous land management that had included several instances of slash-and-burn agriculture. Re-sprouting has been cited as an important form of stand initiation in tropical forests (Kammesheidt 1998) and it may lead to the development of the initial cover during the first phases of forest regrowth (Schmidt-Vogt 2001). In the studied areas, after land abandonment, the stems were able to sprout for some period, but with the successional process, re-sprouting trees are replaced by others with single stems. In fact, this ability is restricted to the trees remaining after the first steps in the successional processes because a strong dependence on seed arrival (and not on re-sprouting) was found for the establishment of saplings at the same study sites (Simo˜es & Marques 2007).
We found that the species assemblages for each stratum and forest stage were weakly related and that there was little species convergence among the communities of the three successional forests. Thus, each successional forest is a unique plant community. Species composition appears to vary independently of species richness in the succession and is strongly determined by differences in land use and the colonizing vegetation (Finegan 1996; Chazdon 2003). The three successional forests had similar histories and were embedded in a relatively forested landscape, which potentially allowed for the same possibilities of seed arrival in the three abandoned areas (unpublished data). One possible explanation for the differences in species composition are the age lags between the forests (young to immature forest: 13 years; immature to late successional forest: 25 years) which would be sufficient for the arrival and establishment of allochthonous species, resulting in different species compositions. In addition, it is possible that plant colonization after the abandonment of the area had been affected by the regional landscape that had changed over the 60 years. The 10-30-year-old (phase 2) forest is believed to contrast with the 30-100-year-old (phases 3 and 4) forest in species composition because short-lived pioneers are replaced by long-lived pioneer and non-pioneer species (Finegan 1996). However, our results indicate that species turnover might be more complex than previously suggested and that, even after a long time (59 years), species (shade-tolerant or intolerant) are still being replaced.
Each plant community and stratum was marked by a group of specific indicator species, suggesting a strong specificity (occurrence in a single forest/stratum) and fidelity (occurrence in a large proportion of samples from each forest/stratum) of species during succession. Despite these differences in species, almost all guilds (except shade-tolerant shrubs) were present since the young forest (but in different proportions). Tropical forest succession is characterized by changes in species composition, from herbs, shrubs, vines and fast-growing pioneer tree species during the first 30 years, to long-lived pioneer trees and shade-tolerant species during the following 70-120 years (Finegan 1996). According to the initial floristic composition hypothesis (Finegan 1996; Uhl et al. 1998;
Guariguata & Ostertag 2001; Pen˜a-Claros 2003), species representing all guilds colonize soon after disturbance but reach dominance at different times according to their growth rates and longevities (Egler 1954). Our results support this hypothesis and also agree with the consensus that species composition in forest succession is highly unpredictable (Chazdon 2008).
In the current scenario, tropical forests are being reduced at alarming rates and being replaced by secondary forests in a changing tropical landscape. Knowledge of the mechanisms of forest succession and forest recovery is necessary to guarantee ecosystem functioning in this highly diverse region (Dent & Wright 2009). Our findings showed that the structure of canopy and understorey of successional forests follow approximately the same successional trajectory, but with marked differences in species composition. Thus, the recovery of these fragile Lowland Atlantic forests is relatively fast, but slightly predictable, which should be taken in considerations in future management of these systems.
Acknowledgements
The authors are grateful to Larissa Mellinger and Marina Tadei for field assistance, to IAP (Instituto Ambiental do Parana´) for allowing research in the Palmito Reserve and to CNPq (Brazilian Research Council) for the fellowship to VP Zwiener and F Ramos (Grant 520898/99-0). MCM Marques (Grant 304650/2012-9) and R Marques received a productivity grant from CNPq.
References
Aide, T.M., Zimmermann, J.K., Herrera, L., Rosario M. & Serrano M. 1995. Forest recovery in abandoned tropical pastures in Puerto Rico. For. Ecol. Manag. 77:77––86. http://dx.doi.org/10.1016/0378-1127(95)03576-V
Aide, T.M. & Grau, H.R. 2004. Ecology –– Globalization, migration, and Latin American ecosystems. Science 305:1915––1916.
APG III - Angiosperm Phylogeny Group. 2009. An update of the Angiosperm Phylogeny Group classification for the orders and families of flowering plants: APG III. Bot. J. Linn. Soc. 161:105–– 121.http://dx.doi.org/10.1111/j.1095-8339.2009.00996.x
Britez, R.M. & Marques, M.C.M. 2005. Caracterizac¸a˜o geral. In: Marques, M.C.M., Britez, R.M. (eds) Histo´ria Natural e Conservac¸a˜o da Ilha do Mel. Editora da UFPR, Curitiba, 13––17. Brown, S. & Lugo, A.E. 1990. Tropical secondary forests. J. Trop. Ecol.
6:1––32.http://dx.doi.org/10.1017/S0266467400003989
Chazdon, R.L. 2003. Tropical forest recovery: legacies of human impact and natural disturbance. Perspect. Plant Ecol. 6:51––71. http://dx.doi.org/10.1078/1433-8319-00042
Chazdon, R.L. 2008. Chance and determinism in tropical forest succession. In: Carson WP, Schnitzer lSA (eds) Tropical forest community ecology. Wiley-Blackwell, West Sussex, 384––408. Chazdon, R.L., Letcher, S.G., van Breugel M., M., Martı´nez-Ramos
M., Bongers F. & Finegan, B. 2007. Rates of change in tree communities of secondary Neotropical forests following major disturbances. Phil. Trans. R. Soc.B 362:273––289.http://dx.doi.org/ 10.1098/rstb.2006.1990
Chazdon, R.L., Peres, C.A., Dent, D., Sheil, D., Lugo, A.E., Lamb, D., Stork N.E. & Miller, S.E.. 2009. The potential for species conservation in tropical secondary forests. Conserv. Biol. 23:1046––1417.http://dx.doi.org/10.1111/j.1523-1739.2009.01338.x Chinea, J.D. 2002. Tropical forest succession on abandoned farms in the
Colwell, R.K. 2006. EstimateS: statistical estimation of species richness and shared species from samples. Version 8.0. User’s guide and application published at http://purl.oclc.org/estimates.
Connell, J.H. 1978. Diversity in tropical rain forests and coral reefs. Science 199:1302––1310.
Corlett, R. 1995. Tropical secondary forests. Prog. Phys. Geog. 19:159–– 172.http://dx.doi.org/10.1177/030913339501900201
Denslow, J.S. 1980. Patterns of plant species diversity during succession under different disturbance regimes. Oecologia 46:18––21. Denslow, J.S. & Guzman, G.S. 2000. Variation in stand structure, light and
seedling abundance across a tropical moist forest chronosequence, Panama. J. Veg. Sci. 11:201––212.http://dx.doi.org/10.2307/3236800 Dent, D.H. & Wright, S.J. 2009. The future of tropical species in
secondary forests: a quantitative review. Biol. Conserv. 142:2833–– 2843.http://dx.doi.org/10.1016/j.biocon.2009.05.035
Dı´as, S. & Cabido, M. 2001. Viva la diffe´rence: plant functional diversity matters to ecosystem processes. Trends Ecol. Evol. 6: 646––655. Ding, Y., Zang, R., Liu, S., He F. & Letcher, S.G. 2012. Recovery of
woody plant diversity in tropical rain forests in southern China after logging and shifting cultivation. Biol. Conserv. 145:225––233. http://dx.doi.org/10.1016/j.biocon.2011.11.009
Dufreˆne, M. & Legendre, P. 1997. Species assemblages and indicator species: the need for a flexible asymmetrical approach. Ecol. Monogr. 67:345––366.
Egler, F.E. 1954. Vegetation science concepts: Initial floristic composition – a factor in old-field vegetation development. Vegetatio 4:412––417. Feldpausch, T.R., Riha, S.J., Fernandes, E.C.M. & Wandelli, E. 2005. Development of forest structure and leaf area in secondary forests regenerating on abandoned pastures in Central Amazonia. Earth Interact. 9:1––22.http://dx.doi.org/10.1175/EI140.1
Finegan, B. 1996. Pattern and process in neotropical secondary rain forest: the first 100 years of succession. Tree 11:119––124. Foster, B.L. & Tilman D. 2000. Dynamic and static views of succession:
testing the descriptive power of the chronosequence approach. Plant Ecol. 146:1––10.http://dx.doi.org/10.1023/A:1009895103017 Galindo-Leal, C. & Caˆmara, I.G. 2003. Atlantic Forest hotspot status:
an overview. In: Galindo-Leal, C., Caˆmara, I.G. (Eds.), The Atlantic Forest of South America: Biodiversity Status, threats and outlook. CABS and Island Press, Washington, 3––11.
Guariguata, M.R. & Ostertag, R. 2001. Neotropical secondary forest succession: changes in structural and functional characteristics. For. Ecol. Manag. 148:185––206. http://dx.doi.org/10.1016/S0378-1127(00)00535-1
Holl, K.D., Loik, M.E., Lin, E.H.V. & Samuels, I.A. 2000. Tropical Montane forest restoration in Costa Rica: overcoming barriers to dispersal and establishment. Rest. Ecol. 8:339––349. http:// dx.doi.org/10.1046/j.1526-100x.2000.80049.x
Hurlbert, S H. 1984. Pseudoreplication and the design of ecological field experiments. Ecol. Monogr. 54:187––211. http://dx.doi.org/ 10.2307/1942661
Janzen, D.H. 1970. Herbivores and the number of tree species in tropical forests. Am. Nat. 940:501––528.http://dx.doi.org/10.1086/282687 Kalacska, M., Sanchez-Azofeifa, G.A., Rivard, B., Calvo-Alvarado,
J.C., Journet, A.R.P., Arroyo-Mora, J.P. & Ortiz-Ortiz D. 2004. Leaf area index measurements in a tropical moist forest: a case study from Costa Rica. Remote Sens. Environ. 91:134––152.http:// dx.doi.org/10.1016/j.rse.2004.02.011
Kammesheidt, L. 1998. The role of tree sprouts in the restoration of stand structure and species diversity in tropical moist forest after slash-and-burn agriculture in Eastern Paraguay. Plant Ecol. 139:155––165.http://dx.doi.org/10.1023/A:1009763402998
Larcher, L., Boeger M.R.T., Marques M.C.M.. 2012. Biomass allocation and shade tolerance in tree species of the Atlantic Forest. Botany 90:830-838.http://dx.doi.org/10.1139/b2012-053 Larkin, C.C., Kwit, C., Wunderle Jr, J.M, Helmer, E.H., Henry, M.,
Stevens, H., Roberts, H.T.K., & EwertD.N.. 2012. Disturbance type and plant successional communities in Bahamian Dry Forests.
Bi ot ropic a 44 :1 0–– 18 . ht t p : / / d x. d oi . o r g/ 1 0. 11 11 / j . 1 7 44 -7429.2011.00771.x
Legendre, P. & Legendre L. 1998. Numerical Ecology, Elsevier, Amsterdam.
Letcher, S.G. & Chazdon, R.L. 2009. Rapid recovery of biomass, species richness, and species composition in a forest chronose-quence in Northeastern Costa Rica. Biotropica 41:608––617.http:// dx.doi.org/10.1111/j.1744-7429.2009.00517.x
Liebsch, D., Goldenberg R. & Marques, M.C.M. 2007. Florı´stica e estrutura de comunidades vegetais em uma cronosequ¨eˆncia de Floresta Atlaˆntica no Estado do Parana´, Brasil. Acta Bot. Bras. 21:983––992.http://dx.doi.org/10.1590/S0102-33062007000400023 Liebsch D., Marques, M.C.M. & Goldenberg, R. 2008. How long does
the Atlantic Rain Forest take to recover after disturbance? Changes in species composition and ecological features during secondary succession. Biol. Conserv. 141:1717––1725. http://dx.doi.org/ 10.1016/j.biocon.2008.04.013
Long, W., Yang X. & Li, D. 2012. Patterns of species diversity and soil nutrients along a chronosequence of vegetation recovery in Hainan Island, South China. Ecol. Res. 27:561––568. http://dx.doi.org/ 10.1007/s11284-011-0923-3
Marques, M.C.M., Swaine, M.D. & Liebsch, D. 2011. Diversity distribution and floristic differentiation of the coastal lowland vegetation: implications for the conservation of the Brazilian Atlantic Forest. Biodivers. Conserv. 20:153––168.http://dx.doi.org/ 10.1007/s10531-010-9952-4
Martini, A.M.Z., Fiaschi, P., Amorin A.M.A. & Paixa˜o, J.L. 2007. A hot-point within a hot-spot: a high diversity site in Brazils Atlantic Forest. Biodivers. Conserv. 16:3111––3128. http://dx.doi.org/ 10.1007/s10531-007-9166-6
Mesquita, R.C.G., Ickles, K., Ganade, G. & Williamson, B. 2001. Alternative successional pathways in the Amazon Basin. J. Ecol. 89:528––537.http://dx.doi.org/10.1046/j.1365-2745.2001.00583.x Norden, N., Chazdon, R.L., Chao, A., Jiang Y. & Vilchez-Alvarado, B.
2009. Resilience of tropical rain forests: tree community reassembly in secondary forests. Ecol. Lett. 12: 385––394. http://dx.doi.org/ 10.1111/j.1461-0248.2009.01292.x
Pen˜a-Claros, M. 2003. Changes in forest structure and species composition during secondary forest succession in the Bolivian Amazon. Biotropica 35:450––461.
Pickett, S.T.A., Collins, S.L. & Armesto, J.J. 1987 Models, mechanisms and pathways of succession. Bot. Rev. 53:335––371. http:// dx.doi.org/10.1007/BF02858321
Pickett, S.T.A. 1989. Space for time substitution as an alternative to long-term studies. In: Likens GE (ed) Long-term studies in Ecology. Springer-Verlag, New York. 110––135. http://dx.doi.org/ 10.1007/978-1-4615-7358-6_5
Piotto, D., Montagnini, F., Thomas, W., Ashton M. & Oliver C. 2009. Forest recovery after swidden cultivation across a 40-year chronose-quence in the Atlantic forest of southern Bahia, Brazil. Plant Ecol. 205:261––272.http://dx.doi.org/10.1007/s11258-009-9615-2
Saldarriaga, J.G., West, D.C., Thrp M.L. & Uhl C. 1988. Long-term chronossequence of forest succession in the upper Rio Negro of Colombia and Venezuela. J. Ecol. 76:938––958. http://dx.doi.org/ 10.2307/2260625
Schmidt-Vogt, D. 2001. Secondary forests in swidden agriculture in highlands of Thailand. J. Trop. For. Sci. 13:748––767.
Sheil, D. 2001. Long-term observations of rain forest succession, tree diversity and responses to disturbance. Plant Ecol. 155:183––199. http://dx.doi.org/10.1023/A:1013243411819
Siminski, A., Mantovani, M., Reis M.S. & Fantini A.C. 2004. Sucessa˜o florestal secunda´ria no municı´pio de Sa˜o Pedro de Alcaˆntara, litoral de Santa Catarina: estrutura e diversidade. Cieˆnc Flor. 14:21––33. Siminski, A., Fantini, A.C., Guries, R.P., Ruschel A.R. & Reis, M.S.
Simo˜es, C.G. & Marques, M.C.M. 2007. The role of sprouts in the restoration of Atlantic Rain Forest in southern Brazil. Rest. Ecol. 15:53––59.http://dx.doi.org/10.1111/j.1526-100X.2006.00189.x Uhl, C. 1987. Factors controlling succession following slash-and-burn
agriculture in Amazonia. J. Ecol. 75:377––407. http://dx.doi.org/ 10.2307/2260425
Uhl, C., Buschbacher, R. & Serra˜o, E.A.S. 1998. Abandoned pastures in eastern Amazonia: I. Patterns of plant succession. J. Ecol. 76:663––681.http://dx.doi.org/10.2307/2260566
Wright, S.J. & Muller-Landau, H.C. 2006. The future of tropical forest species. Biotropica 38:287––301.
Zar, J.H. 1999. Biostatistical analysis. Prentice-Hall, New Jersey. Zwiener, V., Cardoso, F.C.G., Padial, A.A. & Marques, M.C.M. 2014.
Disentangling the effects of facilitation on restoration of the Atlantic Forest. Bas. Appl. Ecol. 15:34––41. http://dx.doi.org/ 10.1016/j.baae.2013.11.005
Appendix 1. Checklist, life forms (LF: T = tree, S = shrub) and densities (per 0.1 ha) of 82 species sampled in three successional Lowland Atlantic forests in southern Brazil. YCAN= young forest –– canopy, YUND = young forest –– understorey, ICAN = immature forest - canopy, IUND = immature forest - understorey, LCAN = late successional forest –– canopy, LUND = late successional forest –– understorey.
Acronyms Species Family LF YCAN YUND ICAN IUND LCAN LUND
ABRA Abarema brachystachya(DC.) Barneby & J.W. Grimes
Fabaceae T 0 1 2 15 0 3
ACOR Aparisthmium cordatum
(Juss.) Baill.
Euphorbiaceae T 0 0 0 0 5 22
ADUB Attalea dubia(Mart.) Burret
Arecaceae T 0 0 0 0 2 11
AEMA Annona emarginata
(Schltdl.) H.Rainer
Annonaceae T 0 0 0 1 0 11
AFIR Aniba firmula(Nees & Mart.) Mez
Lauraceae T 0 0 0 0 0 2
AFRA Andira fraxinifoliaBenth. Fabaceae T 5 3 9 4 9 14
AGLA Alchornea glandulosa
Poepp.
Euphorbiaceae T 0 0 0 0 1 0
AGUI Amaioua guianensisAubl. Rubiaceae T 0 1 0 98 2 6
ASAL Aiouea salignaMeisn. Lauraceae T 0 0 0 0 0 3
ASER Annona sericeaDunal Annonaceae T 0 0 0 13 1 1
ATRI Alchornea triplinervia
(Spreng.) Mu¨ller Arg.
Euphorbiaceae T 0 3 0 17 0 5
BSAL Blepharocalyx salicifolius
(Kunth) O.Berg
Myrtaceae T 0 7 1 43 0 0
CATR Cyathea atrovirens
(Langsd. & Fisch.) Domin
Cyatheaceae T 0 0 0 0 1 0
CBRA Calophyllum brasiliense
Cambess.
Calophyllaceae T 1 0 3 16 2 12
CCAN Cabralea canjerana(Vell.) Mart.
Meliaceae T 0 0 0 0 1 0
CCON Cordiera concolor(Cham.) Kuntze
Rubiaceae T 0 0 0 0 1 1
CCRI Clusia criuvaCambess. Clusiaceae T 0 13 11 65 0 17
CMIC Coussapoa microcarpa
(Schott) Rizzini
Urticaceae T 0 0 0 0 1 0
CPER Cybianthus peruvianus
(A.DC.) Miq.
Primulaceae T 0 0 3 80 3 12
CRUB Calyptranthes rubella
(O.Berg) D.Legrand
Myrtaceae T 0 0 0 8 0 0
CSCR Clethra scabraPers. Clethraceae T 0 4 2 4 1 6
DAPH Daphnopsissp. Thymelaeaceae T 0 0 0 0 0 1
DMON Dendropanax monogynum
(Vell.) Seem.
Araliaceae S 0 0 0 0 0 15
EAMP Erythroxyllum amplifolium
Baill.
Erythroxyllaceae T 0 10 3 36 0 0
EEDU Euterpe edulisMart. Arecaceae T 0 0 0 0 13 3
EPAN Endlicheria paniculata
(Spreng.) J.F.Macbr.
Lauraceae T 0 0 0 0 0 4
FORG Ficus organensisMiq. Moraceae T 0 1 0 0 0 0
GAUS Guatteria australlisA. St. 0Hil.
Annonaceae T 1 14 3 55 1 54
GBRA Gaylussacia brasiliensis
(Spreng.) Meisn.
Ericaceae S 0 355 0 0 0 0
GGAR Garcinia gardneriana
(Planch. & Triana) Zappi
Clusiaceae T 0 0 0 0 1 0
GHIR Guapira hirsuta(Choisy) Lundell
Nyctaginaceae S 0 1 0 0 0 0
GMAC Guarea macrophyllaVahl Meliaceae T 0 0 0 0 0 2
Appendix 1.Continued.
Acronyms Species Family LF YCAN YUND ICAN IUND LCAN LUND
GOPO Guapira opposita(Vell.) Reitz
Nyctaginaceae T 5 81 3 5 0 3
GSCH Geonoma schottianaMart. Arecaceae S 0 0 3 2 4 64
HBRA Hedyosmum brasiliense
Mart.
Chloranthaceae T 0 0 0 0 0 3
HSIL Heisteria silvianiiSchwacke Olacaceae T 0 0 0 1 0 2
HUMB Handroanthus umbellatus
(Sond.) Mattos
Bignoniaceae T 0 0 0 0 0 1
IDUM Ilex dumosaReissek Aquifoliaceae T 0 0 1 4 1 0
IINT Ilex integerrimaReissek Aquifoliaceae T 151 226 99 126 6 17
IPSE Ilex pseudobuxusReissek Aquifoliaceae T 0 1 0 0 0 0
JPUB Jacaranda puberulaCham. Bignoniaceae T 0 0 0 0 1 1
LFRU Laplacea fruticosa
(Schrad.) Kobuski
Theaceae T 0 0 0 5 0 0
MBRA Maprounea brasiliensisA. St.-Hil.
Euphorbiaceae T 0 2 1 1 1 1
MBRA Myrcia brasiliensisKiaersk. Myrtaceae T 0 0 0 12 0 4
MCAB Miconia cabussuHoehne Melastomataceae S 0 0 0 12 1 2
MCIN Miconia cinerascensMiq. Melastomataceae S 0 0 0 62 0 14
MCUB Miconia cubatanensis
Hoehne
Melastomataceae S 0 0 0 10 0 0
MDIC Myrcia dichrophylla
D.Legrand
Myrtaceae T 0 0 0 5 0 3
MELA Melastomataceae sp. Melastomataceae S 0 0 0 3 0 0
MGAR Myrsine gardnerianaA. DC.
Primulaceae T 0 0 0 1 0 0
MGUI Matayba guianensisAubl. Sapindaceae T 0 0 0 0 0 3
MILH Myrcia ilheosensisKiaersk. Myrtaceae T 4 88 50 67 5 5
MMUL Myrcia multiflora(Lam.) DC.
Myrtaceae T 0 1 6 29 8 2
MPUL Myrcia pulchra(O.Berg) Kiaersk.
Myrtaceae T 0 0 0 1 0 0
MPUS Miconia pusilliflora(DC.) Naudin
Melastomataceae S 0 0 0 153 0 0
MRAC Myrcia racemosa(O.Berg) Kiaersk.
Myrtaceae T 0 0 2 14 12 12
MROB Maytenus robustaReissek Celastraceae T 1 0 2 0 2 1
MSCH Maytenus schumanniana
Loes.
Celastraceae T 0 4 0 4 0 0
MVEN Myrsine venosaA. DC. Primulaceae T 1 9 36 62 4 2
NOPO Nectandra oppositifolia
Nees & Mart.
Lauraceae T 0 0 1 1 0 4
OACY Ocotea aciphylla(Nees & Mart.) Mez
Lauraceae T 1 0 1 3 2 20
OAMI Ossea amygdaloidesTriana Melastomataceae S 0 3 0 25 0 0
OARB Ormosia arborea(Vell.) Harms.
Fabaceae T 0 2 0 0 0 2
ODIS Ocotea dispersa(Nees & Mart.) Mez
Lauraceae T 0 0 0 0 0 2
OPUL Ocotea pulchella(Nees & Mart.) Mez
Lauraceae T 8 46 10 506 10 3
PCAT Psidium cattleianumAfzel. ex Sabine
Myrtaceae T 3 19 4 0 3 0
PGLA Pera glabrata(Schott) Poepp. ex Baill.
Peraceae T 2 1 1 9 1 6
Appendix 1. Continued.
Acronyms Species Family LF YCAN YUND ICAN IUND LCAN LUND
PHOF Psychotria hoffmannseggi-ana(Willd. ex Schult.) Mu¨ll. Arg.
Rubiaceae S 0 0 0 8 0 6
PMYR Prunus myrtifolia(L.) Urb. Rosaceae T 0 8 0 2 0 3
PSEL Podocarpus sellowii
Klotzsch ex Endl.
Podocarpaceae T 0 0 0 5 2 13
PVENO Pouteria venosa(Mart.)
Baehni
Sapotaceae T 0 0 0 0 3 0
RUBI Rubiaceae sp. Rubiaceae S 0 0 0 0 0 1
SANG Schefflera angustissima
(Marchal) Frodin
Araliaceae T 0 0 1 3 3 2
SGUI Sloanea guianensis(Aubl.) Benth.
Elaeocarpaceae T 0 0 0 0 1 1
SGUI Siphoneugena guilfoyleiana
Proenc¸a
Myrtaceae T 0 0 0 5 0 0
SYMP Symplocossp. Symplocaceae T 0 1 0 11 0 2
TBRA Ternstroemia brasiliensis
Cambess.
Pentaphylacaceae T 15 31 16 23 0 1
TGUI Tapirira guianensisAubl. Anacardiaceae T 0 0 1 4 4 34
TIBO Tibouchinasp. Melastomataceae T 0 1 0 0 0 0
UNKN Unknown sp. Unknown T 0 0 1 0 0 0
XBRA Xylopia brasiliensisSpreng. Annonaceae T 0 0 0 1 0 0
XLAN Xylopia langsdorfianaA. St.-Hil. & Tul.
Annonaceae T 1 0 0 0 1 0
Appendix 2. Comparative forest structure (canopy) for different tree sizes.
Young forest Immature forest Late successional forest
DBH>5cm DBH>10cm DBH>5cm DBH>10cm DBH>5cm DBH>10cm
Density (per 0.1ha) 165 10 248 95 118 61
S (species richness) 14 4 25 15 38 27
Shannon (H’) 0.98 1.28 2.14 1.38 3.25 3.05