FUNDAÇÃO GETULIO VARGAS
ESCOLA DE ADMINISTRAÇÃO DE EMPRESAS DE SÃO PAULO
ALEXANDRE JACOB DAHAN
OPERATIONAL FUNCTIONS FOR INNOVATIVE STARTUPS IN FRANCE
FUNDAÇÃO GETULIO VARGAS
ESCOLA DE ADMINISTRAÇÃO DE EMPRESAS DE SÃO PAULO
OPERATIONAL FUNCTIONS FOR INNOVATIVE STARTUPS IN FRANCE
Thesis presented to Escola de Administração de Empresas de São Paulo of Fundação Getulio Vargas, as a requirement to obtain the title of Master in International Management (MPGI).
Knowledge Field: Startup
Advisor: Prof. Dr. Servio Tulio Prado Junior
Digite aqui o sobrenome e o nome do autor - Ex: Silva, João da.
Digite aqui o título da obra / Digite aqui o nome e o sobrenome do autor (ordem direta) - Ex: João da Silva. - Digite aqui o ano de publicação.
Digite aqui o total de folhas f.
Orientador: Servio Tulio Prado Junior
Dissertação (MPGI) - Escola de Administração de Empresas de São Paulo.
1. Empresas novas - França. 2. Empreendedorismo. 3. Recursos
humanos. 4. Acionistas. I. Prado Junior, Servio Tulio. II. Dissertação (MPGI) - Escola de Administração de Empresas de São Paulo. III. Título.
FUNDAÇÃO GETULIO VARGAS
ESCOLA DE ADMINISTRAÇÃO DE EMPRESAS DE SÃO PAULO
OPERATIONAL FUNCTIONS FOR INNOVATIVE STARTUPS IN FRANCE
Thesis presented to Escola de Administração de Empresas de São Paulo of Fundação Getulio Vargas, as a requirement to obtain the title of Master in International Management (MPGI).
Knowledge Field: Startup
Advisor: Prof. Dr. Servio Tulio Prado Junior
Approval Date ___/___/___
Committee members:
_______________________________ Prof. Dr. Servio Tulio Prado Junior
_______________________________ Prof. Dr. Antonio Gelis Filho
ACKNOWLEDGEMENTS
I would first like to thank professor Servio Tulio Prado Junior, who has been here to help me in a very tight schedule, both from an academic and scientific point of view, in his valuable indications as to the content of the research. He has accepted to be my supervisor and has always taken the time to answer my questions. He understood this research thesis was directly linked to my professional aspirations (I am currently working for a startup studio in Paris). I welcome him warmly for all his help.
Then, I would like to thank Mrs. Abuilt, member of HEC incubator and Mr. Arlotto, co-director of Audencia incubator, for their answers and kindness.
I would also like to thank Mr. Augustin-Radu from Centrale Paris incubator (who agreed to make an exception to help me as I am not graduated from Centrale Paris) and Mrs. Cauwet from the Network Plus club, for her assistance in sharing the questionnaire and its intermediation among incubated startups.
ABSTRACT
This thesis will try to understand the importance of operational functions in French startups. A huge flexibility in tasks to be covered and a horizontal management characterize startups. Thus, it is very uncommon for newly created companies like startups to have a clear human resources management policy. Indeed, every partner or people in the startup may be brought to think about very large issues such as sales, business development, commercialization, marketing and technology or product development.
This thesis will not scrutinize each task or the time spent at working in each of these tasks. It will rather look for the perception of the allocation preferences regarding each key function of the newly company. Whatever the sector in consideration or the startup stage of maturity, key functions that are perceived to make the startup successful are research & development and commercialisation. Managerial functions are not the most important ones. Technology-oriented startups consider the “CEO function” as key whereas services startups do not put so much importance in it. Serial entrepreneurs might put more attention to marketing and fundraising functions rather than management function. Indeed, as experienced entrepreneurs, they also anticipate middle-term issues. Finally, entrepreneurs often have a bias regarding their academic background because they overestimate functions they think they can do compared to functions they are able to do.
This thesis will try to show the link between operational functions exercised by a partner and the shares he owns in the startup. This link depends on the number of partners (known as shareholders), the type of partners (principal shareholders or secondary shareholders) and the impact of corporate governance regarding equity distribution. This work will lead to quantify and measure the importance of each basic function in newly created companies.
In the end, it appears that partners’ responsibilities can explain equity distribution even if this criterion is not unique and sufficient enough. Indeed, functions’ importance is only one of the factors explaining equity distribution. Entrepreneurs perceive R&D and commercialization as Moreover, the thesis has also pointed out some limits (non-operational partners are neglected and assuming linearity of equity distribution based on functions’ respective weight might not be the best approach).
Key words: Entrepreneurship, startups, functions, equity, human resources
RESUMO
Nessa tese, é buscado um maior entendimento sobre a importância das funções operacionais
nas startups francesas. Uma grande flexibilidade das tarefas a ser coberta e uma gestão
horizontal caracterizam as startups. Desse jeito, não é muito comum para as empresas
recentemente criadas como as startups ter uma politica clara de recursos humanos. Na
verdade, cada participante na start-up pode ser levado a pensar de forma diferente em termos de vendas desenvolvimento de negócios, comercialização, marketing, tecnologia ou desenvolvimento de produto.
Essa tese não vai explorar cada uma dessas tarefas. Mas vai procurar para identifcar a percepção sobre a alocação ótima de recursos para cada função chave da nova empresa. Qualquer seja o setor de mercado em consideração ou o estágio de amadurecimento da startup, funções chaves que são percebidas como sendo a base para start-ups bem sucedidas
são pesquisa & desenvolvimento e comercialização. Funções de liderança não são tão
importantes. Somente a startup focada na tecnologia tem uma "função de chefe executivo"
com maior importância do que as startups médias. Além disso, empreendedores em série, bem sucedidos ou não, focam predominantemente aspectos relacionados ao marketing e à captação de recursos em detrimento de aspectos ligados à gestão do negócio. No final, os empresários, muitas vezes tem um preconceito ao respeito da sua formação acadêmica porque ele
sobrestimam funções que eles pensam poder fazer em comparação das funções que eles são
capazes de fazer.
Nessa tese, intent-se demonstrar a relação entre as funções ocupadas por um sócio e as ações
que ele possui na startup. Essa relação depende do número de sócios (conhecido como
acionistas), o tipo de sócios (acionistas principais ou acionistas segundarias) e o impacto na
administração corporativa a respeito da distribuição do capital próprio.
CONTENTS
1. Introduction 7
2. Preliminary notes and definitions 10
2.1. Innovation as the match between market and ingenuity 10
2.2 The startup phenomenon and its different types 12
2.3. Sweat equity as operational partners’ equity 14
3. Literature review and hypothesis 15
3.1 The importance of key functions in companies 15
3.1.1. Key functions’ characteristics in companies 15 3.1.2. Influence of sector, stage of development and entrepreneur profile in the function distribution and their respective weight 20 3.2. Functions distribution between operational partners and equity distribution 22
3.2.1. Linking functions and equity distributions 22 3.2.2. Team typology and entrepreneurial experience linked to
equity distribution model 23
3.3. Summary of research hypotheses 30
4. Methodology 32
4.1. Startups sample 32
4.2. Variables 33
4.2.1. Independent variables 33
4.2.2 Dependent variables 33
4.3. The survey 34
4.3.1. A simplified survey in order to measure a perception 34 4.3.2. The measure of the startup characteristics 34 4.3.3. The measure of the founders characteristics 35 4.3.4. The characteristics of the “answerer” founder 35 4.3.5. The determination of each function’s weight in the startup 36
5. Results 37
5.1. Descriptive statistics 37
5.1.1. Independent variables analysis from the model 37 5.1.2. Functions distribution in the different startups 45
5.1.3. Equity distribution in startups 47
5.2.1. Functions distribution in startups 50 5.2.2. Equity distribution within the startups 54
6. Discussion 57
6.1. Main findings 57
6.1.1. Functions’ weight within the startup 57
6.1.2. Linking functions distribution and equity 59
6.2. Limits 60
6.2.1. Non-operational partners 60
6.2.2. Partners’ functions in equity distribution model 61
7. Conclusion 62
References 63
Figure and Graphics table 65
1. Introduction
Entrepreneurship and innovation are often seen as a solution to economic stagnation in period of high unemployment rate. Historically, economic crisis have given great innovations. As an example, IBM, Disney, Microsoft and Apple have been created during an economic recession. Economists and politicians have understood the role of entrepreneurship during hard times: productivity increase, innovation, employment and growth. A favourable ecosystem might even be created in order to make people create their own company. Main predispositions to foster entrepreneurship are a well-educated population, not afraid of taking risks and able to spot promising business sectors and niches. These predispositions also need an environment with low regulatory constraints. In the US, only six proceeds and only six days are necessary to create a company. There is not the same flexibility in the French context (The World Bank Databank, 2015).
[Annex 1 – Favorable environment for the development of innovative startups]
French employed population works in a company with less than 50 employees. In the US the majority of active workforce is employed in a big company (more than 250 employees). Thus, French employment structure is specific but there still is difficulty for French companies to reach a critical size (INSEE, 2014).
French people have a positive vision of entrepreneurship: 65% of 18-25 years old French people believe starting a company is a good choice (INSEE, 2014). The “auto-entrepreneur” status has enabled a swift increase in startup creation in France: the number of company creation has doubled between 2006 and 2009. French minister of Economics and Finance has just announced - on January 22nd, 2016 - he will triple the turnover limit of the “auto-entrepreneur” status (meaning auto-entrepreneurs can now triple their activity and still take advantage of fiscal niches awarded by this status). Unlike general believes, France is the most dynamic country for startup creation in Europe: startups creation has rose by 20% in United Kingdom between 2006 and 2009 whereas it has decreased in Germany between the same 3-year period. However, there is psychological blockage in France regarding fear of failure: only 35% of French people believe they have the core competencies to start a business (as opposed to 55% of American people). Another big obstacle is the difficulty to raise equity in France. As an example, French SMEs equity is half as big as UK SMEs.
However, we cannot ignore the impact of 2009-2011 financial crisis in Europe. Over this 2-year period, there has been a stagnation in startup creation. Today, it is still very difficult to measure the positive impact on the French economy of the “auto-entrepreneur” status.
promising startup at their first stage of development (“early stage”). Since the dot.com bubble and the numerical revolution, startups in France have become an important eco-system in the collective imaginary.
Key literature regarding startup innovation is full and diverse, especially in the US. However in France, most of studies have tried to understand the ecosystem in which startup creation happens but not the process of creation itself. This can easily be explained by the lack of public information collected regarding French newly created companies, compared to other countries. Literature is very mature regarding the first aspect but only starting regarding the second aspect (especially the functions of each operational partner/founder). Moreover, very few literatures have tried to understand the link between both aspects. In order to search for the optimal balance between key functions in a startup, I have realized a survey (online through the website SurveyMonkey and offline through interviews) of more than 150 startups founders.
This thesis will first look at better understanding founders priorities in their day-to-day activities based on the function they ensure. Then, this thesis will question equity distribution between shareholders through two specific perspectives: each partner’s responsibilities in the startup (without taking into account financial contribution or contribution in kind) and the factors startup literatures highlight (corporate culture, previous experience, sector-specificity skills, etc.). The goal here is to allow new factors to emerge explaining equity distribution while refining existing factors.
2. Preliminary notes and definitions
In order to delimit the reflexion, key elements will be defined such as the innovation concept, the startup typology and also the sweat equity concept.
2.1. Innovation as the match between market and ingenuity
It is hard to completely define innovation. There are different forms of innovation. The Oslo Manual (The Organisation for Economic Co-operation and Development's, 2015) has
developed the following typology:
- “Product innovation: a good or service that is new or significantly improved. This includes significant improvements in technical specifications, components and materials, software in the product, user friendliness or other functional characteristics”;
- « Process innovation: a new or significantly improved production or delivery method. This includes significant changes in techniques, equipment and/or software »;
- « Organisational innovation: a new organisational method in business practices, workplace organisation or external relations »,
- « Marketing innovation: a new marketing method involving significant changes in product design or packaging, product placement, product promotion or pricing”; - “Technological innovation: this only corresponds to product and/or process
innovations”.
Therefore, an innovative company can be seen as a company putting in place or trying to reach in the short-term one (or simultaneously several) of the precedent innovations.
develop new products and processes” (ibid). According to Joseph Schumpeter, innovation can take several forms:
- As the introduction of a new product or a new key characteristic for a existing product;
- As the introduction of new production method in a large industry;
- As the opening of a new market, that was not existing before or that was not seen as viable before;
- As the use of new raw material sources or components for the manufacturing of a new product;
- As the creation of a new model in an industry.
Innovation is not equal to invention. An innovation can be defined as an invention that has met an appropriate market.
Here, innovation will be defined “a process that delivers added value and newness to an organization, suppliers and customers by the development of new processes, procedures, solutions, products, services, new methods of commercialization and/or business model by a small entrepreneurial or large established firm in an open or closed system” (McFadzean et al. 2005).
It was not detected in this research any specific tool used by French official statistics organisms in order to better evaluate innovation. Today, INSEE considers that “innovative sectors are linked to Information and Communication Technology (ICT), pharmaceuticals, biotechnologies and new materials. They are subcategorized in 41 type of activities”. We can wonder whether or not it is a good idea to categorize innovative companies in closed sectors and not taking into account the smooth and multi-functional application of innovative startup. As an example, in which category would Google be put if we follow the French nomenclature? Google is a search engine company (google.com), as well as a connected-object company (Nest), a online advertising company (Google Adwords), a social network company (Google +), a software and a cloud computing company (Google for Businesses).
developed through work experiences to develop a new product (very few student of just-graduated worker create their company in France). His characteristics are also the following ones: “an associative capacity, questioning behavior, the sense of observation, experimentationand networking skills” (J.H. Dyer, H. Gregersen, C.M. Christensen, 2010).
2.2. The startup phenomenon and its different types
Pierre Vernimmen defines a startup as "a company that has just been launched by managers and shareholders. It has no past or significant tangible assets and often operates in a highly moving technological environment. Finally, its cash flows are negative: their specific risk level is very high which is why it has no other choice but to be financed by equity” (P. Vernimmen, 2005). This financial definition highlights the fact that a start-up is a young company, which operates in a risky sector (its survival depends more on its rapid growth than on its technological lead). However, this definition does not distinguish the startup from any other business creation. Steve Blank, Stanford professor and serial entrepreneur, adds a strategic dimension. He believes a startup is a company created in order to seek a new business model that is repeatable and scalable. The two key concepts of “repeatable” and “scalable” that clarify the definition of P. Vernimmen are essential. The reproducibility refers to an innovative aspect. The startup opens up a market in which other companies (both new and mature companies) will rush, as they will be able to replicate a model or technology, or integrate a new market. Scalability refers to another distinctive feature of startups: the concept of growth. A startup aims to grow very rapidly on an exponential model. This growth is explained not only by the attractiveness of its product/service in its home market, but also a natural tendency to early internationalization. To sum-up, an attempt to define a startup could be a young company, innovative about its product or its marketing method, which is experiencing rapid growth in sales and the value of its equity.
We must also understand entrepreneurship as the allocation of scarce resources to strategic objectives in order to reduce the risk associated with the value of capital gathered by the partners. Alexander Osterwalder tried to shape the business model of as start-up following the previous definition.
[Annex 2 – How to build a business model?]
The startup phenomenon is not measured or inventoried in France. First, it is because the very definition of a startup is legally complex/ To give an idea of the number of innovative startups in France, we can take into account the number of companies that collect funding from venture capital funds: 678 in 2013, 983 in 2014, 1456 in 2015. This represents a very small sample of potential startups. Indeed, being financed in France means these companies have reached a critical size and have greatly reduced the risks inherent to the business’ development (product development, customer acquisition, first contracts, etc.). However, more than 500,000 businesses are created each year in France, all sectors included, innovative or not. This lack of inventory is primarily linked to the perception of innovation.
TPE’s or SME’s: its growth will be the key factor whatever the group you pick. However, to limit the size characteristic, it is reasonable to consider that from a certain size (but which one?), the definition of startup is no longer viable even if growth remains strong. Indeed, beside the size, a startup is primarily a management model, a lack of binding structures and informal links between employees. In France, small companies that become mid-cap companies often share the same characteristics as successful startups: strong growth, advanced internalization (70% of cases, according to KPMG) and close links with large companies. Reaching this critical size would be a paradigm shift for the company, which would pass to a new stage of development and a new internal organization.
From a purely financial perspective, a startup is characterized by a relatively low initial equity, which quickly takes significant value through partners’ efforts to make it grow. This is called sweat equity.
2.3. Sweat equity as operational partners’ equity
Originally, sweat equity was used to indicate capital gain made in real estate through the work begun by an amateur investor to create a property value and resell it. By extension, the term is applied to equity for startups. The sweat equity is different than simple shares remuneration. It reflects a real link between equity (and higher risk), and partner’s resources. The founding partner, operational partners and only some employees may get sweat equity. The sweat equity is opposed to "financial equity", that is gathered from non-operating partners. Boylan (1999) has justified the concept of sweat equity through Intellectual Property (IP): the IP creator must have access to his property (morally speaking). This access is guaranteed by equity. Talati (2004) points out that modern form joint stock companies allows employees’ intellectual contributions to be recognized. The sweat equity was primarily a compensation value for an intellectual production that traditional wages could not fairly compensate.
gets is not greater than an average salary he will get outside this startup. Wang et al. (2009) showed that economic considerations were a key factor behind an employee devotion to a large company. Giving equity instead of salary to new partners is a way to build trust and retain them. Projected equity is the perception of the startup potential future success. According to several researches, technical expertise (Hisrich et al, 2010. Roberts, 1991; Starr and MacMillan, 1990), talent management (Bruno and Tyebjee, 1985), and previous entrepreneurship experience (Hisrich et al, 2010;. Sandberg and Hofer, 1987) are parameters that explain the success or failure of a startup. These criteria are by extension the key factors for understanding a employee’s propensity to accept equity instead of salary in a startup. Another centeal factor is the degree of involvement of startup stakeholders (Laumann 1982; McAllister, 1995). Studies have shown the importance of strategic human resources management (particularly key technological experts) and the need for the entrepreneur to retain these skills in the company.
We must also consider equity distribution from the perspective of game theory (with asymmetric information). In a startup, the stakeholder holding “financial capital” (most of the time, investors like VCs) and the stakeholder that holding “human capital” do not have same resources and expected returns. Both “holders” will negotiate to find satisfaction in order to optimize the use of resources in order to create as much financial value as possible. Equity is a mean to reach this satisfaction.
[Annex 3 – Sweat equity deal structuration]
An entrepreneur will also see equity as a way to control the company or at least as an instrument of control. Cohan (2012) reminds us the entrepreneur will seek external equity funds only if it is vital for the startup development. Indeed, the main risk after letting a VC funds acquire some equity is the lost of control. The venture capital firm will then have other power such as a member in the steering committee (at least one member representing the venture capital firm), appointing a new managing director is the startup performance is not good enough, and even replace the founding entrepreneur and/or CEO. Equity is the most precious resource for an entrepreneur but equity dilution can threaten its control and its future financial gain.
!"#$%&#'()%*&+,-%.$+%/&$.#&(/#0(1&0,.&#-%.#2.#-#(./&"3,&-##4&+$/35&6,"#7#.8&/(+3&+,-%.$+%/&$.#&7#.*&+,/%1*5&9-4##48& 7$1(#&,0&4)/%.):(%#4&#'()%*&.#2.#/#-%/&;&%,&<=&%)>#/&7$1(#&,0&/(+3&+,-%.$+%&?)-&+$/3@5
!"#$%&'$(')&%&'$*%+,$+',
!"#$%&'$(-&./*0(12(2223 124(+,(5&+6(#"7(81(22239
:*;&+#+#<(-&./*(+,('"#-*%$*6(+#$"(*=/+$>
?=/+$>(+,(-&./*6("#(@".."7+#<('%+$*%+&0 ?A+$(+#(B($"(C(>*&%,
:*$/%#(*A5*'$*6(DE24(5*%(>*&%(8F?("%(G!($>5*9 H/''*,,(%&$*("@(,$&%$/5('%*&$+"#0(1IB
!&,)J@."7,
!"#$%&'$(-&./* 12(2223 F&+6(+#('&,) 1(2223 F&+6(+#('&5+$&. K(2223
?A+$ C(>*&%,
:*$/%# E24
H/''*,,(%&$* BB4
L*&%, 2 1 E B M C
N;"/#$(8O22239 KP2 12PQ 1BP2 1CPR 1QPS EEPM
!"#$%&'$(-&./* 12(2223 F&+6(+#('&,) 1(2223
?=/+$>(-&./* EE(M22IBB4(T(RE(S2223
Regarding previous remarks, my research question will be:
In a startup, which functions should be considered as crucial in order to search for the
allocation preferences of available resources for the founding-entrepreneur and its partners?
3. Literature review and hypothesis
3.1. The importance of key functions in companies
3.1.1. Key functions’ characteristics in companies
As Keating remind Brise and Olivares (2007) have explained, the research focused on human resources have little or no consideration for startups. They almost never have dedicated departments or a formal policy regarding startups, and are more interested in large companies. At the same time, research I could find on entrepreneurship turned away from human resources management, seen as antithetical to growth and flexibility because perceived as bureaucratic and cumbersome.
Human resources are nonetheless a key parameter for the success of a startup (Aldrich and Eangton, 1997. Heneman, Tansky and Camp 2002; Katz, Aldrich, Welbournc and Williams, 2000). However, as explained by Leung (2003), the entrepreneur will have to face the difficulty of recruiting staff, and allocate useful tasks to the growth of the company. This is already true for the recruitment of partners (equity-interested member of the team), but also employees who will soon be necessary for the company. The reasons highlighted are the lack of resources, a lack of legitimacy (Barber, Wesson Roberson, and Taylor, 1999; Williamson 2000) or informal recruitment methods, based on personal “fit” or “feeling” (Heneman. Tansky, and Camp, 2000), and based on use of existing network at the creation of the startup (Aldrich and Eangton, 1997; Barber et al, 1999).
project the success (or not) of the startup (Bhide, 1994). The transition from the first phase to the second one is following what the author calls a “leadership crisis”. As the company grows, the need for tasks formalization and working relationships arises. The founder will now be asked to tackle managerial and secondary tasks (not linked to operations and/or execution). It does not necessarily master this kind of tasks. Thus, in order to continue its growth, the company will no longer need a pure entrepreneur but rather a manager.
Thus, the most common issue which startup faces in the transition from phase 1 to phase 2 is: - The lack of managerial skills from the founder-entrepreneur (familiar with horizontal
management but not vertical management) and;
- The difficulty to access skilled-employees who can maintain the initiated growth (Drucker, 1994).
If the human resources management is underdeveloped because of its lack of formalization, some studies have examined the entrepreneur behavior according to the stage of development of the startup. As there is no tasks formalization similar to a mature company, researchers have studied what entrepreneurs actually do their startup development. This research have followed two paths:
- The first one is to determine which activities lead the startup emergence (hence an early stage for the startup);
- The second one is to determine the tasks performed by entrepreneurs when the stage of development of its startup is more advanced.
This distinction depending development stages is justified by studies highlighting entrepreneurs’ change of behavior as the startup grows (for example one could mention to Hambrick and Crozier, 1985; McCarthy, Schoenecker and Krueger, 1990). These developments are in line with the life cycle of their product / service.
development. These first steps will give the startup some legitimacy and increase the probability of reaching the stage of promotion and marketing/commercialization of its product. Besides this approach by activity, other authors have been interested in the allocation of time for each activity. Lichtenstein et al. (2006) measured the tasks performed by entrepreneurs in six different startups. They have highlighted the following tasks: investing funds, develop a prototype, determining in which market should the product be launched, build up a team, legally build the company, get an office (office, computers, telephones), open a bank account and seek funding. McCarthy et al. (1990) and Cooper et al. (1997) also put forward eight main activities in terms of time spent: manage employees, keeping accounts, contact customers, manage the production, taking care of maintenance, maintenance supplier relationship, seek funding and make a detailed schedule.
In conclusion, we can see that almost all entrepreneurs’ tasks at the early stage are either unique tasks (or at least not recurring) in the life of the company, or either tasks that have an unreasonable weight compared to mature business tasks (knowing the startup tends to reach a “mature” phase)
[Annex 4 – Common management and behavioral patterns of entrepreneurs across life cycle stages]
Decisions will be following more formal procedures. The entrepreneur will then turn away from activities directly related to the development and commercialization of the product in order to focus on more managerial tasks. However, other activities (accounting / finance, relationships with suppliers, for example) will remain in its scope.
Hence, the thesis will deeply takes into account this two specific aspects.. For the first part, it will not try to gather specific tasks of the startup partners. Rather, it will look to use the organizational framework of mature companies to understand how they divide their resources. This allocation will not be based on time spent (as in many research studies) but instead according to the company's global resources (time, capital, etc.) by asking entrepreneurs how much credit they give to each function based on a specific scenario. By associating tasks by function, we can compare each startup to one another but also compare startups with mature companies. The second part will be to study the different proportions of allocated resources to each function of the company, and to estimate optimum perceived by entrepreneurs. There is a real advantage for entrepreneurs, to better understand how to allocate the resources of their startup (and then by growing, their company), not strictly as an urgency or issue to be solved but in a medium-term vision to achieve generation revenue and growth.
The purpose of this tasks distribution will be to build an average empirical mapping and explain the greater or lesser volatility of each function. This mapping will be explained by taking into account three key criteria: the startup sector, the stage of development and the startup entrepreneur’s profile.
3.1.2. Influence of sector, stage of development and entrepreneur profile in the function distribution and their respective weight
leader (Greiner, 1998). These tasks will therefore appear subordinates. We can assume they represent a small share of allocated resources. The volatility of this share will be low depending on sectors but higher depending on the stage of development. Indeed, with the search for funding and recruitment needs, the startup will gradually acquire control structures to improve efficiency. For functions that could be considered central to the success of the startup, we can bring out two main profiles, dependent on the technological and innovative aspect of startups (using an “a priori” reasoning). In the case highly technology-oriented startup, research and development as well as production functions will overwrite other functions like marketing or sale. Conversely, in the case service-oriented startup, marketing and business development will be dominant.
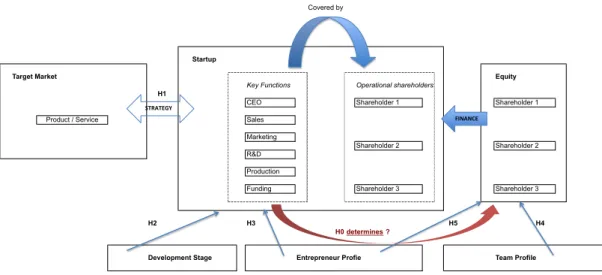
Here is the theoretical framework summarizing above literature and taking into account several parameters that will be thesis’ core hypothesis:
Figure 1 – Graphic representation of research hypotheses and research dynamic
H1: The importance of each function in the startup is positively correlated with the importance of this function for the startup strategy (based on entrepreneurs’ point of view).
Of course, this analysis needs to be dynamic. As argued above, the development stage of the startup has a direct influence on founder efforts and the aspects of the project on which it will focus. Within the same sector, it may be interesting to analyze the evolution of the weight of each function in relation to the stage of project development. Regarding the literature, the following hypothesis can be formulated:
Covered by
Startup
Target Market Equity
Key Functions Operational shareholders
H1
CEO Shareholder 1 Shareholder 1
Product / Service Sales
Marketing
Shareholder 2 Shareholder 2 R&D
Production
Funding Shareholder 3 Shareholder 3
H2 H3 H5 H4
H0 determines ?
Development Stage Entrepreneur Profie Team Profile
!!!!!!"#$"%&'(
H2: The weight of each function in the startup will progressively reach a balance depending of the development stage of the startup (reaching a balance being defined as equal weight for each function in the long-term).
Another parameter to consider is the entrepreneur’s profile. Indeed, past experience and the entrepreneur education (mainly his degree) will overweight certain criteria in relation to others.
H3: The weight of some functions will be positively correlated with the archetypal functions of the entrepreneur’s profile.
Hence, from the literature, the function distribution can be modeled as follows:
Resources allocated to an operational function = F (sector, stage of development, partners’
profile, team profile)
3.2. Functions distribution between operational partners and equity distribution
3.2.1. Linking functions and equity distributions
Once functions mapping is established, the next step is to study the link between these functions and equity distribution.
Our reasoning will focus on the allocation of capital in the start-up and determinants of the latter.
(2011) emphasized the importance of having diverse and abundant resources to allow the initial development of the product. To maximize its resources, the entrepreneur will appeal to other individuals who will assist him in the development of the company, with or without financial contribution. Those who join the startup will be part of the founding team. At the beginning, the dilemma is who will receive equity and how. Kotha and George (2012) proposed a tree of choice according to the willingness of the entrepreneur to distribute equity.
[Annex 5 – A model of perceived fair equity distribution in startups and its impact on team interaction
and outcomes]
entrepreneur has evaluated ex ante the resources needed and the contribution of each of the resource to the success the startup, that being done in a risky and changing context (Alvarez and Barney, 2005). Therefore, there is no obvious and/or unambiguous and/or operational link between resources added at the beginning of the company and equity distribution. The literature highlights other factors than contributions in equity distribution (developed below).
From here, the reasoning is twofold:
- Knowing that it is quite difficult to assess today newly added resources to the startup, we can consider equity distribution as depending on theoretical distribution of past (partner ability to solve issues so far) and future tasks (depending on partner’s profile), based on their strategic importance for the startup;
- Conversely, it seems easy to assess added resources so that equity distribution depends on each partner’s contribution. In this case, partners with most important added resources will be in charge of the most critical functions.
Hence, this link between equity and partner’s role can be added to additional criteria highlighted by literature to explain equity distribution: entrepreneur’s previous experience (who probably makes more cautious when deciding equity distribution) links between team members, governance considerations (control vs. equality) etc. Therefore, an additional hypothesis needs to be added:
H0: There is a link between the startup key functions covered by a partner and the equity he owns in the company.
3.2.2. Team typology and entrepreneurial experience linked to equity distribution model
Team’s creation and characteristics
distinction between founding entrepreneur (the literature called it “focal entrepreneur”) and the team of partners who joined him. The founder- entrepreneur has the original idea to create a business. He surrounded himself by attracting a more or less constricted and committed team (part-time work or full time, partner or employee, etc.). Lazear (2002) highlighted the fact that entrepreneurs are often generalists with skills in various areas, and an important aspect of their work is to combine different talents. The entrepreneur is able to identify investment opportunities, knows how to combine existing resources in an innovative way, but he is lacking of accurate knowledge and needs specialists to develop his project. The team construction is central in the initial stages of his entrepreneurial adventure.
Thompson (2011) developed a three-step model for team constructions. The first step is to analyze the task (task type, autonomy of the team, interdependence with other tasks in the startup, etc.). Then, the manager must determine who are the people best able to fulfill this task (technical or managerial skills, interpersonal skills, team members complementarity). The last step is to put in place explicit or implicit standards to carry out this task. From the beginning, the founding partner has to link the core tasks for the startup develoment with members of his team. His goal in building up the team is to find the best partners / collaborators that will complement the resources they already have (financial, technical, or other). An essential condition for the startup success is the entrepreneur's ability to quickly detect the most critical resources for the development of the startup and to unite the team around him in order to obtain the resources promised by each to achieve his goals. The literature uses several analytical frameworks to understand how to gather these two objectives.
Taking the perspective of social capital analysis (defined as an organization which depends on its environment to obtain resources) several studies have investigated whether interests’ matching of the founding team was done based on the confidence the team gave to the focal entrepreneur (related to previous relationships), or based on the focal entrepreneur’s resources and profiles (equity, expertise, previous experience of entrepreneurship, etc.) or both. The results showed a correlation with the latter hypothesis (Binks et al., 2006; Lin et al., 2006; Mosey et al, 2006), highlighting the importance people gave to entrepreneur’s ability to mobilize resources other than its own ones. This is what creates confidence (Alix & Krieger, 1999; Krieger, 2001).
skills for the startup and integrate various resources for a common purpose. Again, the notion of trust is very operative. Wu et al. (2009) emphasize the importance of trust not only to acquire strategic resources for the company, but also to increase all team members’ involvement. Therefore, it will increase the comparative advantage of the startup.
There have been work about startup creation in the Sociology field. Ruef, Aldrich and Carter (2003) have highlighted five different aspects to explain team formations:
- “Hemophilic” aspect, which considers that teams are built up because of similarities between individuals (age, sex, ethnic criteria);
- “Functional” aspect, which takes into account the characteristics used by individuals to achieve a goal (leadership, specific skills, etc.);
- “Social” aspect, which highlights the fact that individuals with the highest social status will attract more than those with lower social status (network);
- “Ecological” aspect, which gives importance to the ecosystem surrounding the team (geography, industry). The constitution of a team within the framework of a business creation will take into account these different shades with varying degrees of salience.
To sum up, team constitution responds to a strategic problem for a startup while being modulated by sociological considerations. Studies have questioned the type of resource needed at first such as the link between the homogeneity or heterogeneity of the team (and resources) and the performance of the startup. The results are mixed. While some studies highlight the homogeneity as a key criterion for success in the early stages, heterogeneity appears to be a more creative value from a certain stage of development (Steffens, Terjesen, Davidsson, 2012). Other studies showed the link between university degrees and past management experience of the team for the startup to be successful (Colombo and Grilli, 2009). Degrees in management schools combined with industry expertise are the two features that stand out.
Team typology and corporate culture
We can distinguish several human resources management styles in an innovative startup. Baron and Hannan (1996) pointed out informal human resources policy startups. By conducting interviews, the authors realized that the majority of entrepreneurs had no formalized ideas on recruitment policy. From three criteria, (employees’ motivation, the selection process and the control on the labor force), the two authors have developed five unconscious models of human resources management: the star model, the engineering model, the commitment/relationship model, the bureaucracy model and the autocracy model. Above all, they have shown that founding team’s characteristics at the time of creation have an influence on the informal policy implementation. Human resources policy appears as a reflection of the culture of the company and links built between partners and employees.
These different human resources management types help to give an accurate collaboration typology for the startup. They have an impact by deciding which spirit will embody the company. They reflect the personality and the objectives of the focal entrepreneur. They represent relational capital (Clark and Mills, 1979; Fiske, 1992):
- Equality scheme, which tries to balance resources between partners; - Authoritarian scheme, which allocates resources based on hierarchy;
- Value scheme, which distributes resources based solely on their intrinsic value (monetary);
- Community scheme, where resources are divided into functions individual needs. Thus, the different types of teams highlighted by Baron and Hannan (1996) may unconsciously adopt these relationship patterns.
From there, one can imagine that equity distribution is influenced by each of these models at the startup creation. Depending on the focal entrepreneur vision of his desired team (ideal team), on priority gave to recruitment and corporate culture, his willingness to allocate equity will be more or less egalitarian.
Management and governance within the team
Previous hypothesis H4 must be linked with team governance. A major aspect of equity distribution is to allow both founding entrepreneur control on the startup governance (thus on shares structures: majority vs. voting rights) and the right pay (only in equity at the beginning, assuming the startup cannot afford at its creation to give a salary to its partners) for other partners regarding the work they have already done or the work they will do. Equity will be modulated in relation to these issues. For example, in case of strong family ties, Kotha and George (2012) showed a greater propensity to use highly egalitarian distributions. This is explained by emotional ties but also by the desire to avoid frustration by creating symbolic differences between the shareholders. In contrast, serial entrepreneurs are able to distribute their equity in a very selective way, as they can convince their partners that even a small share of capital greatly remunerate their efforts. Again, a perceived fairness is at the heart of the distribution process. Marquis and Margolis (2012) gathered interviews from entrepreneurs regarding equity distribution in their businesses. Entrepreneurs recognized that equity issue does not expect a rational and accountable answer, but rather a practical and partly emotional processing. They even call to use an arbitrator to avoid future disputes.
In total, team typology and entrepreneur's profile have been highlighted to explain distributions (hypothesis H4). However, a model trying to determine the fair equity allocation should take into account partners’ objectives: to give a partner a clear control over the company, to maintain strict equality between the partners and all intermediate situations that may exist.
The focal entrepreneur’s profile
integrate into its business network in a quicker and more user-friendly way, which will ensure the success of the company.
Merz, Schroeter and Witt (2010) tried to determine more precisely what kinds of experiences would be most useful for startup founders. Their results have highlighted the importance of previous experience in the industry on the same level as previous entrepreneurial experience. They have concluded that a one-year experience in a specific industry is enough for a substantial effect on the startup newly created.
H5: Past entrepreneurship experience is negatively correlated with the capacity to allocate equity equally.
Thus, literature points out several factors to explain equity distribution variation within a startup (other than pure contribution assessment). We can model the equity allocated to each partner as follows:
Equity = F (importance of functions covered in the startup, personal contribution, team
typology, focal entrepreneur’s profile, startup governance’s goal, number of partners)
For simplicity purpose, we will neglect personal contribution in this model. Even if they are an essential element of negotiation between partners, we will only consider startups where contributions are negligible (either because they are of equal value or because they are small). Above all, early stage startups have very little equity. For example, in the United States, initial equity for startups is quite low: 26% of start-ups have less than 5000$, 60% have under 50,000$ at the beginning (K. McCaffrey, 2003). Startups for which our assumptions are limited represent a good proportion of startups cases.
Thus:
Equity = F (importance of functions covered in the startup, team typology, focal
entrepreneur’s profile, startup governance’s goal, number of partners)
3.3. Summary of research hypotheses
H0: There is a link between the startup key functions covered by a partner and the equity he owns in the company.
H1: The importance of each function in the startup is positively correlated with the importance of this function for the startup strategy.
H2: The weight of each function in the startup will progressively reach a balance depending of the development stage of the startup.
H3: The weight of some functions will be positively correlated with the archetypal functions of the founder profile.
4. Methodology
4.1. Startups sample
The startups sample used in the research is generally composed of two types of companies: startups with low technological dimension, from incubators of business schools (HEC, Audencia Nantes) and engineers (Centrale Paris); more technology companies from the Network Plus club (helping program for the creation of high tech companies). On the sample of 180 companies, 66 will thus belong to the category "High Tech", 101 to the category "Low Tech". 13 startups have been excluded because the information was not exhausted or not detailed enough to be useful. These 13 startups would probably have misestimated the main findings and conclusions if kept in the exploited sample. In terms of stage of development, the sample is composed of very young companies ("seed," or newly created companies) which have not yet sold their product or are still at the stage of product development and definition of their business plan (companies created from beginning of 2014 until end of 2015), to more mature companies that have already registered real commercial success (early / growth stage). The oldest company in the sample was founded in 1980, although this is anecdotal compared to the average age of the startups sample: 4.7 years. The aim of this dual sample is to measure clear differences in the perception of functions importance in relation to the intensity of technological innovation. The use of these structures (incubators, associations, clubs) can make a first selection on the typology of companies included in the sample: low technological orientation for business schools or engineering schools incubators but high technological potential for the Network Plus club. Structures like incubators have made a clear selection in the projects they choose to support in order to pick those with the highest potential. Part of startups funding in France goes through these kind of structures. Being incubated maximizes the probability of receiving funding, the incubator offering a brand and a label to the startup, as a privileged access to sources of funding (start-up contest, business angels, venture capital funds). This is a strong signal of probability of success (however, sometimes the project is still under-defined).
concrete work experience). The incubated companies have not reached a certain stage of development and are still very risky. Although we can easily say they have a higher probability of success compared to startups that are not advised by this kind of structure, we cannot allow to straightly conclude from this sample of incubated startups the idea of “success” or the idea of “optimal structure”. The founders’ team of incubated startups is often the only to command and execute, knowing that startups have not yet significant financial resources (and incubators are often a paying service for providing different kind of help to startups). This observation needs to be tempered by the gain of visibility well-known French incubators are starting to have (seeing the success of their previous incubated startups): the HEC Incubator was founded in 2007, Audencia incubator in 2003, the incubator of Centrale Paris in 2000. However, the bias is different for the Network Plus club: startups incubated are quite mature, the founders are generally more diverse and experienced and financial resources are higher. As a conclusion, if biases exist per “sub-sample”, the entire sample is representative of innovative start-ups in France.
A total of 169 startups have responded to the survey. If some responses were not complete (very few startups have skipped one answer or not entirely answer to it), all had exploitable data for the whole thesis or some part of the thesis.
4.2. Variables
4.2.1. Independent variables
Several independent variables will be used to test the research hypotheses: the startup sector, the stage of development, the number of operational founders, the type of team and the previous experience of founders. These are nominal qualitative variables.
4.2.2. Dependent variables
early investors (small equity share with little or no operational functions), operational partners (large equity share with high operational functions in the startup) and late investors (small equity share and little or no operational functions).
4.3. The survey
4.3.1. A simplified survey in order to measure a perception
The survey (available in Annex 8) was designed to capture the perception of an optimum. The survey structure has been designed for the entrepreneur to be influenced by his own experience to capitalize on its expertise. Thus, the survey starts by questioning the company itself, then the entrepreneur’s profile, before leaving reality in order to ask fictional questions: how would you do today? This methodology limit is that it does not measure a real phenomenon but a fictional one. It would have required using more intrusive questions and conducting face-to-face interviews with the entire sample, in order to precisely measure the distribution of each function using the time spent on it and by classifying each job afterwards. Similarly, in order to get an average equity distribution between founders, it would have required asking for actual repartition between those founders. This approach has two significant limits: it is very time-consuming, and above all it is limited by the unwillingness of founders to provide such sensitive information as equity distribution. In order to maintain simplicity and to maximize the scientific value of obtained results, concessions had to be made.
A requirement related to the implementation approach concerns the person of the startup that had to answer the survey. For reasons of consistency and convergence of perceptions, the survey was sent to operational shareholders of the startup. Indeed, only the latter have an overview of the startup and are at the heart of all issues studied: equity distribution, strategic importance and the distribution of functions.
4.3.2. The measure of the startup characteristics
magazine 1 (a reference in France for business and startups): Services, Social Network/Collaborative startup, Technology and Telecom, Health and Biotech, Sustainable Development and “others”. By combining startup origin and type of sector, the sample has been divided into 2 categories depending of technological intensity: weak technological intensity (“Services” startups across all startups and from incubated startups in Business Schools) and high technology intensity (other sector and from Network Plus club).
The second startup characteristic that I have sought to measure is the startup’s development stage. The approximation retained is the company's creation date. Indeed, after having considered a development stage based on clear segmentation (creation of business with founders association and business status filled // first recorded sales, development of customer panel, first hires // rapid growth sales, funds seeking), constraints linked to survey format lead to adopt the other approach.
4.3.3. The measure of the founders characteristics
A key parameter is the size of the team. The survey limits the number of founders to 5. This limit was estimated as being the one that was losing the lesser information while keeping a simple way to answer the survey (MCQs rather than enter a precise number). Before building up the survey, I have found on press release and public startup information that it is quietly uncommon to see newly created companies with more than 5 business founders at the beginning.
In order to simplify team typology proposed by the literature review, the survey was limited to define three types that correspond best to interviewed entrepreneurs: a Star model (a generalist background team), the Engineering model (a team of specialists), the Commitment/Relationship model (a team bounding by friendship relationship or other similar relationship like family). The other models have been neglected considering that they corresponded to more mature startups, not concerned with creation.
4.3.4. The characteristics of the “answerer” founder
profile (management-business / engineering / medical). Another aspect taken into account is the entrepreneurial experience. To pursue my effort of simplicity, but also because the literature emphasizes that only the first year of experience is statistically significant, the question is limited to determine whether there was or not experience, not to deeper characterize this experience.
4.3.5. The determination of each function’s weight in the startup
5. Results
5.1. Descriptive statistics
5.1.1. Independent variables analysis from the model
The sample is large enough so that each independent variable is statistically representative of the population studied. Indeed, the sample represents 180 startups answers while there are less than 30,000 companies created each year in France. This leads to a confidence level up to 95% as the number 180 startups is enough to statistically represent the whole startups
!"#$%&'(')'*$++,%-'.,/0&'12'34&'5,%"1$6'789&:&89&83'5,%",/0&6
!"#$"%&' ()*%'#+,-+"./0'#/ 1,//$%&'+"./0'#/ 2,).3$.4
5'63,# 789 :'6;+<+:'&'6,* 9=
5'#>$6'/ =?
@'"&3;+<+A$,3'6; ?B
5)/3"$."%&'+C'>'&,D*'.3 E
5,6$"&+('30,#FG2,&&"%,#"3$>'+/3"#3)D 8
H3;'#/ =
I4' 789 J+B+K'"#/ =L
A'30''.+B+".M+L+K'"#/ 87
N+L+K'"#/ 87
()*%'#+,-+,D'#"3$,."&+-,).M'#/+O'P$/3$.4Q 788 7 7R
B 8R
? L7
= 7E
L R
:KD'+,-+3'"* 7LE I+/3#,.4+%,).M$.4+3'"*+O-#$'.M/G-"*$&KQ =L
I+4'.'#"&$/3+3'"*+0$3;+;$4;+D,3'.3$"&+ BL
I+3'"*+,-+/D'6$"&$/3/+0$3;+F'K+'PD'#3$/' EE
1#'>$,)/+'.3#'D#'.')#/;$D+'PD'#$'.6' 788 S'/ LB
(, 77=
I6"M'*$6+D#,-$&'+,-+3;'+T"./0'#'#T 788 U.4$.''#$.4+G+:'6;.$6"& ?L
V"."4'*'.3 LB
1;CG1;"#*"GV'M$6"& ?9
C,)%&'+"6"M'*$6+%"6F4#,).M =W
H3;'# B
()*%'#+,-+,D'#"3$,."&+-,).M'#/+OM'/$#'MQ 78L 7 9
B L=
? 9=
= 7E
tendency in one year in France. This means that the information extracted form the sample is well representative of what would have been extracted if one could have interview the 30,000 existing startups in France. The correlation matrix (Figure 4) shows quite a few connections between the independent variables, highlighting their intrinsic explanatory nature of analyzed phenomena. However, there are some questions raised by the matrix:
- The link between the sector (and thus the technological aspect) and the academic profile and the answerers;
- The entrepreneurial experience and the profile of the entrepreneur; - The startup sector and its stage of development;
- The age of the startup and its number of founders.
Additional analysis (Chi 2 test) was conducted on these four points, showing that the sector and the academic profile were not independent (the more the sector is technology-oriented, the more PhDs/Pharmas/Doctors are implied; conversely, the lesser the technology is key, the more management entrepreneurs have answered the relevant questions in the survey), as well as the entrepreneurial experience and the entrepreneur's profile (serial entrepreneurs are !!!!!!!"#$%&'!(!)!*'+,!+,-!./+,-+&-!-'0#+/#1,!12!+!.'3'4/#1,!12!#,-'5',-',/!0+&#+63'.
!"#$"%&' (')*#$+,$-. /'". 0000000123'4$",$-.
5206$78&90,'*8.-&-7$*"& !"&:'0-;050$;0,8'0),"#,:+0$)08$78&90,'*8.-&-7$*"&0-#$'.,'3 <=>? <=@A
B20C7' 1,"#,:+0"7'0)$.*'0$,)0*#'",$-. @=DD @=EA
>20F:G%'#0-;0;-:.3'#)0H'I$),$.7J F:G%'#0-;0;-:.3'#)0$.0,8'0*:##'.,0),#:*,:#' B=K? 5=<5
@201,#-.70&$.L)0$.0,8'0,'"G !"&:'0-;050$;0$,0$)0"0;"G$&9M;#$'.30,'"G <=B? <=@K
K20N.,#'+#'.':#)8$+0'I+'#$'.*' !"&:'0-;050$;0,8'0".)O'#'#08")0"&#'"390".0'.,#'+#'.':#)8$+ <=>5 <=@E 'I+'#$'.*'
D20/"."7'G'.,0%"*L7#-:.3 !"&:'0-;050$;0,8'0".)O'#'#08")0;-&&-O'30G"."7'G'.,0 <=KK <=K *-:#)')
E20P8".7'0$.0.:G%'#0-;0;-:.3'#) ($;;'#'.*'0%',O''.0,8'0"*,:"&0.:G%'#0-;0;-:.3'#)0".30 <=BA 5=<E
clearly dominated by management profile entrepreneurs or dual background entrepreneurs), the startup sector and its development stage (the more mature companies are the most technological ones). Finally, the older the startup is, the more it has a high number of partners. The strong correlation between the number of real partners and the number of desired partners was expected. In the end, the risk of multi-collinearity between the variables can be ruled out, a test using the variance inflation factor has been practiced and proving conclusive (vj no greater than 2).
The sector
Regarding sectors, the sample is concentrated on three main areas: Telecommunications (34%, n = 44), Services (18%, n = 76) and Biotech (11%, n = 22). This distribution is particularly true in the Network Plus sample, incubators of business schools being largely dominated by services companies. Sectors where startups highly represented are rather limited. Especially, based on an historical perspective, on the one hand, samples tend to become more and more specialized and on the other hand, startup creations reflect fluctuant market needs and/or market conditions (as a consequence of new networks emergence, new technologies or the need for outsourcing, for example). Thus, startups from Network Plus club used to be mainly dominated by Telecom startups and are now dominated by Biotech startups if we take into account the last 2 years (among the 29 startups that have answered and that have over 5 years of existence, 49% were in the Telecom sector; among the 21 startups that
!!!!!!!"#$%&'!(!)!*+&&',-.#+/!0-.!+2!-!3','4.#+/!+2!#/5'6'/5'/.!7-&#-8,'3
!"#$"%&' ( ) * + , - .
(/01$23&405'6378&82$6"& (9::
)/0;2' :9)( (9::
*/0<=>%'#08?0?8=7@'#A0B'C$A5$72D :9(* :9(E (9::
+/0F5#8720&$7GA0$7053'05'"> H:9:+ :9:( H:9:E (9::
,/0I75#'J#'7'=#A3$J0'CJ'#$'76' H:9:* :9(* :9:+ :9:* (9::
-/0K"7"2'>'750%"6G2#8=7@ H:9)+ H:9:L H:9:* :9:* :9). (9::
./0M3"72'0$707=>%'#08?0?8=7@'#A0B@'A$#'@ H:9(+ H:9:- H:9-( H:9:, :9:: :9(: (9::
have answered and that have less than 2 years of existence, 61% were in the Biotech sector). The trend is similar in other sample: for the HEC Incubator, 59% of startups that have answered and that have less than 2 years of existence are focused on Services while 40% of startups with more than 5 years of existence were focused in the Telecom sector. This highlights entrepreneur’s ability to identify investment opportunities and understand the market in which it operates.
!" #" $!" $#" %!" %#" &!"
'%!!&" %!!&" %!!(" %!!#" %!!)" %!!*" %!!+" %!!," %!$!" %!$$" %!$%" %!$&" %!$(" %!$#" !"#$%&'()(*(+,#",-$.('"/#012($/"(3/#"(4,1,#56()78(.,#",-$.9(
Age
The average age of startups from the sample is 4.3 years, which means that the sample is quite mature. 45% (n = 111) of startups have more than two years of existence. The older startup was created in 1990 while the younger one has not yet filled company creation statuses. Here again, a comparison between sub-samples is instructive: the Network Plus sample is more mature than the sample with schools incubators.
!!"# $%"# &'"# ("#!"#$"# !"#$%&'()(*(+,'-."(/&0-"&123.4(( )*+,#-#)*.*+/0## 1*234+*5## 6*7.8,#-#94/8*+,## 1:5874;7<.*#=*3*./>0*;8## 1/+47.#?*8@/2A# B8,*25## !"#$ %""#$ &"#$ '"#$ &"#$ ("#$ )"#$ *"#$ )"#$ +"#$ +"#$ )"#$ '#$ %"#$ %,#$ %"#$ ,"#$ )"#$ ,"#$ '"#$ ''#$ )"#$ '"#$ +"#$ &#$ %'#$ '"#$ %"#$ ,"#$ ,'#$ %"#$ ,"#$ +"#$ ,"#$ +#$ ,"#$ %"#$ ,"#$ %'#$
%"#$ %'#$ %'#$ +"#$ +#$
%"#$
-,""+$ ,""+$ ,"")$ ,""'$ ,""*$ ,""&$ ,""($ ,""!$ ,"%"$ ,"%%$ ,"%,$ ,"%+$ ,"%)$ ,"%'$ !"#$%&'()(*(+,#",-$.(/&.,"&0-123(4526-123($4"(.4',2"(254"(174(
Number of operational founders (existing)
The average number of partners in the startups sample is 2.9 founders. 39% (n = 70) of startups sample are composed of 2 founders, 33% (n = 55) are composed of 3 founders. We can notice that the number of partners is linked to the age of the startup: on average, startups with 2 or 3 partners have 8 years old, those composed with 5 partners have more than 15 years old. This result could have been predicted because a new partner (meaning a new equity owner) is linked to new funding for the company (in order to finance the company growth) without threatening existing partners with an excessive capital dilution.
Another expected result is the difference in number of partners between Low Tech startups and High Tech startups: on average, the first ones will have 2,7 partners while the second ones will have 2,8 partners. In a High Tech startup, the cost of R&D (to develop the marketed product) is quite higher. Hence, High Tech startups need both additional financial and human resources compared to Low Tech startups. This can explain the difference we observe. Moreover, “tech skills” are scarcest (as for example a cloud computing architect or UX/product experience specialist) and thus more expensive.
!"#
$%#
!&# !$# !&#
'# '# $(#
(# )# (# %# *# (#
$# +,--#
./01#0# 2,03#