www.biogeosciences.net/14/257/2017/ doi:10.5194/bg-14-257-2017
© Author(s) 2017. CC Attribution 3.0 License.
Species-specific temporal variation in photosynthesis as a moderator
of peatland carbon sequestration
Aino Korrensalo1, Pavel Alekseychik2, Tomáš Hájek3, Janne Rinne4, Timo Vesala2,5, Lauri Mehtätalo6, Ivan Mammarella2, and Eeva-Stiina Tuittila1
1School of Forest Sciences, University of Eastern Finland, Joensuu, Finland 2Dept. of Physics, University of Helsinki, Helsinki, Finland
3Faculty of Science, University of South Bohemia, ˇCeské Budˇejovice, Czech Republic 4Dept. of Physical Geography and Ecosystem Science, Lund University, Lund, Sweden 5Dept. of Forest Sciences, University of Helsinki, Helsinki, Finland
6School of Computing, University of Eastern Finland, Joensuu, Finland Correspondence to:Aino Korrensalo ([email protected])
Received: 20 June 2016 – Published in Biogeosciences Discuss.: 13 July 2016
Revised: 9 December 2016 – Accepted: 19 December 2016 – Published: 18 January 2017
Abstract. In boreal bogs plant species are low in number, but they differ greatly in their growth forms and photosyn-thetic properties. We assessed how ecosystem carbon (C) sink dynamics were affected by seasonal variations in the photosynthetic rate and leaf area of different species. Pho-tosynthetic properties (light response parameters), leaf area development and areal cover (abundance) of the species were used to quantify species-specific net and gross photosynthe-sis rates (PN andPG, respectively), which were summed to express ecosystem-levelPNandPG. The ecosystem-levelPG was compared with a gross primary production (GPP) esti-mate derived from eddy covariance (EC) measurements.
Species areal cover, rather than differences in photosyn-thetic properties, determined the species with the highest
PG of both vascular plants and Sphagna. Species-specific contributions to the ecosystem PG varied over the growing season, which, in turn, determined the seasonal variation in ecosystem PG. The upscaled growing seasonPG estimate, 230 g C m−2, agreed well with the GPP estimated by the EC (243 g C m−2).
Sphagna were superior to vascular plants in ecosystem-levelPGthroughout the growing season but had a lowerPN.
PNresults indicated that areal cover of the species, together with their differences in photosynthetic parameters, shape the ecosystem-level C balance. Species with low areal cover but high photosynthetic efficiency appear to be potentially im-portant for the ecosystem C sink. Results imply that
func-tional diversity, i.e., the presence of plant groups with dif-ferent seasonal timing and efficiency of photosynthesis, may increase the stability of C sinks of boreal bogs.
1 Introduction
Boreal bogs are ecosystems with low species diversity but a high diversity of growth forms due to the large microtopo-graphical variation and associated diversity of habitats along the water table gradient (Turetsky et al., 2012; Rydin and Jeglum, 2013). Several studies (e.g., Weltzin et al., 2000; Moore et al., 2002; Leppälä et al., 2008) have reported that patterned bogs produce more biomass and have less varia-tion in gross photosynthesis over the growing season than fens, which receive additional nutrients from the surrounding mineral soil and generally have more homogenous, sedge-dominated vegetation (Weltzin et al., 2000). Experimental studies have shown that bog plant growth forms have dif-ferential responses to warming and water table level manip-ulation, which can help to maintain the level of total ecosys-tem productivity under changing environmental conditions (Weltzin et al., 2000; Breeuwer et al., 2009). Short-term plant removal experiments have shown the differential roles of plant functional types for the peatland NEE and GPP (Ward et al., 2009; Kuiper et al., 2014). Photosynthetic properties of bog plants are known to differ widely between species of the same functional type (Small, 1972) and between phases of growing season (Korrensalo et al., 2016a). So far, the role of species-level differences in temporal variation of bog ecosys-tem photosynthesis has not been studied.
Here, we aim to solve the linkage between the tempo-ral pattern of bog carbon balance and the development of species-specific potential photosynthesis and leaf area. For this purpose, we quantified the contribution of different plant species to ecosystem-level photosynthesis over a growing season. As species differ in their photosynthetic properties, and the properties vary over the growing season, we expect their importance for the ecosystem carbon sequestration to also vary over the season. To reach our aim we estimate
PN andPG for the whole study site based on the monthly level light response of photosynthesis and species-specific leaf area development over a growing season. To validate the upscaling approach, the sum of species-levelPG is compared to the GPP derived from eddy covariance (EC) measurements at the study site.
2 Methods 2.1 Study site
The study site (61◦50.179′N, 24◦10.145′E) is situated in an
ombrotrophic bog, which is a part of the Siikaneva peatland complex in southern Finland, located in the southern bo-real vegetation zone. The annual temperature sum in the area (base temperature 5◦C) is 1318 degree days, annual rainfall
is 707 mm and the average annual, January and July tem-peratures are 4.2, −7.2 and 17.1◦C, respectively (30-year
averages (years 1982–2011) from the Juupajoki-Hyytiälä weather station). The study site has a surface topography typ-ical of raised bogs that varies from open water pools and mud
surfaces to hollows, lawns and hummocks. An EC flux tower is mounted on a raft in the center of the site.
The vegetation is mainly composed of 11 vascular plant and 8Sphagnumspecies (Table 1), the abundance of which varies markedly along the microtopographical gradient. A continuousSphagnumcarpet covers the surfaces from hum-mocks to hollows, although noSphagnaare present on the mud and water surfaces.Sphagnum cuspidatumandS. ma-jusare dominant in hollows,S. papillosum, S. rubellum, S. balticum andS. magellanicum in lawns, and S. fuscum, S. rubellumandS. angustifoliumcover the hummocks. Vascu-lar plant species composition includesRhynchospora alba, Scheuchzeria palustrisandCarex limosavegetation on mud and hollow surfaces, dwarf shrubs (Andromeda polifolia, Vaccinium oxycoccos) andEriophorum vaginatumon lawn surfaces, and a shrub layer ofCalluna vulgaris,Betula nana, Empetrum nigrum, and sedgesEriophorum vaginatum and Trichophorum cespitosumon hummocks.
2.2 Plant level photosynthesis measurements
To quantify the role of plant species in ecosystem-level tosynthesis over the growing season, we conducted net pho-tosynthesis (PN) measurements of the 19 most common species at the study site. Over the growing season 2013, we measured CO2 exchange of three to five samples of each species per month at three light levels with two open, flow-through gas exchange measurement devices (GFS-3000, Walz, Germany, and LI-6400, LI-COR, USA). Samples were collected from several locations inside the study area a max-imum of 30 h prior to measurement;Sphagnawere collected in small plastic bags and vascular plants in plastic boxes with an ample amount of roots and peat. These were kept moist until measured. Vascular plants were kept in shaded conditions andSphagnawere stored in the dark at 5◦C. The
moss cuvettes were filled withSphagnumcapitula imitating the natural shoot density of each species in the field, result-ing in a total number of 6–16 capitula inside a cuvette de-pending on the species. Before placing the capitula into the cuvettes, they were first wetted and then lightly dried of ex-cess water with pulp paper. The cuvette was then placed un-der a photosynthetic photon flux density (PPFD) of approx-imately 1000 µmol m−2s−1to acclimate to light for 20 min. The measured light levels were 2000, 25 and 0 µmol m−2s−1 for vascular plants and 2000, 35 and 0 µmol m−2s−1 for Sphagna. Light levels were designed to catch both the lin-ear, light-limited beginning and the light-saturated maximum of the light response curve without causing photoinhibitory reduction of photosynthetic rate (Laine et al., 2015). Vas-cular plants were measured with a standard cuvette, but for Sphagna we used a moss cuvette of our own construction with internal dimensions of 3×2×1 cm (Hájek et al., 2009)
be-Table 1.Average projection cover of the most common plant species at the study site, maximum leaf area index (LAI) values, and cumulative seasonal gross and net photosynthesis (PG,PN)of the species measured in this study. The cover values are based on a vegetation inventory conducted in 2013 at the study site within the 30 m radius footprint of the eddy covariance tower (N=121). LAI values of vascular plants are seasonal maxima of each species calculated by converting the cover values into LAI using species-wise linear relationships (Supplement Table S2).SphagnumLAI is assumed to stay similar over the growing season and is simply the coverage expressed as LAI.Sphagnumand vascular species nomenclature according to Laine et al. (2009) and Hämet-Ahti (1998), respectively.
Species Cover mean LAI SeasonalPG SeasonalPN
±SE (%) (m2m−2) (g C m−2) (g C m−2) Vascular total 24.2±1.9 0.29 92.2 57.3
Rhynchospora alba 6.9±0.8 0.10 23.3 15.1
Andromeda polifolia 3.7±0.4 0.03 14.4 8.4
Calluna vulgaris 2.8±0.9 0.04 13.8 9.1
Rubus chamaemorus 2.5±0.6 0.03 6.9 4.5
Eriophorum vaginatum 1.5±0.3 0.02 6.0 3.8
Vaccinium oxycoccos 1.2±0.2 0.01 5.3 3.2
Drosera rotundifolia 1.1±0.1
Empetrum nigrum 1.0±0.5 0.01 2.3 1.2
Trichophorum cespitosum 1.0±0.5 0.02 11.5 6.7
Drosera longifolia 0.8±0.4
Scheuchzeria palustris 0.8±0.1 0.02 5.1 3.0
Betula nana 0.4±0.2 0.004 1.1 0.5
Carex limosa 0.4±0.1 0.005 2.4 1.8
Sphagnumtotal 63.8±3.7 0.65 137.8 19.9
Sphagnum rubellum 18.3±2.6 0.18 30.7 0.8
S. papillosum 12.9±2.3 0.13 33.9 6.8
S. fuscum 11.0±2.3 0.11 27.1 7.4
S. balticum 8.3±1.5 0.08 15.7 −0.5
S. cuspidatum 4.8±1.3 0.05 13.4 1.7
S. majus 4.7±1.2 0.05 12.7 2.8
S. angustifolium 1.3±0.5 0.01 3.6 0.6
S. lindbergii 0.8±0.8
S. magellanicum 0.3±0.1 0.003 0.7 0.1
Other mosses and lichens
Pleurozium schreberi 0.8±0.5
Mylia anomala 0.2±0.1
Cladina rangiferina 0.4±0.2
fore recording the CO2 exchange. Only PPFD was varied during the measurements, while we kept air temperature at constant 20◦C, the flow rate at 600 µmol s−1 and the CO
2 concentration in the incoming air at 400 ppm to be able to compare the seasonal changes in photosynthetic potential among species. The relative humidity inside the cuvette was kept at 50 % for the vascular plants and below 90 % for the Sphagna. The measuredPNvalue of each sample at the three light levels was expressed per photosynthesizing leaf area (mg CO2m−2(LA) h−1), which was the leaf area inside the cuvette measured with a scanner for vascular plants and as-sumed to be the cuvette area forSphagna. Two of the species, namelyRhynchospora alba andRubus chamaemorus, were not yet of measurable size in May;R. albahad already mostly senesced in September, and therefore the two species were
not measured in those months. Altogether, the data consisted of 720 measurements.
2.3 Net photosynthesis model
To obtain a species-wise flux reconstruction ofPN andPG,
PNsi=Rs+
PmaxsPPFDsi
ks+PPFDsi +esi, (1)
where PNsi is the observed net CO2 exchange (mg CO2m−2(LA) h−1) and PPFDsi is the photosyn-thetic photon flux density for measurement i of samples.
The three parameters to be estimated are the maximum rate of light-saturated net photosynthesis (Pmaxs), the PPFD level where half of Pmax was reached (ks)and respiration (Rs), and they were assumed to be constant for each combination of species and month.esiis the normally distributed residual variance of the model with a mean of zero. The normally distributed random effect of the sample was included in one to three of the parameters depending on the model. The random effect structure was selected based on the Akaike information criterion (AIC) values of the alternative models with random effects included in a different combination of parameters. The random effects for the sub-models of each nonlinear model form a vector of random effect with non-zero correlation. Parameter values for the 87PNmodels are presented in the Supplement (Table S1). The separate fitting for each combination of species and months leads to models with similar asymptotic unbiasedness as a single model for complete data would do. However, separate models do not quantify the temporal and between-species correlation of random effects and residuals and therefore do not provide a sufficiently detailed model for evaluating the prediction errors of upscaled estimates of net photosynthesis. A proper model for such a purpose would model both temporal and between-species covariance of both random effects and residuals, but model fitting procedures for such models are not available in the standard statistical software. All models were fitted using the function nlme of the R program package nlme (Pinheiro and Bates, 2000).
Sphagna were not measured in June nor were vascular plants measured in July due to technical failures of the de-vices. Therefore, light response curves for these 2 months were fitted by combining data from the previous and follow-ing month for each species. In 5 of the 95 species–month combinations only one sample of the species had an accept-able measurement. The parameters for these months were estimated separately without the mixed model structure (Ta-ble S1).
2.4 Upscaling
To upscale species-level photosynthesis to the ecosystem level, the cover of each species was estimated within the study site with a systematic vegetation inventory conducted in July 2013. We estimated the relative cover of each plant species in 121 plots of 0.071 m2 (Table 1), which were ar-ranged in a regular grid in a 30 m radius circle around the EC tower. To link net photosynthesis measured per leaf area to species cover, we converted species cover in the study area
to leaf area index (LAI) using linear relationships between the two (Table S2). Relationships were based on an inventory made in July 2012 over a 200 m radius circle where species cover was estimated, and then all living aboveground vege-tation was harvested from 65 inventory plots of 0.071 m2for LAI measurements. The vascular plant LAI of these samples was measured in the laboratory.
We monitored LAI development of each vascular plant species over the growing season in 18 permanent sampling plots (0.36 m2)that represented all the vegetation communi-ties (n=3 in each vegetation community) along the
microto-pographical gradient at the study site. LAI was estimated ev-ery third week according to the method described by Wilson et al. (2007). Continuous LAI development of each species was then estimated by fitting a log-linear response to the ob-servations. The shape of the log-linear LAI development was taken from this fitting, and the growing season LAI maxi-mum for each species was taken from the converted aver-age cover (Table 1).Sphagnumleaf area was assumed to stay constant over the whole growing season and was obtained using the average cover from the 2013 inventory.
Using the light response curves, estimated daily LAI, and half-hourly, above-canopy PPFD data from SMEAR II measurement station (61◦50.845′N, 24◦17.686′E),
we calculated PN and PG for each half hour period (mg CO2m−230 min−1) over the growing season (Julian days 121–273) with the species-wise and monthly light response curves. PG was calculated with the same model without the R parameter, i.e., assuming that respiration is
zero. Model predictions were not meaningfully changed by using marginal prediction, i.e., averaging the predictions over the distribution random effects (e.g., de Miguel et al., 2012) and were therefore computed using the fixed part of the model only. Growing seasonPN andPG of the whole study site were calculated as a sum of their daily values. 2.5 Ecosystem-level CO2exchange measurements and
estimation of gross primary production
0.1 m s−1 were rejected. The resulting EC fluxes represent the exchange over a quasi-elliptical source area (footprint) located within about 30 m upwind of the EC mast, as sug-gested by footprint calculations using the model by Kormann and Meixner (2001).
NEE measured by the EC method was then partitioned into ecosystem GPP andReco. The daytimeRecoestimates were obtained from theQ10-type temperature response curve fit-ted to the nighttime EC data, when respiration is the only component of NEE. Nighttime was defined as all the periods when the sun elevation angle was lower than 5◦. Peat
tem-perature at 5 cm depth was used as the driver ofReco, in the following relationship:
Reco=RrefQ
Tp−Tref
10
10 , (2)
whereTp is the peat temperature at a 5 cm depth (◦C) and
Trefis the peat reference temperature of 12◦C. Parameters to be estimated from the fit of the model (Eq. 2) to all available nighttime NEE data wereRref, the reference respiration at the temperature of 12◦C, and Q10, the temperature sensitivity
coefficient.
The GPP estimates were calculated by subtracting the modeled Reco from the EC-derived NEE values. Finally, in order to gap-fill the GPP time series, a model using PPFD (from the SMEAR II measurement station) and the footprint-scale LAI was fitted to the data following
GPP= PmaxPPFD
k+PPFD (LAI+b) , (3)
where GPP is expressed in milligrams (CO2)per square me-ter per hour. LAI is the modeled daily vascular leaf area index described above, whilebrepresents the temporally constant
contribution of theSphagnumto total LAI.
One of the major sources of random uncertainty in cumu-lative GPP originates from the uncertainty in the Reco and GPP model parameters. Random uncertainty was calculated as the 95 % confidence interval of a set of 1000 cumulative GPP estimates obtained usingRref,Q10,Pmaxandkvaried within their respective 95 % confidence intervals. Since lab-oratory measurements of PG were conducted at a constant temperature of 20◦C and EC measurements at the air
tem-peratures present at the field site, the temperature limitation of GPP was studied by fitting to the GPP data a model similar to Eq. (3), but complemented with a Gaussian-type tempera-ture response (Maanavilja et al., 2011):
GPP= PmaxPPFD
k+PPFD (LAI+b)exp
−0.5(Ta−Topt)2 Ttol2
!
, (4)
whereTa is the air temperature,Topt is the temperature op-timum of GPP andTtol is the temperature tolerance of GPP
(deviation from the optimum at which GPP is 60 % of the maximum). Using Eq. (4), GPP at 20◦C and at ambient PAR
and LAI was simulated for the study site over the growing season.
3 Results
3.1 Cumulative growing season gross photosynthesis Fitting the temperature response curve ofReco, Eq. (2), into the nighttime eddy covariance data yielded a reference respi-ration (Rref)of 123 mg (CO2)m−2h−1andQ10of 3.5. In the GPP model (Eq. 3) fit,Pmax was 1721.8 mg CO2m−2h−1,
kwas 128.3 µmol m−2s−1andbwas 0.08. After gap-filling
the GPP data (Eq. 3), the resulting cumulative growing sea-son GPP estimate was 243 g C m−2 (95 % confidence inter-val; 220–265 g C m−2). In the GPP model fit complemented
with the temperature response (Eq. 4), Pmax was 1852 mg (CO2)m−2h−1,kwas 170.3 µmol m−2s−1,bwas 0.1, T
opt was 22.6◦C andT
tolwas 20.9◦C.
Cumulative growing seasonPG upscaled to the ecosys-tem level using the separate light response curves for species and months (Eq. 1) was 230 g C m−2(Julian days 121–273). DailyPG estimates were higher than GPP values from the EC tower in spring and lower in the middle of the summer (Fig. 1a). The GPP simulated at 20◦C, the same
tempera-ture as during the laboratory measurements, was similar to the upscaledPGin spring but closer to the measured GPP in the middle of the summer (Fig. 1a). In the autumn, all of the three estimates showed fairly similar levels (Fig. 1a).
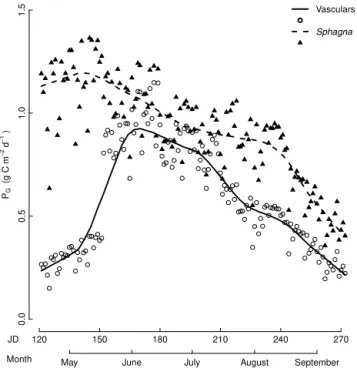
Sphagnaat the study site had a higher cumulative grow-ing season PG value (138 g C m−2) than vascular plants (92 g C m−2). Sphagna had higher daily P
G than vascular plants in spring and autumn but were almost at the same level in the middle of the summer (Fig. 2). A small increase in Sphagnumphotosynthesis was observed during May (Figs. 2 and 3b) due to increments of daily PPFD towards midsum-mer. Otherwise,Sphagnum PG decreased steadily over the growing season (Fig. 2). Seasonal changes in vascular PG showed similar patterns to vascular LAI development, al-though the maximumPGwas reached slightly earlier in the season than maximum LAI (Figs. 1a, c and 2).
120 150 180 210 240 270
0.5
1.0
1.5
2.0
2.5
3.0
3.5
PG
/GPP (g C
m
−
2 d
−
1 )
PG
GPP in ambient T
GPP in 20°C
(a)
May June July August September
JD Month
120 150 180 210 240 270
0
5
10
15
20
25
30
Air T (
°
C)
(b)
May Jun Jul Aug Sep
JD Month
120 150 180 210 240 270
0.00
0.10
0.20
0.30
LAI (
m
2 m
−
2 )
(c)
May Jun Jul Aug Sep
120 150 180 210 240 270
−20
−15
−10
−5
WT (cm)
(d)
May Jun Jul Aug Sep
Figure 1. (a)Comparison of total daily ecosystem-level gross photosynthesis estimate of all plants (PG)derived from laboratory
measure-ments, with GPP estimates derived directly from the eddy covariance measurements and with GPP simulated at constant temperature of 20◦C. The temperature in laboratory photosynthesis measurements was kept constant at 20◦C during the whole growing season.(b)Daily
mean air temperature (in black) and daily temperature variation (in grey fill; Hyytiälä Forest Research Station 10 km from the study site, Finnish Meteorological Institute, 2016);(c)sum of modeled vascular leaf area during the growing season 2013 and(d)average daily lawn (i.e., intermediate) surface water table (WT) at the study site. Lines represent locally weighted scatterplot smoothing (Loess, smoothing parameter=0.25) curves.
the seasonal ecosystemPGand 67 % of thePGofSphagnum mosses (Fig. 4).
3.2 Cumulative growing season net photosynthesis
The aboveground vegetation of the study site was a car-bon sink of 77 g C m−2 over the growing season as esti-mated byPNvalues upscaled to the ecosystem level using the species- and month-wise light response curves.PNresults for Sphagnaand vascular plants were reversed in comparison to
PG estimates;PN ofSphagnawas 20 g C m−2and vascular
PNwas 57 g C m−2.
The same vascular plant species had the highest growing seasonPNandPG;R. alba,C. vulgarisandA. polifoliahad the highest PN estimates of 15.1, 9.1 and 8.4 g C m−2, re-spectively (Table 1). These three species made up 57 % of the total vascularPNand 42 % of the whole ecosystem-level
PN.
120 150 180 210 240 270
0.0
0.5
1.0
1.5
PG
(g C
m
−
2d
−
1)
Vasculars
Sphagna
May June July August September
JD
Month
Figure 2.Daily gross photosynthesis estimates (g C m−2d−1)of
vascular plants and Sphagnaupscaled to the ecosystem level us-ing the species-specific, monthly light response curves derived from laboratory measurements. Lines represent Loess averaging (smoothing parameter=0.25).
4 Discussion
4.1 Comparison of upscaled gross photosynthesis values with eddy covariance gross primary production estimates
Accounting for the differences in photosynthetic parameters between species and between phases of the growing sea-son appeared to accurately estimate ecosystemPGwhen up-scaling species-level measurements. Sphagnum mosses es-pecially showed a large seasonal variation in their photosyn-thetic light response, which could be accounted for in this upscaling approach. The similarity of thePG estimates cal-culated with species-wise and monthly light response curves and GPP estimates derived from EC measurements (Fig. 1a) adds credibility to the methods used and indicates that the photosynthetic parameters measured under laboratory condi-tions are comparable with field measurements. Both methods have their error sources. Annual CO2flux balances from EC measurements are prone to significant systematic bias, some-times in excess of 30 % but usually between 10 and 30 % of the cumulative flux (e.g., Baldocchi, 2003; Rannik et al., 2006). The underestimation of the EC fluxes implicit in the unclosed energy balance (70 % for Siikaneva-1, unpublished data) might be partly compensated for by the Kok effect, which might be more significant than previously thought, as indicated by Wehr et al. (2016). Our PG estimates include
errors related to the LAI development measurements, visual species cover estimation, the conversion from cover to LAI and the laboratory measurements of photosynthetic param-eters. Although the shading of the moss layer by vascular plants may figure as a potential error source ofPGupscaled with PPFD measured above the vegetation, it is not likely to be caused by the sparse cover of vascular plants at the site (Supplement Fig. S3) with low seasonal maximum LAI (Fig. 1c). By taking into account the variation between sam-ples in the 87PNmodels (Eq. 1), we aimed at a more accurate estimation of the light response parameters. Nevertheless, our ecosystem-level PG estimate may contain bias caused by not accounting for the random effects of the 87 models in the upscaling procedure. The cumulative growing season
PG of 230 g C m−2 is very similar to the 205 g C m−2 ob-tained by Alm et al. (1999) at an ombrotrophic bog site under similar climatic conditions and comparable water levels but where the exceptionally dry conditions during the measured season reduced the photosynthetic capacity of many Sphag-numspecies. Our growing seasonPGwas considerably lower than the 500 g C m−2 obtained by Moore et al. (2002) and Roulet et al. (2007) at a temperate ombrotrophic bog with much lower water table levels. While our value only covers the period from May until September, it falls just below the large range of annual GPP values (250 to 900 g C m−2) mea-sured with the EC method from seven northern peatland sites (Lund et al., 2010).
The shapes ofPGand GPP development differed over the growing season, especially at the beginning of the summer, which is largely due to the constant temperature of 20◦C in
our laboratory measurements (Fig. 1a). The constant temper-ature allowed us to investigate how the changes in species-specific photosynthetic parameters were affected by the sea-sonal changes in moisture conditions in the field. Since the measuring of species-specific temperature responses ofPG was unachievable due to the large number of species, we instead chose to model the temperature dependence of EC-derived GPP (Eq. 4, Fig. 1a). Our upscaledPG values were higher than GPP in May when vascular plants had a high ca-pacity to use low light levels (lowkvalue) andSphagnahad highPmax (Fig. 1a; Table S1), but this was the case when temperatures in the field remained mostly below 20◦C and
limited the measured GPP (Fig. 1b). The temperature limita-tion of measured GPP is demonstrated by the lower spring-time measured GPP in comparison with GPP simulated at 20◦C (Eq. 4, Fig. 1a). Both measured GPP and GPP
simu-lated at 20◦C show higher levels thanP
●●●● ● ●●● ●● ●●●●●●● ●●● ● ●● ● ●● ●●●●● ● ●● ● ● ●● ●● ●●●● ● ● ●● ●● ● ●●● ● ● ● ● ● ● ● ●● ●● ●● ● ● ● ● ●●● ● ● ● ● ● ● ● ● ● ● ● ●●● ● ● ● ● ● ● ●● ● ● ●●● ● ●● ● ● ● ● ● ● ● ●● ● ●●●●● ●● ●● ● ● ●●●●●● ● ● ●●●●● ● ● ● ●●●●● ●● ●●●●
120 150 180 210 240 270
0.0 0.1 0.2 0.3 0.4 0.5 PG (g C m − 2 d − 1 ) ● AndrPol CallVul RhynAlb
(a)
May June July August September
JD Month ● ● ● ● ● ● ● ● ● ● ● ● ● ● ●● ● ● ● ● ● ●● ● ●● ● ● ● ●● ● ●● ● ● ●● ● ● ● ● ●● ● ● ● ● ●● ● ●● ● ● ● ● ● ● ● ●●● ●● ● ● ● ● ● ● ●●● ● ● ● ● ●● ● ● ● ● ● ●●● ● ● ●● ● ● ●● ● ● ●●● ● ● ● ● ● ● ● ● ● ● ●● ● ●●●●● ●● ●● ● ● ● ●●●●● ● ● ●● ●● ● ● ● ● ● ● ● ● ● ● ● ●● ● ●
120 150 180 210 240 270
0.0 0.1 0.2 0.3 0.4 0.5 PG (g C m − 2 d − 1 ) ● SphaFus SphaPap SphaRub
(b)
May June July August September
JD
Month
Figure 3.Daily gross photosynthesis estimates (g C m−2d−1)of
the three most productive(a)vascular and(b) Sphagnumspecies upscaled to the ecosystem level using the species-specific, monthly light response curves derived from laboratory measurements. Lines represent Loess averaging (smoothing parameter=0.25). The
species cover within the study site (EC footprint) is given in Table 1. Abbreviations of the species’ names are AndrPol:Andromeda po-lifolia; CallVul:Calluna vulgaris; RhynAlb:Rhynchospora alba; SphaFusc: Sphagnum fuscum; SphaPapi: Sphagnum papillosum; SphaRube:Sphagnum rubellum.
temperatures (Fig. 1a). According to our results peatland photosynthesis is temperature limited, especially in spring; Sphagnahad a high photosynthetic potential due to favorable
moisture conditions at that time (Fig. 2), but the low field temperatures limited ecosystem-level GPP (Fig. 1a and b). Temperature limitation of springtime photosynthesis is well known for boreal forests (Tanja et al., 2003; Ensminger et al., 2004), as well as for bogSphagna(Moore et al., 2006). Mean annual temperature together with PPFD during the growing season are the most important factors explainingSphagnum productivity on the global scale (Gunnarsson, 2005; Loisel et al., 2012), and the temperature optimum of Sphagnum photosynthesis is known to change over the growing season (Gaberšˇcik and Martinˇciˇc, 1987). However, the temperature dependence and acclimatization of species-level photosyn-thesis in peatlands has been studied only with a few Sphag-numspecies (Gaberšˇcik and Martinˇciˇc, 1987; Robroek et al., 2007).
4.2 The contribution of plant species to ecosystem-level gross photosynthesis
Among bothSphagnaand vascular plants, the species with the highest seasonal upscaled PG (g C per m−2 of ground area) – and hence the most productive species on the ecosys-tem scale – were also the ones with the highest areal cover. No interspecies differences in photosynthetic properties, ei-ther within vascular plants or Sphagna, could change this order. On the ecosystem scale,Sphagna covering on aver-age 63 % of the ground area had higher upscaled dailyPG values for the whole summer than vascular plants covering only 24 % despite the lowerPmax values of Sphagna (Ta-ble S1). In ombrotrophic bogs,Sphagnaare known to be the first group to start photosynthesizing in early spring (Moore et al., 2006), which was also evident at our site (Fig. 2). The combination of lowPmaxvalues in July and September and high respiration rates in August and September (Table S2) re-sulted in an almost linear decrease in ecosystem-scale Sphag-numPGover the growing season (Fig. 2). The seasonally de-creasingSphagnumPG is likely to reflect the change in the moisture conditions. Water table depth, which, together with precipitation, is known to be the most important moderator of Sphagnum photosynthesis (Hayward and Clymo, 1983; Backéus, 1988; Lindholm, 1990; Nijp et al., 2014), decreased at the study site over the growing season (Fig. 1d).
PG
(g C
m
−
2m
o
n
th
−
1)
0
5
10
15
20
25
30
35 AndrPol
CallVul RhynAlb Others
(a)
PG
(g C
m
−
2m
o
n
th
−
1)
0
5
10
15
20
25
30
35 SphaRub
SphaFus SphaPap Others
(b)
May June July August September
Month
PG
(g C
m
−
2m
o
n
th
−
1)
0
10
20
30
40
50
60
Sphagna Vasculars
(c)
Figure 4.Species’ proportions of monthly ecosystem-scale gross
photosynthesis (PG)of(a)vascular plants,(b)Sphagnummosses and (c) the contribution of those two groups to total monthly ecosystem-scalePG. Ecosystem-levelPGwas calculated using the species-specific, monthly light response curves derived from labo-ratory measurements. For abbreviations of the species’ names, see Fig. 3.
(Fig. 4). Based on these observations, phenology and areal cover rather than differences in photosynthetic parameters among species seem to be the key factor in determining the species with the highestPGof a bog ecosystem.
4.3 Ecosystem-level net photosynthesis
The variation in photosynthetic properties changed the roles of the plant species into a seasonal ecosystem-level carbon sink. AlthoughSphagna had more than twice the cover of vascular plants, seasonal PN was much lower than vascu-lar plants (Table 1). The seasonalPN ofSphagnumspecies was not proportional to their areal cover; for example, the species with the highest cover,S. rubellum, had a small sea-sonalPN (Table 1). S. rubellum has earlier found to have lower light-saturated photosynthesis and higher respiration than most of the other Sphagnum species (Table S1, Kor-rensalo et al., 2016a). The differences in photosynthetic pa-rameters ofSphagnumspecies seem to become much more visible in ecosystem-levelPN than in that of vascular plant species, since the leaf area of Sphagna stays similar over the growing season. The vascular plants most important for the ecosystem-levelPN were the same as the species with the greatest cover. However,T. cespitosum, with only 1 % of areal cover, made up 12 % of the seasonal vascularPN.
Our results indicate that in addition to the areal cover of the species, differences in photosynthetic parameters be-tween species shape the ecosystem-level carbon sink of a bog. Species with low areal cover may be important for the ecosystem carbon sink because of their high photosynthetic efficiency. However, the PN results have to be interpreted with care, since they contain the R parameter estimated based on respiration measurements done at 20◦C, which is higher
than the field temperature for most of the growing season. This general overestimation of respiration may be the reason behind a slightly negative seasonalPN of S. balticum (Ta-ble 1).
4.4 The role of functional diversity for peatland carbon sink
dis-tinct phases of the growing season (Fig. 3a). In addition, Sphagnaand evergreen shrubs formed two stable baselines of ecosystemPG, which was further increased by the midsum-merPGpeak of the sedgeR. alba(Fig. 3a and b). Especially ecosystem-levelSphagnumPGwas modified by the seasonal decrease in photosynthetic potential (Table S1). This sug-gests that the growing season PG of our study site is not only more stable, but it is also larger than it would be with a more functionally homogenous assemblage of species. Sev-eral studies have suggested that the C sink function of bogs is more stable over the growing season than that of fens, which have more homogenous and sedge-dominated vegeta-tion (Bubier et al., 1998; Leppälä et al., 2008). Hence, our re-sults should be compared with the patterns of photosynthetic productivity of a peatland site with a more homogenous plant assemblage.
Based on small-scale experimental studies, bog species and growth forms are known to vary in terms of their con-tribution to ecosystem productivity and to differ in their responses to manipulations of environmental conditions (Weltzin et al., 2000; Ward et al., 2009; Kuiper et al., 2014). In this study, the laboratory measurements of species photo-synthetic parameters were for the first time upscaled to the ecosystem level over a whole growing season and verified by the comparison with EC measurements. Boreal bog species were found to differ in the timing of their maximumPGover a growing season (Fig. 3a and b). Diversity in species re-sponses to environmental factors is hypothesized to make a plant community more resilient towards changing condi-tions (Yachi and Loreau, 1999; Gunderson, 2000). In addi-tion to species diversity, plant community diversity within an ecosystem has been shown to increase ecosystem stabil-ity during a severe drought in grasslands (Frank and Mc-Naughton, 1991). In boreal bogs, Sphagnummosses create microtopographic variations that – according to model sim-ulations – increase resilience towards environmental pertur-bations both through the diversity of growth forms they sup-port and by variation in physical properties between micro-forms (Turetsky et al., 2012). To find out about the effect of bog spatial heterogeneity on ecosystem resilience, studies ex-tending over several growing seasons are needed. As demon-strated in an arctic sedge fen, the impact of extreme weather conditions on an ecosystem C sink may occur with a lag of one growing season (Zona et al., 2014). Our study provides tools to empirically study the role of species and community diversity on the ecosystem scale. The combination of labora-tory measurements of photosynthetic parameters, phenolog-ical monitoring and EC measurements opens up the possi-bility of long-term and experimental ecosystem-level studies on the effect of functional diversity on the peatland ecosys-tem carbon sink. The long-term measurements would permit the inclusion of a wider range of environmental conditions. In particular, the EC method would allow for a comparison of the effect of diversity at sites with different plant assem-blages.
5 Conclusions
The areal cover of the species determined the species with the highest gross photosynthesis, while phenology in leaf area and photosynthetic activity drove the variation in level gross photosynthesis. In spring, potential ecosystem-level gross photosynthesis was much higher than measured gross primary production, which appeared to be due to tem-perature limitation of photosynthesis. Ecosystem-level net photosynthesis was more of a combination of the differences in (i) photosynthetic parameters, which were important in Sphagna, (ii) phenology, which largely defined vascular pro-ductivity, and (iii) areal coverage, which acted in both vascu-lar plants andSphagna.
The different growth strategies of the plant species present at our study site appeared to increase the ecosystem-level photosynthesis and decrease its variation within a growing season. We are looking forward to the future studies finding out if the diversity of growth forms has the same stabilizing effect on the interannual variation of ecosystem-level photo-synthesis.
6 Data availability
The data associated with the paper are published in the PAN-GAEA repository under doi:10.1594/PANPAN-GAEA.862986 (Korrensalo et al., 2016b).
The Supplement related to this article is available online at doi:10.5194/bg-14-257-2017-supplement.
Competing interests. The authors declare that they have no conflict of interest.
Author contributions. Eeva-Stiina Tuittila formulated the idea for this paper. Aino Korrensalo, Tomáš Hájek and Eeva-Stiina Tuit-tila designed the measurements, which were done by Aino Korren-salo and Tomáš Hájek. Aino KorrenKorren-salo, Tomáš Hájek and Eeva-Stiina Tuittila were responsible for the primary photosynthesis data processing. Eddy covariance data collection and analysis was done by Pavel Alekseychik, Janne Rinne, Timo Vesala and Ivan Mam-marella. The mixed-effects models were developed by Lauri Mehtä-talo and Aino Korrensalo. Aino Korrensalo, Pavel Alekseychik and Eeva-Stiina Tuittila wrote the paper, on which all the other authors commented.
Finland (287039, 118780, 1284701, 1282842), ICOS (271878), ICOS-Finland (281255) and the Nordic Centre of Excellence – DEFROST. We would also like to thank the staff at Hyytiälä Forest Research Station and Salli Uljas, Janne Sormunen, María Gutier-rez, Laura Kettunen and Eva-Stina Kerner for their help with the measurements and Nicola Kokkonen for revising the English language of the paper.
Edited by: P. Stoy
Reviewed by: three anonymous referees
References
Alm, J., Schulman, L., Walden, J., Nykänen, H., Martikainen, P. J., and Silvola, J.: Carbon balance of a boreal bog during a year with an exceptionally dry summer, Ecology, 80, 161–174, doi:10.1890/0012-9658(1999)080[0161:CBOABB]2.0.CO;2, 1999.
Aubinet, M., Vesala, T., and Papale, D.: Eddy Covariance: A Practi-cal Guide to Measurement and Data Analysis, Springer, Nether-lands, 2012.
Backéus, I.: Weather variables as predictors ofSphagnumgrowth on a bog, Holarctic Ecol., 11, 146–150, 1988.
Baldocchi, D. D.: Assessing the eddy covariance technique for evaluating carbon dioxide exchange rates of ecosystems: past, present and future, Glob. Change Biol., 9, 479–492, 2003. Breeuwer, A., Robroek, B. J. M., Limpens, J., Heijmans, M. M. P.
D., Schouten, M. G. C., and Berendse, F.: Decreased summer water table depth affects peatland vegetation, Basic Appl. Ecol., 10, 330–339, doi:10.1016/j.baae.2008.05.005, 2009.
Bubier, J., Crill, P., Moore, T., Savage, K., and Varner, R.: Seasonal patterns and controls on net ecosystem CO2exchange in a bo-real peatland complex, Global Biogeochem. Cy., 12, 703–714, doi:10.1029/98GB02426, 1998.
Cadotte, M. W., Cardinale, B. J., and Oakley, T. H.: Evolutionary history and the effect of biodiversity on plant productivity, P. Natl. Acad. Sci. USA, 105, 17012–17017, 2008.
Cardinale, B. J., Matulich, K. L., Hooper, D. U., Byrnes, J. E., Duffy, E., Gamfeldt, L., Balvanera, P., O’Connor, M. I., and Gon-zalez, A.: The functional role of producer diversity in ecosys-tems, Am. J. Bot., 98, 572–592, doi:10.3732/ajb.1000364, 2011. Chapin, F. S., Matson, P. A., Vitousek, P. M., and Chapin, M. C.: Principles of terrestrial ecosystem ecology, 2nd Edn., Springer, New York, NY, 1991.
de Miguel, S., Mehtätalo, L., Shater, Z., Kraid, B., and Pukkala, T.: Evaluating marginal and conditional predictions of taper models in the absence of calibration data, Can. J. Forest Res., 42, 1383– 1394, doi:10.1139/x2012-090, 2012.
Ensminger, I., Sveshnikov, D., Campbell, D. A., Funk, C., Jans-son, S., Lloyd, J., Shibistova, O., and Ãquist, G.: Intermittent low temperatures constrain spring recovery of photosynthesis in boreal Scots pine forests, Glob. Change Biol., 10, 995–1008, doi:10.1111/j.1365-2486.2004.00781.x, 2004.
Frank, D. A. and McNaughton, S. J.: Stability Increases with Diversity in Plant Communities: Empirical Evidence from the 1988 Yellowstone Drought, Oikos, 62, 360–362, doi:10.2307/3545501, 1991.
Frolking, S. E., Bubier, J. L., Moore, T. R., Ball, T., Bellisario, L. M., Bhardwaj, A., Carroll, P., Crill, P. M., Lafleur, P. M., McCaughey, J. H., Roulet, N. T., Suyker, A. E., Verma, S. B., Waddington, J. M., and Whiting, G. J.: Relationship between ecosystem productivity and photosynthetically active radiation for northern peatlands, Global Biogeochem. Cy., 12, 115–126, doi:10.1029/97GB03367, 1998
Gaberšˇcik, A. and Martinˇciˇc, A.: Seasonal dynamics of net photo-synthesis and productivity of Sphagnum papillosum, Lindbergia, 105–110, 1987.
Gorham, E.: Northern Peatlands: Role in the Carbon Cycle and Probable Responses to Climatic Warming, Ecol. Appl., 1, 182, doi:10.2307/1941811, 1991.
Gunderson, L. H.: Ecological resilience–in theory and application, Annu. Rev. Ecol. Syst., 31, 425–439, 2000.
Gunnarsson, U.: Global patterns of Sphagnum productivity, J. Bryol., 27, 269–279, doi:10.1179/174328205X70029, 2005. Hájek, T., Tuittila, E.-S., Ilomets, M., and Laiho, R.: Light
re-sponses of mire mosses – a key to survival after water-level drawdown?, Oikos, 118, 240–250, doi:10.1111/j.1600-0706.2008.16528.x, 2009.
Hayward, P. M. and Clymo, R. S.: The growth ofSphagnum: ex-periments on, and simulation of, some effects of light flux and water-table depth, J. Ecol., 71, 845–863, 1983.
Hämet-Ahti, L., Suominen, J., Ulvinen, T., and Uotila, P. (Eds.): Retkeilykasvio (Field Flora of Finland), Edn. 4, Finnish Museum of Natural History, Helsinki, 1998.
Hector, A., Hautier, Y., Saner, P., Wacker, L., Bagchi, R., Joshi, J., Scherer-Lorenzen, M., Spehn, E. M., Bazeley-White, E., Weilen-mann, M., Caldeira, M. C., Dimitrakopoulos, J. A., Finn, J. A., Huss-Danell, K., Jumpponen, A., Mulder, C. P. H., Palmborg, C., Pereira, J. S., Siamantziouras, A. S. D., Terry, A. C., Troumbis, A. Y., Schmid, B., and Loreau, M.: General stabilizing effects of plant diversity on grassland productivity through population asynchrony and overyielding, Ecology, 91, 2213–2220, 2010. Hughes, A. R., Inouye, B. D., Johnson, M. T. J., Underwood, N.,
and Vellend, M.: Ecological consequences of genetic diversity: Ecological effects of genetic diversity, Ecol. Lett., 11, 609–623, doi:10.1111/j.1461-0248.2008.01179.x, 2008.
Kormann, R. and Meixner, F. X.: An analytical footprint model for non-neutral stratification, Bound.-Lay. Meteorol., 99, 207–224, 2001.
Korrensalo, A., Hájek, T., Vesala, T., Mehtätalo, L., and Tuittila, E.-S.: Variation in photosynthetic properties among bog plants, Botany, 94, 1127–1139, doi:10.1139/cjb-2016-0117, 2016a. Korrensalo, A., Hájek, T., Alekseychik, P., Rinne, J., Vesala, T.,
Mehtätalo, L., Mammarella, I., and Tuittila, E.-S.: Eddy co-variance and environmental data of boreal bogs plant species, doi:10.1594/PANGAEA.862986, 2016b.
Kuiper, J. J., Mooij, W. M., Bragazza, L., and Robroek, B. J.: Plant functional types define magnitude of drought response in peat-land CO2exchange, Ecology, 95, 123–131, 2014.
Laine, J.: The intricate beauty of “Sphagnum” mosses: a Finnish guide to identification, University of Helsinki Department of For-est Ecology, 2009.
Larcher, W.: Physiological Plant Ecology: Ecophysiology and Stress Physiology of Functional Groups, Springer, 2003. Leppälä, M., Kukko-Oja, K., Laine, J., and Tuittila, E.-S.: Seasonal
dynamics of CO2exchange during primary succession of boreal mires as controlled by phenology of plants, Ecoscience, 15, 460– 471, doi:10.2980/15-4-3142, 2008.
Lindholm, T.: Growth dynamics of the peat mossSphagnum fuscum on hummocks on a raised bog in southern Finland, Ann. Bot. Fenn., 27, 67–78, 1990.
Loisel, J., Gallego-Sala, A. V., and Yu, Z.: Global-scale pattern of peatlandSphagnumgrowth driven by photosynthetically active radiation and growing season length, Biogeosciences, 9, 2737– 2746, doi:10.5194/bg-9-2737-2012, 2012.
Lund, M., Lafleur, P. M., Roulet, N. T., Lindroth, A., Christensen, T. R., Aurela, M., Chojnicki, B. H., Flanagan, L. B., Humphreys, E. R., Laurila, T., Oechel, W. C., Olejnik, J., Rinne, J., Schubert, P., and Nilsson, M. B.: Variability in exchange of CO2across 12 northern peatland and tundra sites: exchange of CO2in wet-lands, Glob. Change Biol., 16, 2436–2448, doi:10.1111/j.1365-2486.2009.02104.x, 2009.
Lund, M., Christensen, T. R., Lindroth, A., and Schubert, P.: Effects of drought conditions on the carbon dioxide dynamics in a tem-perate peatland, Environ. Res. Lett., 7, 45704, doi:10.1088/1748-9326/7/4/045704, 2012.
Maanavilja, L., Riutta, T., Aurela, M., Pulkkinen, M., Laurila, T., and Tuittila, E.-S.: Spatial variation in CO2 exchange at a northern aapa mire, Biogeochemistry, 104, 325–345, doi:10.1007/s10533-010-9505-7, 2011.
Mammarella, I., Peltola, O., Nordbo, A., Järvi, L., and Rannik, Ü.: Quantifying the uncertainty of eddy covariance fluxes due to the use of different software packages and combinations of process-ing steps in two contrastprocess-ing ecosystems, Atmos. Meas. Tech., 9, 4915–4933, doi:10.5194/amt-9-4915-2016, 2016.
Moore, T. R., Bubier, J. L., Frolking, S. E., Lafleur, P. M., and Roulet, N. T.: Plant biomass and production and CO2 exchange in an ombrotrophic bog, J. Ecol., 90, 25–36, doi:10.1046/j.0022-0477.2001.00633.x, 2002.
Moore, T. R., Lafleur, P. M., Poon, D. M. I., Heumann, B. W., Seaquist, J. W., and Roulet, N. T.: Spring photosynthesis in a cool temperate bog, Glob. Change Biol., 12, 2323–2335, doi:10.1111/j.1365-2486.2006.01247.x, 2006.
Morin, X., Fahse, L., de Mazancourt, C., Scherer-Lorenzen, M., and Bugmann, H.: Temporal stability in forest productivity in-creases with tree diversity due to asynchrony in species dy-namics, edited by: Rejmanek, M., Ecol. Lett., 17, 1526–1535, doi:10.1111/ele.12357, 2014.
Nijp, J. J., Limpens, J., Metselaar, K., van der Zee, S. E. A. T. M., Berendse, F., and Robroek, B. J. M.: Can frequent pre-cipitation moderate the impact of drought on peatmoss car-bon uptake in northern peatlands?, New Phytol., 203, 70–80, doi:10.1111/nph.12792, 2014.
Pinheiro, J. and Bates, D.: Mixed-Effects Models in S and S-PLUS, Springer New York, 2000.
Rannik, Ü., Kolari, P., Vesala, T., and Hari, P.: Uncertain-ties in measurement and modelling of net ecosystem
ex-change of a forest, Agr. Forest Meteorol., 138, 244–257, doi:10.1016/j.agrformet.2006.05.007, 2006.
Robroek, B. J. M., Limpens, J., Breeuwer, A., and Schouten, M. G. C.: Effects of water level and temperature on perfor-mance of four Sphagnum mosses, Plant Ecol., 190, 97–107, doi:10.1007/s11258-006-9193-5, 2007.
Roulet, N. T., Lafleur, P. M., Richard, P. J. H., Moore, T. R., Humphreys, E. R., and Bubier, J.: Contemporary carbon bal-ance and late Holocene carbon accumulation in a northern peatland, Glob. Change Biol., 13, 397–411, doi:10.1111/j.1365-2486.2006.01292.x, 2007.
Rydin, H. and Jeglum, J. K.: The Biology of Peatlands, OUP Ox-ford, 2013.
Small, E.: Photosynthetic rates in relation to nitrogen recycling as an adaptation to nutrient deficiency in peat bog plants, Can. J. Bot., 50, 2227–2233, 1972.
Tanja, S., Berninger, F., Vesala, T., Markkanen, T., Hari, P., Mäkelä, A., Ilvesniemi, H., Hänninen, H., Nikinmaa, E., Huttula, T., Lau-rila, T., Aurela, M., Grelle, A., Lindroth, A., Arneth, A., Shibis-tova, O., and Lloyd, J.: Air temperature triggers the recovery of evergreeen boreal forest photosynthesis in spring, Glob. Change Biol., 9, 1410–1426, 2003.
Tilman, D., Knops, J., Wedin, D., Reich, P., Ritchie, M., and Siemann, E.: The Influence of Functional Diversity and Composition on Ecosystem Processes, Science, 277, 1300, doi:10.1126/science.277.5330.1300, 1997.
Turetsky, M. R., Bond-Lamberty, B., Euskirchen, E., Talbot, J., Frolking, S., McGuire, A. D., and Tuittila, E.-S.: The resilience and functional role of moss in boreal and arctic ecosystems: Tansley review, New Phytol., 196, 49–67, doi:10.1111/j.1469-8137.2012.04254.x, 2012.
Waddington, J. M. and Roulet, N. T.: Carbon balance of a boreal patterned peatland, Glob. Change Biol., 6, 87–97, doi:10.1046/j.1365-2486.2000.00283.x, 2000.
Ward, S. E., Bardgett, R. D., McNamara, N. P., and Ostle, N. J.: Plant functional group identity influences short-term peat-land ecosystem carbon flux: evidence from a plant removal experiment, Funct. Ecol., 23, 454–462, doi:10.1111/j.1365-2435.2008.01521.x, 2009.
Wehr, R., Munger, J. W., McManus, J. B., Nelson, D. D., Zahniser, M. S., Davidson, E. A., Wofsy, S. C., and Saleska, S. R.: Season-ality of temperate forest photosynthesis and daytime respiration, Nature, 534, 680–683, 2016.
Weltzin, J. F., Pastor, J., Harth, C., Bridgham, S. D., Up-degraff, K., and Chapin, C. T.: Response of bog and fen plant communities to warming and water-table ma-nipulations, Ecology, 81, 3464–3478, doi:10.1890/0012-9658(2000)081[3464:ROBAFP]2.0.CO;2, 2000.
Wilson, D., Alm, J., Riutta, T., Laine, J., Byrne, K. A., Far-rell, E. P., and Tuittila, E.-S.: A high resolution green area in-dex for modelling the seasonal dynamics of CO2 exchange in peatland vascular plant communities, Plant Ecol., 190, 37–51, doi:10.1007/s11258-006-9189-1, 2007.
Yachi, S. and Loreau, M.: Biodiversity and ecosystem productivity in a fluctuating environment: the insurance hypothesis, P. Natl. Acad. Sci. USA, 96, 1463–1468, 1999.