ABAH Bioflux, 2009, Volume 1, Issue 1.
http://www.abah.bioflux.com.ro
1
ABAH BIOFLUX
Animal Biology & Animal Husbandry
International Journal of the Bioflux Society
Genetic marker assisted selection in cattle: leptin
gene locus and its polymorphism
1
Teodora-Crina Carşai
1University of Agricultural Sciences and Veterinary Medicine Cluj-Napoca, Faculty of
Animal Sciences and Biotechnology, Cluj-Napoca, Romania, EU; Corresponding author: T.-C. Carşai, [email protected]
Abstract. We studied the polymorphism of types RFLP-Sau 3AI, RFLP-Mbo I and RFLP-Bsa AI at the leptin gene locus, in two improved genuine breeds: Bălţată Românească and Brună de Maramureş. The comparative use of different DNA separation, amplification and genotypization protocols allowed us to select the mostsuitable techniques for polymorphism studies, taking intoconsiderationthe accuracy of the obtained results, reproducibility, costs and equipments. The DNA obtained using automatic MagnaPure LC kit, was of a very good quality, and did not exhibit traces of degradation. It iwas free of RNA and protein contamination. The posibility of using refrigerated and old blood advantages the use of this method. We recommend the use of protocols described by Liefers et al (2002) and Lien et al (1997) for the study of polymorphism of the leptin gene and genotypization at this locus, as we demonstrated that they could produce better results, as compared to those obtained when the protocol of Pomp et al (1997)was used. In the studied Bălţată Românească and Brună de Maramureş populations, the allele A had a higher frequency at the leptin gene locus, as compared to allele B. Analyzing the frequencies of the genotypes in Bălţată Românească individuals, we noticed that the AA homozygous genotype represents 60%, AB heterozygous genotype 36% and BB homozygous genotype the smallest share, 4%, respectively of the total genotypes. Frequencies were similar for Brună de Maramureş, with the difference that BB genotype was absent.
Key Words: leptin gene, polymorphism, PCR, gene sequencing, cattle.
Introduction. The molecular genetics delivered to scientists a strong instrument for improving the animal populations – molecular markers. The research performed at DNA level is focused on the identification of genes responsible for phenogenesis of the quantitative phenomena and detection of the interest loci, as useful markers for the selection and improvement programmes.
The development of the genetic engineering as a science, made possible the
artificial handling of the genetic information of the living organisms, opening the way for
the emergence of modern biotechnology, with special impact on plants and animals improvement. Technologies using molecular markers gained increasing importance in livestock breeding and selection for economical interests.
The identification and elucidation of the structure of different genes using molecular biology techniques, led to the understanding of correlations between
genotypes and certain qualitative and quantitative production and reproduction
characteristics, and resistance against mites and diseases in many domestic animal
populations. Using specific molecular techniques, based on DNA analysis (PCR, RFLP, RAPD, AFLP, SNP, STR, ARMS, etc.) individuals with desired genotypes can be identified and selected in populations at the loci codifying the trait of interest. This may lead to a brief and rigorous selection within the livestock population.
Therefore, proteins secreted in milk (k-casein, β-lactoglobulin) or synthesized in
other tissues (Pit-1, leptin), became the subject of various research aiming the
ABAH Bioflux, 2009, Volume 1, Issue 1.
http://www.abah.bioflux.com.ro
2
The Importance of the Molecular Techniques. Milk, meat and other animal products quantity and quality, as well as the genetic potential of the animals, are conditioned by
the proportion of the favourable genes and their combination into the genotype. Today,
molecular genetics provides specific tools for a more precise estimation of the animal’s
genetic value, and for acceleration of genetic modifying in populations, to increase milk,
meat, and eggs productions and gain a betterresistance to diseases.
Several areas of the linkage maps are anonymous DNA polymorphisms (e.g.
RAPD, AFLP markers and microsatellites) and do not correspond to none of the genes with known function. However, some molecular markers (including cDNA, EST and proteic markers) are markers of individual genes. The DNA markers are emphasized using a large variety of techniques, function of fiability (repeatability and strongness), difficulty, costs and nature of the detecting polymorphism.
The molecular techniques may be based on hybridizing or restriction with restriction enzymes (RFLP) or on PCR (PCR, RAPD and AFLP) and can detect the
polymorphism of one locus or more loci, and markers may be inherited in adominant or
codominant manner.
The molecular genetic markers assisted selection (MAS) used for theestimation of
the production potential of livestock, delivers rapid supplementary information for selection and offspring testing. This would be integrated within traditional selection and improving programmes, in order to obtain maximum, rigorous and rapid advantages.
Marker assisted selection may be implemented in both sexes, for the sex limited
traits, or may be early implemented for reproduction traits. The efficiency of this type of selection gradually decreases due to recombination between the loci of interest, within
each generation. The decrease may be attenuated if the locus of interest is transmitted
linked to the neighbor loci.
The importance of using the genetic markers within improvement programmes is
revealed by the possibility of identifying major genes encoding for qualitative and
quantitative traits, or minor genes, tightly linked togroups of major genes affecting these
quantitative traits.
The literature cites the existence of certain genes associated to the dairy
production, as the growth hormone gene, the gene encoding prolactin, those encoding
caseins and lactoglobulins, andpituitary transcription factor (Pit 1).
The genes controlling quantitative traits for dairy and meat production are difficult to identify. The candidate loci are selected based on the associations established between
biochemical or physiological processes and the respective quantitative trait. These loci
are tested as loci of a quantitative trait (QTL). Among these, we can cite the following genes: thyroglobulin, calpastatin, bovine growing hormone (bGH), leptin and STAT 5A.
The Obesity Gene: Meat and Carcass Quality. The obesity gene (ob) and its product
– leptin (gr. leptos – slim) were discovered in 1998 (Friedman & Halaas 1998). Since
1953, Kennedy sustained a lipostatic theory, according to which the adipose tissues could
deliver a signal to the nervous system, thus limiting the animals’ appetite, which would
be concretized in their fattening only up to a precise limit and could explain the high precision of the mechanisms regulating the body composition.
The gene encodingleptin is located on chromosome 4in cattle (Pomp et al 1997).
The sequence of its encoding region has 96, 93, 88, 84 and 82% homology respectively
with sheep, pig, human, mouse and rat sequences. The adipose tissue expresses a transcript (mRNA) of 3.1 kb in cow (Ji et al 1998) and 4.1-4.5 kb in sheep. In poultry, the gene expression is also encountered at hepatic level, where it is involved in
lipogenesis (www.inra.fr/Internet/Produits/PA). The levels of mRNA for the ob gene are
proportional with the adipocyte size, increasing in parallel with the increase of the fat
deposits. The expression of the ob gene is regulated by insulin, glucocorticoids and
testosterone (Iritani 2000; Wauters et al 2000). Leptin is a proteic hormone of 167 amino acids (Zhang et al 1994) mainly synthesized by the adipose tissue and secreted into the
ABAH Bioflux, 2009, Volume 1, Issue 1.
http://www.abah.bioflux.com.ro
3
that leptin directly acts, besides hypothalamus, on some other tissues, as pancreas β
cells and T lymphocytes.
The Aim of the Research. The polymorphism identified in the nucleotide sequences of
exons of leptin gene, may be associated to the quantitative and qualitative properties of
meat, thus havingeconomical importance.
We studied the polymorphisms at the leptin gene locus in Bălţată Românească
and Brună de Maramureş cattle breeds, to select the genotypes predisposed to fattening
and consequently producing superior quality meat (from the point of view of freshness,
juicyness), and to identifiy the favorable alleles at this locus. The validation of the
methods used for polymorphisms identification and for genotypization, and their
implementation in routine animal breeding, may represent potential applications of the genetic markers in animal selection.
The prelevation of the biological samples and selection of the experimental groups were performed during 15.02.2005 - 30.11.2007.
The PCR tests were performed in the Laboratory of Animal Genetics of the University of Agricultural Sciences and Veterinary Medicine Cluj-Napoca, and in Progenus Laboratory SA Gembloux (Belgium).
The objectives of the study were as follows:
o The selection of the most suitable technique for polymorphism studies, taking into
consideration the accuracy of the obtained results, reproducibility, costs and
equipments available in laboratory.
o The study of the polymorphism at the leptin gene locus, in two improved genuine
breeds individuals: Bălţată Românească and Brună de Maramureş.
o To test DNA extraction methods for obtaining high quality DNA.
o Testing and improving the available protocols for gene polymorphism studies:
RFLP typingat the leptin gene locus.
o The study of the genic polymorphisms RFLP-Sau 3AI, RFLP-Mbo I and RFLP-Bsa AI
type.
o Sequencing the leptine gene, for the study of the polymorphism atrestriction sites
where the enzymatic digestion was not performed, and for detection of the possible mutations in some breeds, that could be responsible for some meat properties in
cattle. The restriction enzyme for RFLP was Sau 3A I.
o The elucidationof certainaspects connected to the genetic structure at the leptine
gene locus in Bălţată Românească and Brună de Maramureş cattle breeds, with the aim of developing some strategies for using the gene as a marker in molecular assisted selection.
Biological Material. Blood was prelevated from a total effective of 152 young cattle heads of both sexes, 88 Bălţată Românească and 64 Brună de Maramureş.
The blood samples were harvested from six farms from Transylvania, submitted to the official control of production and continuing to represent a valuable gene rezervoir.
These farms were: SC Agrozootehnica (Seini, Maramureş), SC Livada (Satu Mare), Agricultural Society Petreşti (Satu Mare), SCDP Jucu from the University of Agricultural Sciences and Veterinary Medicine Cluj-Napoca and two private farms from the counties of Cluj - Corujan farm (Floreşti), and SC Crişan farm (Gherla).
Blood was harvested in aseptic conditions from the jugular vein.
ABAH Bioflux, 2009, Volume 1, Issue 1.
http://www.abah.bioflux.com.ro
4
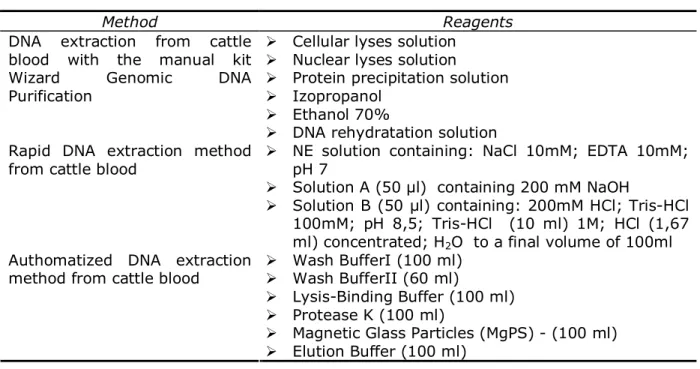
Table 1 Reagents and methods used for DNA extraction
Method Reagents
Cellular lyses solution
Nuclear lyses solution
Protein precipitation solution
Izopropanol
Ethanol 70%
DNA extraction from cattle blood with the manual kit
Wizard Genomic DNA
Purification
DNA rehydratation solution
NE solution containing: NaCl 10mM; EDTA 10mM;
pH 7
Solution A (50 µl) containing 200 mM NaOH
Rapid DNA extraction method from cattle blood
Solution B (50 µl) containing: 200mM HCl; Tris-HCl
100mM; pH 8,5; Tris-HCl (10 ml) 1M; HCl (1,67
ml) concentrated; H2O to a final volume of 100ml
Wash BufferI (100 ml)
Wash BufferII (60 ml)
Lysis-Binding Buffer (100 ml)
Protease K (100 ml)
Magnetic Glass Particles (MgPS) - (100 ml)
Authomatized DNA extraction method from cattle blood
Elution Buffer (100 ml)
Table 2 Reagents and methods used for studying leptin gene polymorphism
Method Reagents
PCR-RFLP and sequencing Sau3AI – 5U/μl
MboI – 10U/μl
BsaAI or Ppu21I- 10U/μl
Taq DNA Polymerase- 10U/μl
DNA Step Ladder 52 lanes
Sense and antisens primers
Buffer
MgCl2
dNTP
Sterile water
TAE 50X
TBE 5X
Ethidium bromide
Phenol
Chloroform
Absolute ethanol
Izopropanol
Seybr save
Agarose
To test the significance of the differences between the three DNA extraction methods, the “t” test was used as statistical processing and data interpretation method (WINSTAT v.6.0.).
ABAH Bioflux, 2009, Volume 1, Issue 1.
http://www.abah.bioflux.com.ro
5
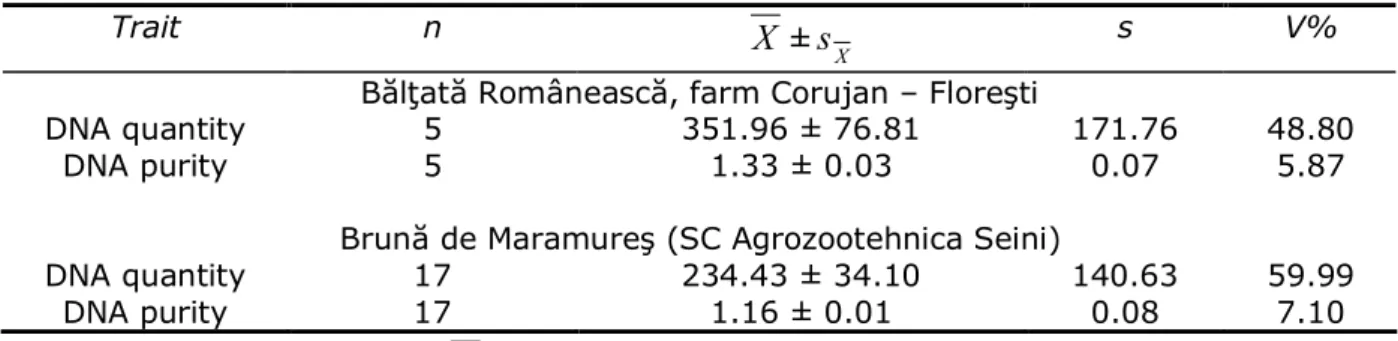
In Brună de Maramureş, from SC Agrozootehnica Seini farm, an average DNA quantity of 234.43 ng/µl ± 34.10 and an average purity of 1.16 ± 0.01 were obtained (Table 3).
Table 3
The averages and dispersion parameters for thequantities and purity of DNA extracted
from Bălţată Românească (farm Corujan, Floreşti) and Brună de Maramureş (SC Agrozootehnica, Seini) individuals
Trait n
X
±X
s
s V%Bălţată Românească, farm Corujan – Floreşti
DNA quantity 5 351.96 ± 76.81 171.76 48.80
DNA purity 5 1.33 ± 0.03 0.07 5.87
Brună de Maramureş (SC Agrozootehnica Seini)
DNA quantity 17 234.43 ± 34.10 140.63 59.99
DNA purity 17 1.16 ± 0.01 0.08 7.10
n = number of individual samples;
X
±s
X = mean value±standard error.The rapid DNA extraction method from cattle blood. In Bălţată Românească and Brună de Maramureş individuals from SA Petreşti, county of Satu-Mare, an average value of the DNA quantity of 209.79 ng/µl ± 13.65 ng and an average purity of 1.46 ± 0.02 were obtained.
For the quantities and purities of the DNA extracted from blood samples harvested from Bălţată Românească individuals, SCDP Jucu, county of Cluj an average value of the DNA concentration of 393.85 ng/µl ± 54.73 and an average purity of 1.34 ± 0.02 were obtained. The DNA extracted from the blood samples harvested from Bălţată Românească individuals, SC Crişan from Gherla, county of Cluj an average quantity of 185.72 ng/µl ± 28.79 ng and an average purity of 1.42 ± 0.04 were obtained (Table 4).
Table 4 The averages and dispersion parameters for quantities and purities of the DNA extracted
from Bălţată Românească and Brună de Maramureş (farm SA Petreşti, county of Satu Mare, SCDP Jucu, county of Cluj and SC Crişan Gherla, county of Cluj) individuals
Trait n
X
±X
s
s V%Bălţată Românească and Brună de Maramureş (SA Petreşti)
DNA quantity 60 209.79 ± 13.65 105.77 50.42
DNA purity 60 1.46 ± 0.02 0.15 10.25
Bălţată Românească (SCDP Jucu, county of Cluj)
DNA quantity 15 393.85 ± 54.73 211.96 53.82
DNA purity 15 1.34 ± 0.02 0.09 6.35
Bălţată Românească (SC Crişan Gherla)
DNA quantity 21 185.72 ± 28.79 131.93 71.04
DNA purity 21 1.42 ± 0.04 0.20 13.87
ABAH Bioflux, 2009, Volume 1, Issue 1.
http://www.abah.bioflux.com.ro
6
Table 5 The averages and dispersion parameters for quantities and purities of the DNA extracted
from Brună de Maramureş (SC Agrozootehnica Seini, county of Maramureş and SC Livada, county of Satu Mare)
Trait n
X
±X
s
s V%Brună de Maramureş (SC Agrozootehnica Seini, county of Maramureş)
DNA quantity 17 50.54 ± 15.16 62.53 23.73
DNA purity 17 1.77 ± 0.03 0.14 7.87
Brună de Maramureş (SC Livada, county of Satu-Mare)
DNA quantity 34 54.73 ± 9.09 53.00 16.85
DNA purity 34 1.76 ± 0.02 0.13 7.37
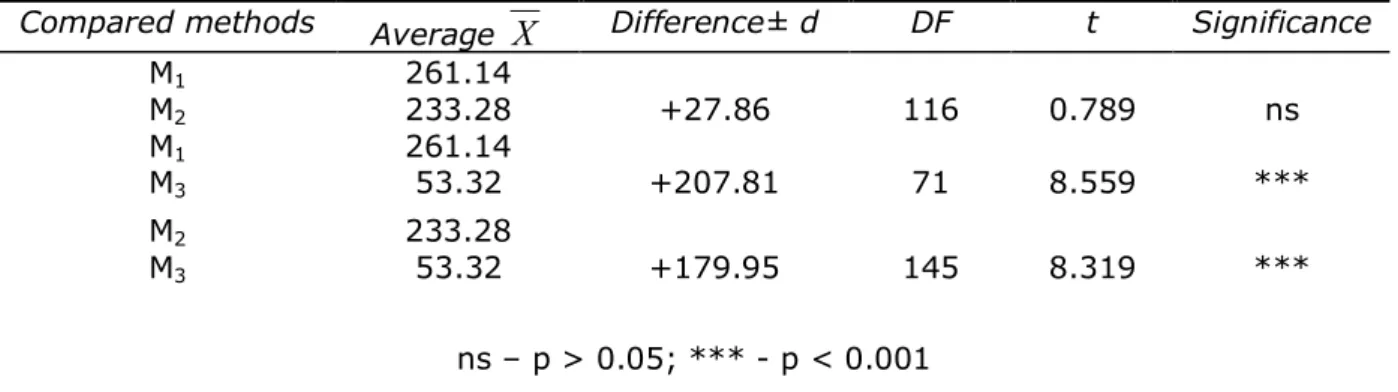
In both cases, the differences were positive, demonstrating that the DNA extraction
method with the manual Wizard Genomic DNA Purification kit, yields a bigger DNA quantity, as compared to the results obtained when automatic extraction method was used. Statistically not significant differences (+27.86 ng/μl; p > 0.05) were obtained (Table 6) between the results from DNA blood extraction with the Wizard Genomic DNA
Purification manual kit (M1) and DNA rapid method (M2).
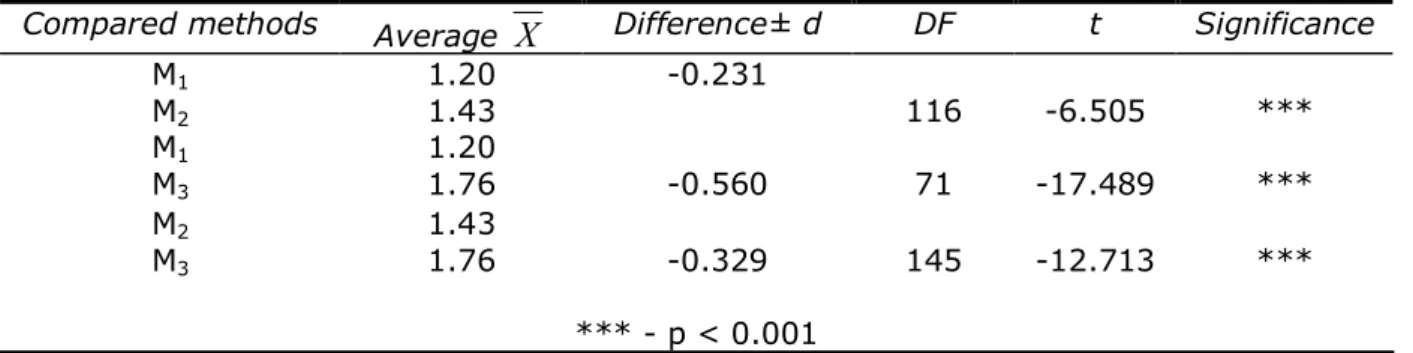
Statistically very significant differences (p < 0,001) were recorded between all average values of the DNA purities obtained with all three methods.
When the comparison was performed between the DNA purity obtained after
extraction with (M1), (M2) and (M3), all differences were in favor of the last two methods,
M2 and M3, respectively (Table 7).
Table 6 The significance of the differences between the average values of the DNA quantities
from cattle (ng/μl) extracted with three methods
Compared methods Average
X
Difference± d DF t SignificanceM1
M2
261.14
233.28 +27.86 116 0.789 ns
M1
M3
261.14
53.32 +207.81 71 8.559 ***
M2
M3
233.28
53.32 +179.95 145 8.319 ***
ns – p > 0.05; *** - p < 0.001
M1 – method of blood DNA extraction with manual Wizard Genomic DNA Purification kit,
M2 – Rapid method of DNA extraction from cattle blood,
M3 – Automatic method of DNA extraction from cattle blood with Magna Pure LC DNA Isolation kit.
If we consider the comparison between the average values of the DNA purities obtained
after DNA extraction with (M2) and (M3), the differences were in advantage of M3. This
demonstrates the technical superiority of the last method and allows us to recommend it
for genetic laboratory practices, where high purity DNA is needed for PCR techniques and
sequencing. This method is also suitable for our aim, due to the rapid DNA extraction
ABAH Bioflux, 2009, Volume 1, Issue 1.
http://www.abah.bioflux.com.ro
7
Table 7 The significance of the differences between the average values of the DNA purities from
cattle (λ = 260/280 nm) extracted with three methods
Compared methods Average
X
Difference± d DF t SignificanceM1
M2
1.20
1.43 -0.231 116 -6.505 ***
M1
M3
1.20
1.76 -0.560 71 -17.489 ***
M2
M3
1.43
1.76 -0.329 145 -12.713 ***
*** - p < 0.001
M1 – method of blood DNA extraction with manual Wizard Genomic DNA Purification kit,
M2 – Rapid method of DNA extraction from cattle blood,
M3 – Automatic method of DNA extraction from cattle blood with Magna Pure LC DNA Isolation kit.
Testing and optimization the PCR – RFLP protocol for studying the polymorphism at the leptine gene locus (Pomp et al 1997). In samples from Brună de Maramureş we obtained satisfactory results when amplification was performed. The desired amplification product
of 1820 bp was obtained in gradient PCR at a primer alignment temperature of 64o C; the
electrophoresis profile showed that the product was amplifiedin position 8, corresponding
to this temperature (Figure 1).
The same 1820 bp product was obtained when amplifying the genetic material from the strain Bălţată Românească (Figure 2).
The optimization of Magnesium concentration in the PCR reaction. The PCR reactions performed in temperature gradient showed that the primers amplification and alignment
was produced at 640C in the case of DNA samples from Bălţată Românească (Figures 2
and 3). The same results were obtained in DNA extracted from Brună de Maramureş breed (Figure 1).
Ladder 1 2 3 4 5 6 7 8 9 10 11
Figure 1. The electrophoretic profile of the 1820 bp PCR product obtained in Brună de Maramureş.
ABAH Bioflux, 2009, Volume 1, Issue 1.
http://www.abah.bioflux.com.ro
8
Ladder 1 2 3 4 5 6 7
Figure 2. The electrophoretic profile of the 1820 bp PCR product obtained in Bălţată Românească.
Both Figures 2 and 3 show the electrophoresis profile of the PCR product from Bălţată
Românească. The PCR reaction mix differs in that 1µl MgCl2 10 mM was supplementary
added in the last one. In position 7 the 1820 bp fragment can be observed (Figure 3).
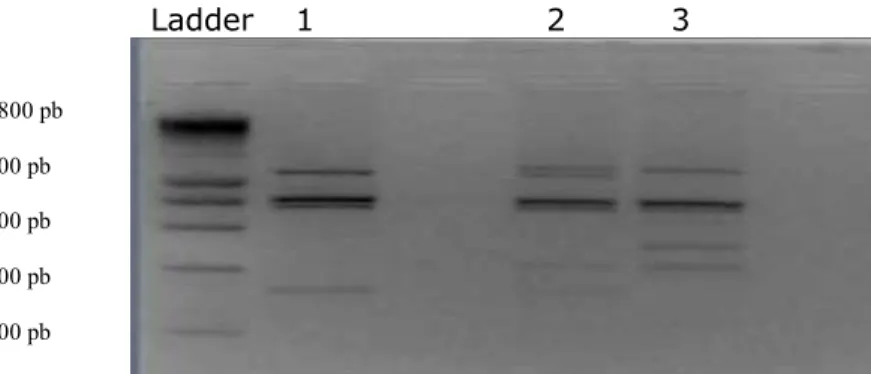
The digestion with the enzyme Sau3A I was performed in order to investigate the
polymorphism at the leptin gene locus. It was partial, fact demonstrated by the 730, 690 şi 400 bp fragments corresponding to individuals with AA homozygous genotype. The last bands are not well emphasized in gel. The fragments of 730, 690, 400, 310 and 90 bp, correspond to AB heterozygous individuals. In this case, too, the last bands are not very evident in the gel.
The presence of unspecific amplification products in positions 1 and 2 from Bălţată Românească was not observed in this case. Position 3 represents the DNA amplification product from Brună de Maramureş (Figure 4).
Detection of a pairing mistake within the sequence of the used primers.- The NCBI and
EMBL databases contain rich informative materials concerning genome mapping in different species. As a result of primer alignment and study of the entire sequence of the leptin gene, 4067 bp length (www.ncbi.nlm.nih.gov), we report an error within the protocol suggested by Pomp et al (1997) at the level of one nucleotide from the antisense primers, the presence of cytosine in place of timine, respectively.
Ladder 1 2 3 4 5 6 7
Figure 3. The electrophoretic profile of the PCR product in gradient obtained in presence
of the MgCl2 in Bălţată Românească.
ABAH Bioflux, 2009, Volume 1, Issue 1.
http://www.abah.bioflux.com.ro
9
Ladder 1 2 3
Figure 4. The electrophoretic profile of the PCR product digested with 1 µl Sau 3A I.
For the 1820 bp fragment, after enzymatic digestion the following fragments were obtained, according to Pomp et al (1997):
for individuals with AA genotypes, fragments of 730 bp, 690 bp and 400 bp
for AB genotype, fragments of 730 bp, 690 bp, 400 bp, 310 bp and 90 bp (the last
band not evident)
for BB genotype, fragments of 730 bp, 690 bp 310 bp and 90 bp (the last band not
evident).
The testing of this protocol led only to partial results. We assume this is due to the small molecular weight of the last bands, obtained only in Brună de Maramureş and Bălţată Românească individuals.
This protocol was also tested in breeds as Siemental, Angus, Gelbviech, Limousin,
Brahman, Holstein and Hereford. After testing by restriction with Sau3A I enzyme, a new
additional polymorphism was reported. The 690 bp fragment from the above mentioned
breeds was digested in two fragments (470 bp and 220 bp), according to Pomp et al
1997.
Testing and optimization of the protocol for studying the polymorphism at the leptin gene locus (Liefers et al 2002).- The second tested and improved protocol was proposed in 2002 by Liefers et al, who studied different polymorphisms from exons and introns at
leptin gene locus using the PCR-RFLP technique with the restriction enzyme Sau3A I.
Because the restriction enzyme Mbo I has the same restriction situs as Sau3A I,
used by Liefers and his co-workers, we tested the polymorphism from exon 2 and intron
2 of the leptin gene with both Mbo I and Sau3A I enzyme, in order to obtain a
satisfactory digestion of the PCR product.
The following electrophoresis profile was obtained after restriction with Sau3A I
enzyme (Figure 5).
Because neither this protocol gave satisfactory results due to the presence of other unspecific products, we improved it performing several PCR reactions with different restriction enzymes.
The results of the amplification when the PCR reaction was performed in temperature gradient, to determine the best primers alignment or alignment temperature, are illustrated in Figure 6. DNA samples from Brună de Maramureş
individuals were used. The alignment temperature was between 58.90C and 640C and
checks to the profiles in positions 6, 7, 8, 9, 10, 11. 1800 pb
800 pb
600 pb
400 pb
ABAH Bioflux, 2009, Volume 1, Issue 1.
http://www.abah.bioflux.com.ro
10
Ladder 1 2 3 4 5 6 7 8 9 10 11 12 13 400 bp
Ladder 14 15 16 17 18 19 20 21 22 23 24 25 26 Figure 5. The testing results of the initial protocole of Liefers et al 2002 (original)
Ladder 1 2 3 4 5 6 7 8 9 10 11
Figure 6. The electrophoretic profile of the PCR product in temperature gradient in Brună de Maramureş and Bălţată Românească individuals
Digestion with the Sau3A I and Mbo I enzymes of the 400 bp product and analysis of the resulted fragments.- The restriction realized to investigate the polymorphism was performed with DNA samples from Bălţată Românească and Brună de Maramureş individuals, in identical reaction conditions, and fragments of 300 bp and 400 bp, were obtained in AB heterozygous individuals. A single AA homozygous individual corresponding to the AA genotype was obtained (see Figure 7).
In Brună de Maramureş, homozygous individuals with AA genotype were found. They corresponded to the 400 bp fragment. The heterozygous AB individuals were associated to 300 bp and 400 bp fragments (Figure 8).
ABAH Bioflux, 2009, Volume 1, Issue 1.
http://www.abah.bioflux.com.ro
11
Ladder AB AB AB AA AB AB AB
Figure 7. Electrophoretic profile of the AB heterozygous (RFLP/Sau 3A I) in Bălţată
Românească individuals.
Ladder AA AA AB AB AB AB AA AA AB AB
Figure 8. Electrophoretic profile of the Sau3A I restricted fragments inBrună de
Maramureş individuals.
For DNA amplification, samples were prelevated from Brună de Maramureş individuals as previously described, followed by a normal PCR reaction, except aligning temperature,
that was fixed at 590C. Because in the amplification reaction carried in temperature
gradient, the optimal temperatures for the primers attachment were between 58.90C and
640C, we wanted to verify if at this temperature the 400 bp fragment can be obtained
without other unspecific amplification products (Figure 9).
Ladder AA AA AA AA AA AA
Figure 9. The electrophoretic profile of the unrestricted PCR product of 400 bp in Brună de Maramureş individuals.
400 pb 300 pb 250 pb 200 pb 150 pb 100 pb
400 pb 300 pb 250 pb 200 pb 150 pb 100 pb 400 pb
ABAH Bioflux, 2009, Volume 1, Issue 1.
http://www.abah.bioflux.com.ro
12
The restriction of the 400 bp fragment with Mbo I enzyme in Brună de Maramureş
individuals only led to AA homozygous genotypes (400 bp).
The electrophoretic profile (Carşai et al 2008) resulted after digestion with Mbo I
in the population of Bălţată Românească is shown in Figure 10.
AA AB BB AA AB AA AA AA Ladder AB AA AB AA AA AB AB
Figure 10. The electrophoretic profile of the Mbo I restricted fragments
inBălţată Românească.
The samples were migrated in 4% agarose gel, stained with 1µl ethidium bromide at 100 V.
For both breeds, the same reaction conditions were used and fragments corresponding to all three genotypes were obtained, as follows: Bălţată Românească individuals with BB homozygous genotype (corresponding to the fragments of 300 and 100 bp), from SA Petreşti farm, individuals with AA genotype (corresponding to the fragment of 400 bp) and also AB heterozygous individuals corresponding to the fragments of 400, 300 and 100 bp. These individuals were from: SC Agrozootehnica (Seini), SC Livada (Satu Mare), Agricol Society Petreşti (Satu Mare), SCDP Jucu of the University of Agricultural Sciences and Veterinary Medicine (Cluj-Napoca), and two private farms from the county of Cluj, Corujan farm (Floreşti) and SC Crişan farm (Gherla).
Testing and optimization of the PCR – RFLP protocol to study the polymorphism at the leptin gene locus (Lien et al 1997). The third tested and optimized protocole was suggested by Lien et al in 1997. The polymorphism located between intron 2 and exon
was investigated using PCR-RFLP and restriction enzyme Bsa A I, also called as Ppu 21I.
The alteration of the restriction site, of G–C type, in position 1620 was identified using this enzyme. For the testing of the protocol, we used DNA samples from both studied breeds: Balţată Românească and Brună de Maramureş (Figure 11).
Ladder 1 2 3 4 5 6 7 8 9 10 11 12 13 14 15 16 17 18 19
Figure 11. The electrophoretic profile of the amplified and restricted samples, according tothe method of Lien et al 1997 (original)
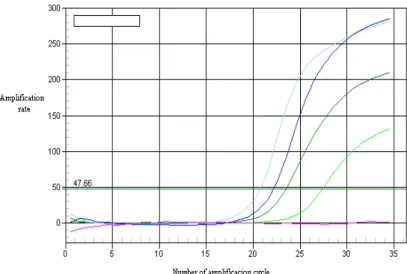
The amplification of the 522 bp fragment of leptin gene. We prepared the electrophoretic profile of the 522 bp unrestricted fragment of leptin gene, stained with 1µl ethidium
522 pb
ABAH Bioflux, 2009, Volume 1, Issue 1.
http://www.abah.bioflux.com.ro
13
bromide. Comparatively, parallel amplification was performed by Real-Time PCR, and an amplification graphic was obtained. The PCR reaction mix was: mastermix Sybrgreen Supermix, 2µl DNA and 2µl of each primer, sense and antisense, respectively. The amplification curves obtained within 35 cycles can be seen in Figure 12.
Figure 12. The amplification ratioand amplification cycles of the 522 pb fragment of the
leptin gene.
Investigating the RFLP/BsaAI type polymorphism of the leptin gene. The enzymatic
restriction to emphasizing the polymorphism at this locus using the Bsa AI enzyme was
also performed. The electrophoresis profile of the amplified and restricted samples from individuals belonging to both studied breeds is presented in Figure 13.
Ladder BB BB AA AB AB AB AB BB AB AA AB AB AA AB AB AB
Figure 13. The electrophoretic profileof the restricted fragments with Bsa AI enzyme,
migrated in 4% agarose gel in Bălţată Românească (1-15) and Brună de Maramureş (16-19)
After restriction with Bsa AI enzyme, fragments of 522, 441 and 81 bp resulted. They
correspond to the AB heterozygous individuals. Fragments of 441 and 81 bp for BB homozygous and 522 bp for AA homozygous, were also obtained (Carşai et al 2008).
The PCR amplification of the 400 bp fragments for sequencing. For amplification of the 400 bp of the leptin gene a sequence of sense and antisense primers was used. DNA was prelevated from Brună de Maramureş young cattle. Average DNA purity of 1.90 and 50 ng/µl average concentrations were obtained.
ABAH Bioflux, 2009, Volume 1, Issue 1.
http://www.abah.bioflux.com.ro
14
The purification of PCR product. In order to obtain good quality sequencing, the purification of the PCR product is needed. This is performed in several steps using purification columns (Microccon). The result of the purification is checked by quantification of purified DNA. The quantified DNA profile may be observed in position U 1 (Figure 14).
Figure 14. The electrophoretic profile of the purified and quantified PCR product in Brună de Maramureş.
Figure 15. The sequence of the 400 bp fragment of the leptin gene, showing the C–T mutation, in Brună de Maramureş.
The PCR reaction for sequencing. The sequencing reaction is based on in vitro
monocatenary DNA replication by PCR in presence of four deoxynucleotidetriphophates:
Std 1
ABAH Bioflux, 2009, Volume 1, Issue 1.
http://www.abah.bioflux.com.ro
15
dNTP (dATP, dGTP, dCTP and dTTP) and ¼ of dNTP analogues – or ddNTP (ddATP, ddGTP, ddCTP and ddTTP). The used DNA samples were prelevated from Brună de Maramureş individuals.
After data processing with the dedicated software of the sequencing equipment (Applied Biosystems), a one nucleotide C–T mutation was detected in position 309. We
presume that this is the reason of the incomplete digestion with Sau3 A I enzyme at the
enzyme breaking site 5’ GATC 3’ and 3’ CTAG 5’. The sequencing of the 400 bp fragment of leptin gene was performed at Progenus SA laboratory, Gembloux (Figures 15 and 16).
Figure 16. The sequence of the sense and antisense 400 bp fragment of the leptin gene
Calculation of gene frequency at the leptin locus. At leptin gene locus two alleles were
studied. We noted them with A and B. These RFLPmarkers are codominantly transmitted
ABAH Bioflux, 2009, Volume 1, Issue 1.
http://www.abah.bioflux.com.ro
16
and Brună de Maramureş - 64 individuals. In Bălţată Românească, from 88 genotypized individuals, after improvement of the Liefers et al (2002) protocol, 53 had the AA homozygous genotype, 32 individuals showed the AB heterozygous genotype and only three individuals had the BB homozygous genotype. These individuals were from the following farms: Agricultural Society Petreşti (Satu Mare), SCDP Jucu from the University of Agricultural Sciences and Veterinary Medicine (Cluj-Napoca) and two private farms from the county of Cluj - Corujan farm (Floreşti) and SC Crişan farm (Gherla). The calculated gene frequencies are presented in Table 8.
Table 8 The gene frequency at the leptin locus in Bălţată Românească individuals
The gene locus Gene frequency (A) Gene frequency (B)
Leptin 0.78 (78 %) 0.22 (22 %)
Analyzing the data in Table 8, we may conclude that A gene appears with higher frequency at leptin gene locus, as compared to B gene.
In Brună de Maramureş, from the 64 genotypized individuals after improvement of
the Liefers et al (2002) protocol, 40 individuals were identified with AA homozygous
genotype and 24 individuals with AB heterozygous genotype. In this population none of the studied individuals were detected with the BB homozygous genotype. The Brună de Maramureş individuals were from the following farms: SC Agrozootehnica (Seini, Maramureş), SC Livada (Satu Mare) and Agricultural Society Petreşti (Satu Mare). The gene frequencies for Brună de Maramureş individuals are shown in Table 9.
Table 9 The gene frequency at the leptin locus in Brună de Maramureş individuals
The gene locus The gene frequency (A) The gene frequency (B)
Leptin 0.81(81%) 0.19 (19 %)
Analyzing the data in Table 9, we can conclude that again gene A appears with a higher frequency at leptin gene locus, as compared to gene B.
The calculation of the genotypes frequencies at leptin gene locus. The following genotypes were detected: AA homozygous genotype, BB homozygous genotype and AB heterozygous genotype. In Bălţată Românească (Table 10), AA homozygous genotype had a value of 0.60 or it represents 66 % of the total of the genotypes, the AB heterozygous genotype has a value of 0.36, or it represents 36% of the total of the genotypes, and BB homozygous genotype recorded the smallest value, only representing 0.04 or 4% of the total of the genotypes.
Table 10 The genotypes frequency at the leptine locus in Bălţată Românească
The gene locus The frequency of the homozigous genotype
(AA)
The frequency of the heterozigous genotype
(AB)
The frequency of the homozigous genotype (BB)
Leptin 0.60 (60%) 0.36
(36%) (4%) 0.04
ABAH Bioflux, 2009, Volume 1, Issue 1.
http://www.abah.bioflux.com.ro
17
Table 11 The genotypes frequency at the leptin locus in Brună de Maramureş
The gene locus The frequency of the homozigous genotype (AA)
The frequency of the heterozigous genotype (AB)
The frequency of the homozigous genotype
(BB)
Leptin 0.62
(62%) (38%) 0.38 0 (0%)
The AA homozygous genotype has a value of 0.62 or it has a frequency of 62%, the heterozygous AB genotype has a value of 0.38, meaning it has a a a frequency of 38%, and the BB homozyogous genotype was not detected in Brună de Maramureş cattle population.
Conclusions
DNA extraction from blood using the manual Wizard Genomic DNA Purification kit,
delivered satisfactory results concerning both quantity and quality.
The rapid DNA extraction method is one of the most often used methds in our
laboratory because both DNA quality and purity ar very good. The method is not expensive and does not consume much work time.
The DNA obtained using automatic MagnaPure LC kit, is of very good quality, with
an average molecular weight of 50 kb and does not exhibit traces of degradation. It is free of RNA and protein contamination. The posibility of using refrigerated and old blood advantages the use of this method These methods of DNA extraction from blood showed that the obtained DNA quantity is inverse proportional to DNA purity.
After testing the significance of the differences between the average values using
the “t” test we found very significant statistic differences (p < 0.001) between the manual Wizard Genomic DNA Purification kit and authomatic extraction method with Magna Pure LC DNA Isolation kit. Significant statistic differences (p < 0.001) were also obtained between the rapid method of DNA extraction and the automatic extraction method with Magna Pure LC DNA Isolation kit.
In both cases the differences were positive, and this signifies that the use of both
methods – the manual Wizard Genomic DNA Purification kit and the rapid method – led to obtaining superior DNA quantities, as compared to the results obtained with the automatic extraction method. Unsignificant differences were obtained between the DNA extraction method with Wizard Genomic DNA Purification kit and the manual method (p > 0.05).
When the protocol proposed by Pomp et al (1997) was tested using the PCR
cycles, and alignement temperature obtained in temperature gradient for PCR, we obtained good results in amplification of the expected 1820 bp product. The
electrophoresis showed that adding 1µl MgCl2 10 mM to the reaction mix led to better
primers. When determining the alignement temperature for obtaining the 1820 bp
fragment, it resulted that the optimal temperature was 640C. The computerised
analysis of the entire sequence of the leptin gene (4067 bp), detected an error in the protocol proposed by Pomp et al (1997), at a nucleotide located in the antisense primer - a C-T type replacement.
When the protocol proposed by Liefers et al (2002) was used, the electrophoresis
in agarose gel of the fragment of 400 bp restricted with Sau3A I produced 400 bp,
300 bp and 100 bp fragments. This allowed us to conclude that some individuals could be AB heterozygous. For the AA homozygous individuals, the corespondent profile is only one 400 bp fragment. The enzyme does not digest this allele.
By genotypization, individuals with homozygous AA and BB genotypes, and AB
ABAH Bioflux, 2009, Volume 1, Issue 1.
http://www.abah.bioflux.com.ro
18
The protocole proposed by Lien et al (1997), led to good results, but only AA
homozygous and AB heterozygous individuals were obtained after restriction with
BsaA1 enzyme.
After sequencing the 400 bp fragment from Brună de Maramureş individuals and
data processing with sequencing soft, one mutation was detected. It determined the alteration of the C-T nucleotiedes, and we presume that it could have been the reason
for the incomplete digestion with Sau3A I enzyme at its restriction site 5’ GATC 3’
and 3’ CTAG 5’.
In the studied Bălţată Românească population, the A gene appeared with a 78%
frequency and gene B wityh 22% frequency. In conclusion, the allele A had a higher frequency at the leptin gene locus, as compared to allele B.
In Brună de Maramureş polulation, A gene appears with 81% frequency and B
gene with 19%. In conclusion, the allele A had a higher frequency at the leptin gene locus, as compared to allele B.
Analyzing the frequencies of the genotypes in Bălţată Românească individuals, we
noticed that the AA homozygous genotype represents 60% of the total genotypes, AB heterozygous genotype 36 % and BB homozygous genotype the smallest share, 4%, respectively of the total genotypes.
The same analysis in Brună de Maramureş population showed that he homozygous
genotype AA represents 62% of total genotypes, AB heterozygous genotype 38% and BB homozygous genotype is 0%, because its presence was not detected in our study.
The originality of the present study consists in genotypization of the Romanian
cattle breeds at leptin gene locus. Up to now, this analysis was not performed in Romania. The importance of this locus is emphasized by the study of the polymorphism of this gene, that allows the early identification of individuals with fattening predisposition – those with B allele (BB genotype), and of those with high content of lean meat – with allele A (AA genotype) and with superior taste properties (e.g. freshness, juicy meat, and carcass with superior qualities etc.).
The improvement of genotypization protocols at this locus will allow the
implementation of the marker assisted selection (MAS) in cattle from our country, for a better valuation on meat market and food industry.
The identification of possible interrelations between the genotypes of leptin, body
weight, dorsal fat layer, and certain carcass traits, represents a modality of identification of genetically distinct animals and makes possible the choice of the most adequate feeding regime.
The validation of such genotypization methods represents a potential application
in using the genetic information for animal selection and improving the marketing decision.
We recommend the use of the protocols described by Liefers et al (2002) and Lien
et al (1997) for the study of polymorphism of the leptin gene and genotypization at this locus, as it was demonstrated that they could produce better results, as
compared to those obtained when the protocol of Pomp et al (1997)was used.
Acknowledgements. We are especially grateful to Dr Dina Coprean from UMF Cluj, Dr Viorica Coşier from USAMV Cluj, Dr Ioan Vintilă from USAMVB Timişoara and Dr Augustin Vlaic from USAMV Cluj for their help and reading the manuscript.
References
Carşai T.-C., Vlaic A., Coşier V., Odagiu A., 2008: Testing of two protocols for genotyping the leptin gene locus and body measurement in Maramures Brown and Romanian
Breed Cattle. Lucrări Ştiinţifice Zootehnie şi Biotehnologii 41(1):25-29.
Friedman J. M., Halaas J. L., 1998: Leptin and the regulation of body weight in mammals,
Nature 395:763 -769.
Iritani N., 2000: Nutritional and insulin regulation of leptin gene expression. Curr Opin
ABAH Bioflux, 2009, Volume 1, Issue 1.
http://www.abah.bioflux.com.ro
19
Ji S., Willis G. M., Scott R. R., Spurlock M. E., 1998: Partial cloning and expression of the
bovine leptin gene. Anim Biotechnol 9:1–4.
Kennedy G. C., 1953: The role of depot fat in the hypothalamic control of food intake in
the rat. Proc Roy Soc Med 140:578-592.
Liefers S. C., te Pas M. F., Veerkamp R. F., van der Lende T., 2002: Associations between leptin gene polymorphisms and production, live weight, energy balance, feed
intake, and fertility in Holstein heifers. J Dairy Sci 85(6):1633-1638.
Lien S., Sundvold H., Klungland H., Vage D. I., 1997: Two novel polymorphisms in the
bovine obesity gene (OBS). Animal Genetics 28:238-46.
Oprzadek J., Flisikowsky K., Zwiwrchowschi L., Dymnicki E., 2003: Polymorphisms at loci of leptin (LEP), Pit1 and STAT5A and their association with growth, feed conversion and carcass quality in Black and White bulls. Anim Sci Papers and Rep
21:135–145.
Pomp D., Zou T., Clutter A.C., Barendse W., 1997: Rapid communication: Mapping of leptin to bovine chromosome 4 by linkage analysis of a PCR-based polymorphism.
J Anim Sci 75:1427.
Renaville R., Gengler N., Vrech E., Prandi A., Massart S., Corradini C., Bertozzi C., Mortiaux F., Burny A., Portetelle D., 1997: Pit-1 gene polymorphism, milk yield,
and conformation traits for Italian Holstein Friesian bulls. J Dairy Sci, 80
:3431-3438.
Tessane K., Hines H. C., Davis M. E., 1999: Relationship of polymorphism in the leptin gene with differences in beef carcass traits. Research and Reviews. Special Circular 170-199.
Vlaic A., Coşier V., Odagiu A., Oroian T., Bâlteanu V., 2005: Analysis of genetic diversity in five cattle breeds from Romania. Bulletin of USAMV Cluj-Napoca, Seria
Zootehnie şi Biotehnologii 61:332.
Vlaic A., Pamfil D. C., Gaboreanu I., Vlaic B., Renaville R., 2003: Increasing milk production in cattle using DNA marker assisted selection (Pit-1), Buletin USAMV
Cluj-Napoca, Seria Zootehnie şi Biotehnologii 59:188-191.
Vlaic A., Ciobanu D. C., Oroian T., 2001: Preliminary research concerning the association between the genotypes at the kappa-caseine locus and milk production traits in
cattle. J Agric Sci Debrecen 1:45-48.
Vlaic A., Petre A., Oroian T., Ciobanu D. C., Cighi V., 2001: Reserch concerning the kappa-caseine and β-lactoglobulin genetic polymorphism established at DNA level and its use for genetic marker assisted selection in catle. Bulletin of USAMV Cluj-Napoca Seria ZMV 55-56.
Wauters M., Cosidine R. V., Van Gaal L. F., 2000: Human leptin: from an adipocyte
hormone to an endocrine mediator. Eur J Endocrinol 143:293-311.
Zhang Y., Proenca R., Maffei M., Barone M., Leopold L., Friedman J. M., 1994: Positional
cloning of the mouse obese gene and its human homologue. Nature 372:425-432.
www.inra.fr/Internet/Produits/PA www.ncbi.nlm.nih.gov
Received: 21 June 2009. Accepted: 15 October 2009. Published online: 16 October 2009. Author:
Teodora-Crina Carşai, University of Agricultural Sciences and Veterinary Medicine Cluj-Napoca, Faculty of Animal Husbandry, Department of Biotechnologies, Cluj-Napoca, Romania, EU, Calea Mănăştur 3-5, 400372, e-mail: [email protected]
How to cite this article:
Carşai T.-C., 2009 Genetic markers assisted selection in cattle: leptine gene locus and its polymorphism. ABAH Bioflux 1(1):1-19.
Printed version: ISSN 2066-7612
ABAH Bioflux, 2009, Volume 1, Issue 1.
http://www.abah.bioflux.com.ro