*e-mail: [email protected]
Received: 6 August 2013 / Accepted: 4 December 2013
Atherosclerotic plaque characterization using plaque area variation
in IVUS images during compression: a computational investigation
Matheus Cardoso Moraes*, Fernando Mitsuyama Cardoso, Sérgio Shiguemi Furuie
Abstract Introduction: The rupture of atherosclerotic plaques causes millions of death yearly. It is known that the kind of predominant tissue is associated with its dangerousness. In addition, the mechanical properties of plaques have been proved to be a good parameter to characterize the type of tissue, important information for therapeutic decisions. Methods: Therefore, we present an alternative and simple way to discriminate tissues. The procedure relies on computing an index, the ratio of the plaque area variation of a suspecting plaque, using images acquired with vessel and plaques, pre and post-deformation, under different intraluminal pressure. Numerical phantoms of coronary cross-sections with different morphological aspects, and simulated with a range of properties, were used for evaluation. Results: The outcomes provided by this index and a widely used one were compared, so as to measure their correspondence. As a result, correlations up to 99%, a strong agreement with Bland-Altman and very similar histograms between the two indices, have shown a good level of equivalence between the methods. Conclusion: The results demonstrated that the proposed index discriminates highly lipidic from ibro-lipidic and calciied tissues in many situations, as good as the widely used index, yet the proposed method is much simpler to be computed.
Keywords Intravascular Ultrasound (IVUS), Atherosclerosis, Intravascular elastography, Phantoms, Strain map.
Introduction
Atherosclerotic plaque rupture is the main reason of acute coronary events. In United States of America (USA) 785,000 new coronary attacks occurs annually, with 470,000 recurrences. A coronary event happens every 25 seconds with one death per minute. Moreover, in 2007 and 2008 the total cost of cardiovascular disease and stroke of USA were U$286 and U$297.7 billions, respectively, greater than costs of other diseases (Roger et al., 2012; Rosamond et al., 2007).
Atherosclerosis is the accumulation of lipidic, ibrous, and calciied tissues in the arterial wall. An atherosclerotic plaque rupture may lead to myocardial infarction, unstable angina, or sudden cardiac death (Davies, 2000; Falk et al., 1995; Maurice et al., 2005; Viermani et al., 2000). The lesion severity is directly related to plaque composition and morphological features. A subset of vulnerable plaque is recognized by having large lipid pool with macrophages, covered by a thin cap (Baldewsing et al., 2004; Davies, 1996; Viermani et al., 2000). Accordingly, by identifying the preponderant tissue in a suspecting plaque, very important lesion information is revealed, as the kind of tissue is related to the dangerousness. Consequently, this information provides extra aspects for more accurate therapeutic decision or interventional
procedure (Fisher et al., 2000; Ohayon et al., 2001). Consequently, tools and methods dedicated to intravascular ultrasound (IVUS) have been growing rapidly (De Korte and Van der Steen, 2002; Le Floc’h et al., 2009; Maurice et al., 2005).
IVUS is a popular imaging modality for cardiac interventional procedures. Its images supply the cardiologists with anatomical, morphological and pathological coronary and plaque information, crucial for diagnostics, evaluations, and treatment planning (Baldewsing et al., 2004; Liang et al., 2009). Nonetheless, to accurately infer about atherosclerotic plaque composition and dangerousness, additional procedures, such as segmentation and intravascular Elastography, are important (Baldewsing et al., 2004; Cardenas et al., 2013; De Korte and Van der Steen, 2002; Le Floc’h et al., 2009; Maurice et al., 2005; Moraes and Furuie, 2010, 2011).
Moraes MC, Cardoso FM, Furuie SS
the best therapeutic procedure can be carried out (Céspedes et al., 1993; Ophir et al., 1991). Basically, the Elastography procedure is divided into three main blocks: First, the images are acquired with a variation of intraluminal pressure - usually arterial pressure and inlated balloon are used as source of pressure (De Korte et al., 1999; Shapo et al., 1996). Second, the displacements of microstructures are computed, followed by the strain map computation. Finally, by knowing the intraluminal pressure and resultant strain map, Finite Element Method (FEM) is usually applied to calculate the corresponding force vector and consequent elasticity map, the Young’s Modulus of structures (Baldewsing et al., 2004; De Korte and Van der Steen, 2002; Fisher et al., 2000; Le Floc’h et al., 2009; Ohayon et al., 2001).
Prior approaches have dedicated efforts to build well-documented and widely recognized materials in coronary and plaque functional behavior (Baldewsing et al., 2004; Céspedes et al., 1993; De Korte and Van der Steen, 2002; Fisher et al., 2000; Le Floc’h et al., 2009; Loree et al., 1994, Maurice et al., 2005; Ohayon et al., 2001; Ophir et al., 1991). As a result, anatomical and mechanical aspects such as Cap thickness, lesion disposition and parameter values are known. Hence, new tools and methods in Elastography have been created, providing alternative tools for therapeutic decisions, evaluation, and interventional procedures (Fisher et al., 2000; Ohayon et al., 2001). Although precise and reliable, IVUS Elastography is still a costly and complex method to be implemented. Therefore, simple and reliable alternatives for extracting mechanical properties of tissue are needed.
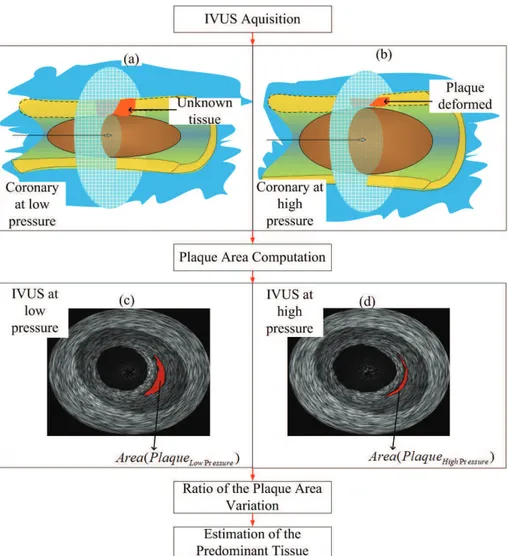
The proposed approach presents a simple and more practical procedure for extracting mechanical properties of suspecting atherosclerotic tissues. The method can be an alternative choice to IVUS Elastography. In our procedure the mechanical properties and corresponding composition of tissues of a suspecting lesion, can be estimated by computing the area ratio of the plaque under inspection in IVUS images (Figure 1). Therefore, during imaging acquisition (Figures 1a and b), different pressure is applied by an expandable balloon to acquire the deformed and non-deformed images. Thus, a distinguishable deformation ratio is assured, and problems related to uncertainty of intraluminal pressure, catheter eccentricity and inclination are well overcome. After, the Plaque Area Computation(Figures 1c and d), the plaque areas under inspection in the IVUS images are segmented and the area of a suspecting plaque quantiied in different pressures. Next, Ratio of the Plaque Area Variation, the overall percentage of plaque deformation is calculated (Cardoso et al., 2012). As
a result, the type of the predominant tissue of the suspecting area is estimated based on the regional deformation values. Therefore, the goal of this paper is to introduce the procedure, and using deformable numerical phantoms, demonstrating the capability of tissue discrimination of the proposed index, Plaque Area Variation (AR), in a range of situations.
Methods
The materials used for this work are comprised by a personal computer with an Intel Core 2 Duo, and microprocessor of 2.53 GHz, 4 GB of RAM, Windows 7 64 bits, MATLAB® (2009a) (MathWorks, Inc., Natick, MA, USA) with Imaging Processing and Partial Differential Equation Toolbox. Due to computational models advancements (Hoskins, 2008), numerical phantoms were used. The phantoms, deformation outcomes and gold standard strain maps were obtained bythe framework described by Cardoso et al. (2012). The complete method is embedded in the Toolbox called IVUSSim. It is a citationware software, available online at http://www. leb.usp.br/IVUSSim, free of charge for research and educational purposes (Cardoso et al., 2012). A brief explanation of the framework is given below.
Overview of IVUSSim
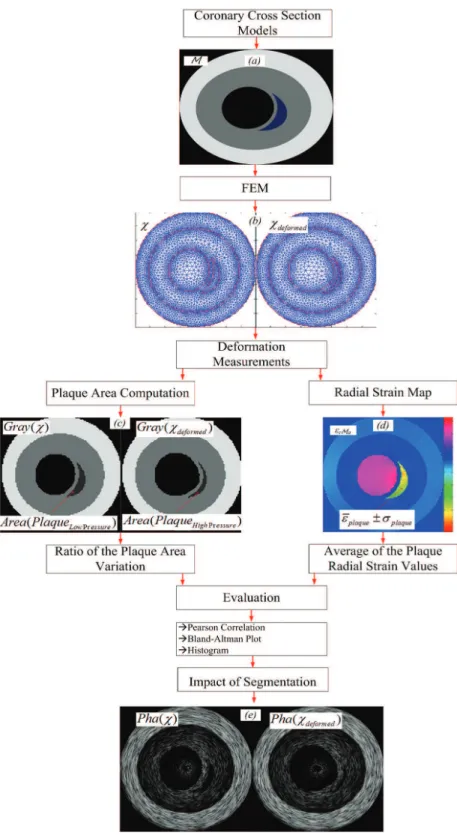
Realistic IVUS image generation in Different Intraluminal Pressures(IVUSSim) - The framework is a tool, in which from different anatomical and morphological coronary cross-section models and input parameters, IVUS phantoms are created (Figure 2e). In addition, some related results, such as the corresponding non-deformed and deformed gray level images (Figure 2c), strain maps (Figure 2d) are also generated to serve as gold standard to many investigations (Cardoso et al., 2012). In summary, the framework works as follows: First the user selects an available, or designs a new coronary cross section model, representing a coronary cross section in a diastole cardiac phase (Figure 2a). Second, the investigator sets some parameters, such as ultrasound frequency, number of transducers, and incremental intraluminal pressures. Third, the algorithm automatically identiies the different regions of the selected model, such as media, adventitia, and plaques, and asks the user to insert the corresponding mechanical properties, such as Young’s Modulus, for each region. Next, a 2D mesh is constructed, and FEM is carried out, so that the deformed mesh is generated (Figure 2b). Finally, a morphism procedure is performed; hence, ininitesimal or very small structures, such as scatterers and pixels, are repositioned according to FEM deformation. As a result, the correspondent mesh and deformed mesh Rev. Bras. Eng. Bioméd., v. 30, n.2, p. 159-172, jun. 2014
Braz. J. Biom. Eng., 30(2), 159-172, June 2014
led to the gray level images and realistic phantoms, respectively (Figures 2c and e). In addition, as the displacement of small structure is known, the strain map is also generated (Figure 2d). Therefore, the gray level images, and strain map (Figures 2c and d) can be used as gold standards for investigation of structural deformations and shifting of small particles, such as speckle or pixel. For more information about the phantom creation framework, please refer to Cardoso et al. (2012).
Deformation measurements
Two different methods are used to compute the level of plaque deformation, the Average of the Plaque Radial Strain Values (AS) (Figure 2d), and the proposed method, the Ratio of the Plaque Area Variation (AR) (Figure 2c). The AR outcomes are obtained by:
(
)
(
)
(
)
High Pressure Low Pressure
Low Pressure
Area Plaque Area Plaque AR
Area Plaque
−
= (1)
where, Area(PlaqueLow Pressure) and Area(PlaqueHigh Pressure) are the plaque areas with low, and high intraluminal pressure, respectively. The plaque areas were obtained from the gray level images (Figure 2c), since they are the images representation of the mesh and deformed mesh, gold standards, the plaque under investigation in low and high pressure are isolated and their area computed. The AS results are extracted from the corresponding radial strain map by:
plaque plaque
AS= ε ± σ (2)
where, eplaque, and splaque are the mean and standard deviation of the plaque radial strain map values, respectively (Figure 2d).
Moraes MC, Cardoso FM, Furuie SS
Figure 2. Block diagram of the overall methodology of this approach: (a) A coronary cross section model under evaluation (M); (b) The mesh, c, and deformed mesh, cdeformed, of M, after FEM; (c) The corresponding gray level images of the mesh, c, and deformed mesh, cdeformed, Gray(c) and Gray(cdeformed), respectively; (d) Strain Map corresponding to the resultant deformation; (e) The resultant non-deformed and deformed IVUS phantoms.
Rev. Bras. Eng. Bioméd., v. 30, n.2, p. 159-172, jun. 2014
Braz. J. Biom. Eng., 30(2), 159-172, June 2014
The investigation
Using IVUSSim, the present approach aims to demonstrate computationally the potential of the proposed index, AR, for atherosclerotic tissue characterization. In addition, the index reliability is reinforced, by comparing its results with the corresponding outcomes obtained by strain map computations, a widely used index, which can be found in many studies (Baldewsing et al., 2004; Le Floc’h et al., 2009; Maurice et al., 2005; Shapo et al., 1996). Speciically,the phantoms were generated with ultrasound frequency at 20 MHz and transducer with 256 RF-lines and the tissue acoustic parameters of Table 1. The FEM was carried out in a set of coronary cross section models under a variation of conditions, such as different cap-thickness values, and Young’s modulus. The deformation results of each kind of plaque, highly-lipidic, ibro-lipidic, and calciied, were computed by the two indexes, so that they could be directly compared. The overall procedure of this approach is summarized as follows (Figure 2). First, a Coronary Cross Section Model (Figure 2a) is chosen from a set of models to be investigated (Figure 3). Second, FEM was performed to simulate the different physiological coronary and plaque behaviors (Cardoso et al., 2012). Third, the two deformation measurements, AR (Figure 2c) and AS (Figure 2d) were used to obtain the plaque deformation values. Finally, the correspondence between the two methods and the reliability of the proposed method were directly related, and statistically corroborated during the Evaluation (Figure 2). The evaluation was performed by computing and comparing the deformation values obtained by the proposed method, AR, and a well known method, strain map computations. Pearson correlation, Bland-Altman plot, and the Histogram of the deformation values computed by the two indices were carried out so that the reliability of the proposed method could be analyzed. Finally, the results obtained by the gold standards, the gray level images, were compared to the corresponding outcome obtained by the segmented phantoms; thus,
the impact of segmentation for highly-lipidic plaque could be measured.
Coronary cross section models
A set of coronary cross section models, with a variation of morphological features, was created to have the coronary plaque deformities investigated (Figure 3). The set of models represents the anatomical shape of artery coronary cross sections in a diastole cardiac phase. The adventitia is represented by the lighter gray region, the media is the dark gray, and the blue, brown and white represent the highly-lipidic, ibro-lipidic, and calciied plaques, respectively (Figure 3). Each model was simulated in different morphological situations. The morphological situations correspond to the different kinds of plaques and their disposition in the coronary with the cap thickness values, Cap = 100, 200,and300 µm, common values employed by apposite studies (Baldewsing et al., 2004; Le Floc’h et al., 2009; Maurice et al., 2005). Therefore, the plaque behavior when the plaque is isolated, and when it is neighboring another plaque, with different cap thickness, could be investigated. Speciically for models Mf and Mi (Figures 3f and i), the calciied plaque is in front of the highly-lipidic and ibro-lipidic plaques, respectively. In a real IVUS image, the calciied tissue would produce a shadow covering the others plaques. For this reason, the analysis of the highly-lipidic and ibro-lipidic plaques in this situation would be unfeasible, since investigators and methods wouldn’t be able to see them. However, the goal here, by using these two models, is to investigate the calciied plaque behavior with other neighbor’s tissues. Since the calciied can be identiied in real IVUS images and in the phantoms, the investigation could be performed.
Coronary and plaques parameters for performing FEM
The physiological coronary and plaque properties and behaviors were numerically represented. In order to do that, the coronary and plaque parameters used in
Table 1. Acoustic and mechanical tissue parameters used in the Models.
Tissue
Parameters
Acustic Mechanical
Attenuation [dB/(cm.MHz)] Acoustic impedance [MRayl] Young’s modulus [kPa]
Adventicia 1.57 1.81 80kPa, 150kPa, 300kPa, 450kPa, 600kPa
Media 1.09 1.62 600kPa
Higly lipidic 0.48 1.40 25kPa
Fibro lipidic 0.54 1.63 296kPa
Moraes MC, Cardoso FM, Furuie SS
IVUSSim, were extracted by a number of previous investigations (Baldewsing et al., 2004; Cardoso et al., 2012; Le Floc’h et al., 2009; Zienkiewicz et al., 2010a, 2010b). The mesh was generated with triangular element, using Delaunay triangulation. To maximize precision, a higher mesh density was disposed at the borders (Figure 2b). The intraluminal forces were applied perpendicularly to the lumen border, corresponding to a compliant balloon producing from 1 to 0.05 atm of pressures. The minimum 0.05 corresponds approximately to 40 mmHg, which is the normal difference between systolic and diastolic cardiac pressure. The maximum of 1 atmwas chosen, because level of pressure provides a good tradeoff between high deformation ratio and risk of plaque rupture during acquisition procedures. Moreover, by using the balloon, problems with catheter eccentricity and inclination are overcome, ensuring the reliability of the deformed values (Choi et al., 2002; De Korte et al., 1999; Shapo et al., 1996). The ixed nodes, at the external border, after the adventitia tissue, were selected to be the boundary condition. The arterial and plaque
mechanical properties used were: Poisson’s ratio, ν = 0.49, and Young’s modulus, E = 600 kPa, 1500 kPa, 296 kPa, and 25 kPa, for the media, calciied, ibro-lipidic, and highly-lipidic with macrophages, respectively. As the adventitia may have a variation of elasticity, 5 values were considered for simulation
Eadventitia = 80, 150, 300, 450, 600 kPa. All parameters
values are correspondent to mechanical properties of in vivo coronaries, and were obtained from previous related studies (Table 1) (Baldewsing et al., 2004; Cardoso et al., 2012; De Korte and Van der Steen, 2002; Le Floc’h et al., 2009; Shapo et al., 1996; Zienkiewicz et al., 2010a, 2010b).
Results
We evaluated the reliability of the proposed index by analyzing two aspects, the correlation between, AR and AS, as well asthe equivalence between deformation ratios and corresponding tissues. The deformation values of AR and AS for the three plaques using nine models (Figure 3) in different situations Figure 3. Coronary cross section models (Mn) to investigate: (a) The highly-lipidic plaque; (b) The ibro-lipidic plaque; (c) The calciied plaque; (d) Highly-lipidic
with a ibro-lipidic plaque neighbor; (e) The ibro-lipidic with a highly lipidic plaque neighbor; (f) The calciied with a highly-lipidic neighbor; (g) The highly-lipidic with a calciied plaque neighbor; (h) The ibro-lipidic tissue with a calciied plaque neighbor; (i) The calciied with a ibro-lipidic neighbor.
Rev. Bras. Eng. Bioméd., v. 30, n.2, p. 159-172, jun. 2014
Braz. J. Biom. Eng., 30(2), 159-172, June 2014
were acquired at 6 different pressures, 1, 0.75, 0.5, 0.25, 0.1, 0.05 atm. The Models, Ma, Md, and Mg (Figures 3a, d, and g), were devoted to deformation values of the highly-lipidic plaque, whereas Mb, Me, Mh, and Mc, Mf, Mi were dedicated to the ibro-lipidic,
and calciied plaque ones, respectively (Figures 3b, e, h, and c, f, i). In addition, different morphological situations were also considered for computing the deformation outcomes, for instance, Cap = 100, 200, 300 µm, and adventitia elasticity Eadventitia = 80, 150, 300, 450, 600 kPa. The entire simulation for the different models and morphological situations led to 135 values for each pressure, for instance Table 2 shows the values for 1 atm of pressure, which were computed by Equations 1 and 2. As it can be observed in Table 2, the greatest majority of AR values are very close and inside the mean and standard deviation of the AS index, showing a strong correspondence between them.
Comparison
The evaluation was performed by: First computing the Pearson Correlation between each AR result with the corresponding AS (reference method); Second, analyzing residuals using Bland Altman plot; Third verifying the separability among classes (Histogram) for the deformation outcomes of each of the 6 applied pressures (Figures 4, 5 and 6). In addition, the impact of segmentation, for highly-lipidic plaque classiication, was measured.
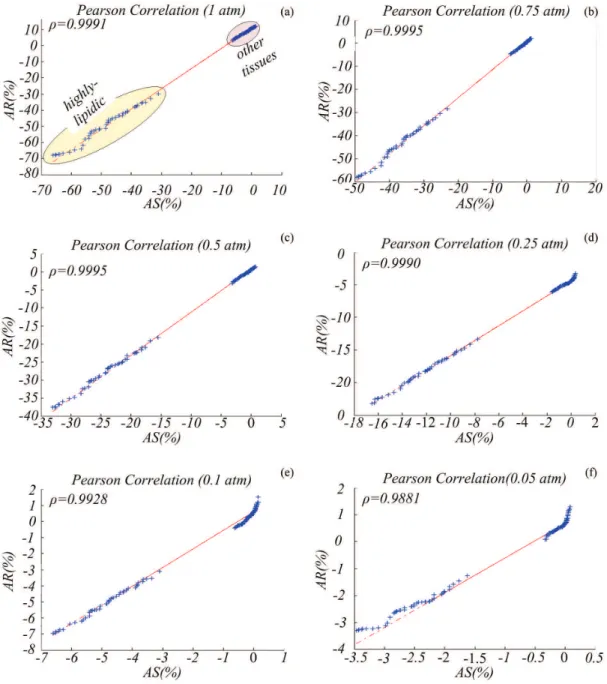
Pearson Correlationis an index which measures how similar two sets of data are; the level of correlation is denoted by (ρ), and the closer it is to 1, the higher is the correlation. Speciically, the Pearson Correlation was computed, and the correspondences between AR and AS, for the results of the 6 pressures were obtained (Figures 4). As can be observed in Figure 4, there are two predominant clusters, as highlighted in Figure 4a: bottom-left - cluster of highly-lipidic values; top-right: the other tissues, for instance ibro-lipidic and calciied. The two clusters can be noticed for the six applied pressures. The linear aspect of the clusters in all cases (Figure 4) demonstrates the strong correspondence between the two indexes, AR and AS. It proved the strong relationship between the AR and AS values, for highly-lipidic, ibro-lipidic calciied tissue results. In addition, a correlation, ρ, very close to 1 in practically all cases (Figure 4), with a linear correlation (AR ≈1.2AS), strongly corroborate the two indexes proportionality.
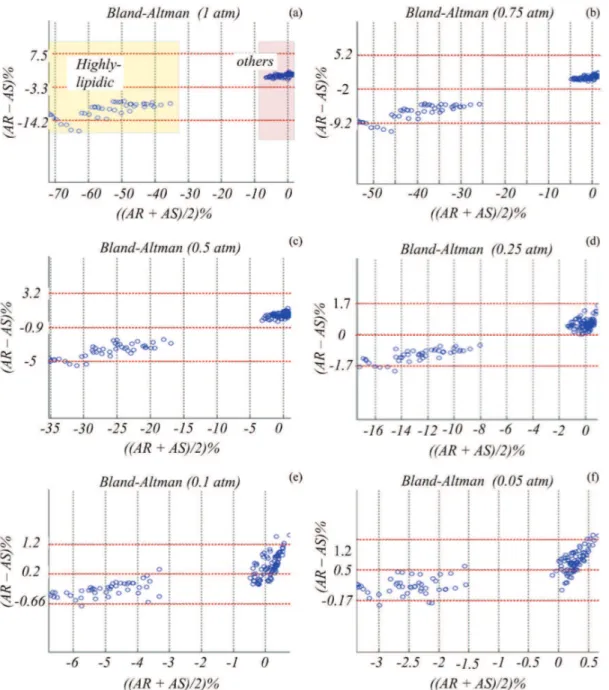
The Bland Altman plot provides information about the level of agreement between two sets of data, which are devoted to measure a common property; the more points inside the limits, the greater the agreement between two indices. In our evaluation, the
Bland Altman plot was performed between AR and AS also for the 6 pressures (Figures 5). As expected, it could be identiied two major clusters of data, the data provided by the highly-lipidic and other tissues deformations, highlighted in Figure 5a. As can be seen in Figure 5, the plots, for all pressures, show the immense majority of points inside the limit of agreement, indicating the strong agreement between AS and AR outcomes.
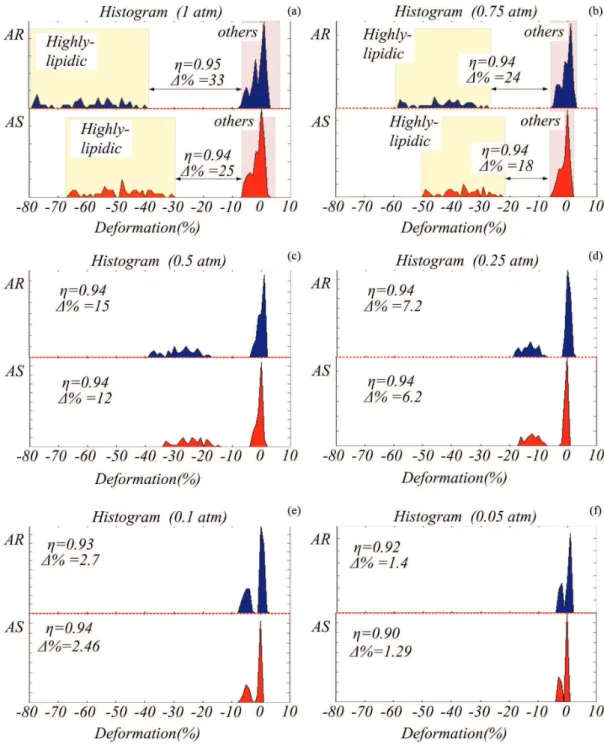
The Histogram is a representation of data distribution. By carrying out the histogram of a dataset in different situations, besides the frequency of occurrence, we can visually demonstrate the tendency in shape and direction of each cluster. Additionally, it permits the computation of some related parameters, such as separability (η), and the difference in distance between clusters (∆(%)). Again, in this evaluation, the Histogram for AR and AS data, for the 6 applied pressures was computed (Figure 6). As can be observed in Figure 6, the highly-lipidic and other tissue clusters of deformation values can be well identiied in both, the AR and AS histogram, and for all applied pressure. In addition, both indexes, AR and AS, provide similar distributions (Figure 6). Therefore, the high correlation between the proposed and usual method are reinforced.
Highly-lipidic discrimination
It can be assumed that the AR distributions discriminate better the tissues than the values computed by AS (Figure 6). As can be observed in Figure 6, the higher average of highly-lipidic distribution of AR led to a greater difference between the highly-lipidic and the other cluster. We also analyzed the discrimination capability of AR by computing two indices, the histogram class separability, η, (Otsu, 1979), and the difference in distance between classes of tissue (∆(%)). The η quantiies how two clusters of data can be well discriminated; it varies from 0 to 1, the greater the separability, the better the method is for classes discrimination. The ∆(%) provides the minimum distance between edges of two classes, illustrated in Figures 6a and b. Both indices, η and∆(%) were computed between the two clusters for the two indices, AR and AS, and for all pressures (Figure 6). As can be observed in Figure 6, η is almost the same, while ∆(%) for the AR values is higher than for the AS in all cases. Consequently, highly-lipidic plaque can be reliably identiied by the proposed method.
Impact of segmentation for highly-lipidic discrimination
Mor
aes MC, C
ar
doso F
M, F
ur
uie SS
Table 2. Deformation values of each plaque for 1 atm of pressure, measured in the 9 models with two indexes, AR and AS, three cap-thickness values, 100, 200, and 300um, and ive different adventitia elasticity, 80,
150, 300, 450, 600kPa.
M
a( highly-lipidic ) Mb (ibro-lipidic) Mc (calciied)
80kPa 150kPa 300kPa 450kPa 600kPa 80kPa 150kPa 300kPa 450kPa 600kPa 80kPa 150kPa 300kPa 450kPa 600kPa
100um AR(%) –61.50 –64.03 –66.01 –67.20 –67.95 –1.88 –2.32 –4.03 –3.38 –4.91 1.71 1.13 0.72 0.48 0.44
AS(%) –47.64 –50.59 –53.72 –55.26 –56.17 –1.45 –2.48 –3.65 –4.26 –4.63 0.92 0.51 0.00 –0.29 –0.47
±21.97 ±22.71 ±23.52 ±23.92 ±24.16 ±1.40 ±1.40 ±1.42 ±1.44 ±1.45 ±0.62 ±0.57 ±0.55 ±0.56 ±0.57
200um AR(%) –45.19 –48.10 –51.09 –51.90 –53.37 –0.97 –1.74 –2.40 –3.33 –3.49 1.82 1.28 0.85 0.97 1.16
AS(%) –35.32 –38.21 –41.39 –42.97 –43.92 –1.03 –1.96 –3.06 –3.63 –3.99 0.89 0.50 0.01 –0.27 –0.44
±17.73 ±18.64 ±19.65 ±20.16 ±20.46 ±1.18 ±1.20 ±1.23 ±1.26 ±1.28 ±0.58 ±0.56 ±0.56 ±0.58 ±0.59
300um AR(%) –39.77 –42.78 –44.98 –46.96 –47.78 –0.34 –1.59 –2.50 –2.89 –3.49 1.55 1.12 0.69 0.78 1.12
AS(%) –30.95 –33.56 –36.54 –38.07 –39.00 –1.15 –1.97 –2.95 –3.48 –3.82 0.75 0.39 –0.06 –0.32 –0.48
±15.61 ±16.48 ±17.49 ±18.00 ±18.32 ±1.10 ±1.13 ±1.18 ±1.22 ±1.24 ±0.53 ±0.51 ±0.53 ±0.55 ±0.56
M
d ( highly-lipidic ) Me(ibro-lipidic) Mf (calciied)
80kPa 150kPa 300kPa 450kPa 600kPa 80kPa 150kPa 300kPa 450kPa 600kPa 80kPa 150kPa 300kPa 450kPa 600kPa
100um AR(%) –71.74 –74.52 –76.64 –77.26 –77.45 –0.36 –1.29 –1.78 –2.02 –2.23 2.06 1.49 1.42 1.13 1.25
AS(%) –54.01 –58.89 –62.72 –64.23 –65.03 0.51 –0.84 –1.92 –2.34 –2.57 1.51 1.03 0.63 0.47 0.38
±23.41 ±24.76 ±25.82 ±26.23 ±26.46 ±1.84 ±1.86 ±1.92 ±1.95 ±1.98 ±1.12 ±1.12 ±1.19 ±1.23 ±1.26
200um AR(%) –53.19 –57.68 –61.20 –62.08 –63.06 0.21 –0.71 –1.46 –1.67 –1.79 1.94 1.73 1.21 1.38 1.42
AS(%) –41.94 –46.82 –50.75 –52.31 –53.15 0.44 –0.74 –1.70 –2.08 –2.29 1.36 0.93 0.56 0.41 0.33
±18.71 ±20.17 ±21.36 ±21.84 ±22.09 ±1.57 ±1.55 ±1.58 ±1.61 ±1.62 ±1.05 ±1.05 ±1.11 ±1.16 ±1.19
300um AR(%) –45.63 –50.30 –53.27 –55.09 –55.97 0.26 –0.74 –1.34 –1.55 –1.62 1.71 1.71 1.29 1.09 1.16
AS(%) –36.44 –41.30 –45.24 –46.82 –47.67 0.43 –0.66 –1.56 –1.92 –2.11 1.26 0.86 0.52 0.38 0.31
±15.26 ±16.72 ±17.92 ±18.40 ±18.66 ±1.26 ±1.27 ±1.33 ±1.37 ±1.40 ±0.85 ±0.87 ±0.95 ±1.00 ±1.04
M
g( highly-lipidic ) Mh (ibro-lipidic) Mi(calciied)
80kPa 150kPa 300kPa 450kPa 600kPa 80kPa 150kPa 300kPa 450kPa 600kPa 80kPa 150kPa 300kPa 450kPa 600kPa
100um AR(%) –73.93 –76.20 –77.37 –77.79 –78.00 –2.93 –4.82 –5.71 –6.39 –6.71 1.55 1.08 0.40 –0.13 0.06
AS(%) –56.56 –60.60 –63.90 –65.25 –65.98 –2.59 –4.11 –5.45 –6.03 –6.35 1.00 0.32 –0.32 –0.60 –0.76
±24.28 ±25.36 ±26.24 ±26.60 ±26.80 ±1.63 ±1.65 ±1.68 ±1.69 ±1.70 ±0.78 ±0.73 ±0.74 ±0.75 ±0.76
200um AR(%) –55.99 –58.91 –62.10 –63.06 –64.00 –2.54 –3.71 –5.05 –5.51 –5.99 1.48 1.13 0.27 0.25 0.17
AS(%) –44.23 –48.37 –51.82 –53.25 –54.02 –2.38 –3.76 –5.01 –5.56 –5.86 0.87 0.25 –0.34 –0.60 –0.75
±19.60 ±20.80 ±21.81 ±22.23 ±22.46 ±1.54 ±1.56 ±1.59 ±1.60 ±1.62 ±0.75 ±0.71 ±0.71 ±0.73 ±0.74
300um AR(%) –47.65 –51.63 –54.48 –55.97 –56.69 –2.32 –3.66 –4.55 –5.30 –5.15 1.38 0.66 0.24 0.20 0.20
AS(%) –38.59 –42.74 –46.25 –47.70 –48.49 –2.11 –3.43 –4.63 –5.16 –5.46 0.83 0.25 –0.31 –0.56 –0.70
±16.02 ±17.25 ±18.31 ±18.74 ±18.99 ±1.18 ±1.23 ±1.29 ±1.33 ±1.34 ±0.59 ±0.59 ±0.62 ±0.65 ±0.66
Rev
. B
ras
. E
ng
. B
ioméd
., v
. 30, n.2, p
. 159-172, jun. 2014
Br
az. J. Biom. E
ng
., 30(2), 159-172, J
une 2014
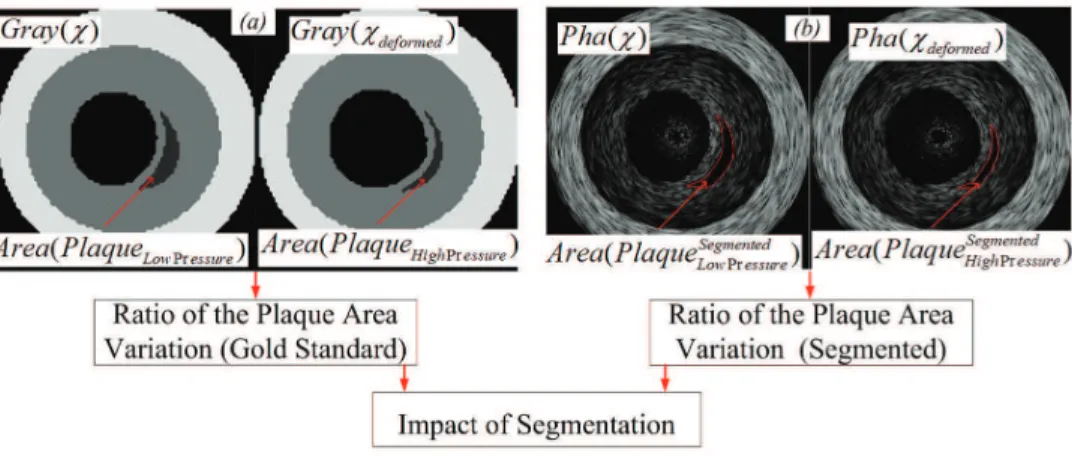
were manually segmented by specialists (Figure 7b). Once the phantoms were ready two investigators, with knowledge in IVUS image features and segmentation, segmented manually in agreement to each other, the corresponding lipidic regions of the phantoms. Once the corresponding areas were obtained, the Ratios of the Plaque Area Variation were computed for the segmented plaques. The impact of segmentation (IS) was obtained by computing the error, using:
Segmented
IS=AR−AR (3)
where, AR and ARSegmented, are the area ratios computed by the gold standards (Figure 7a), and corresponding segmented images (Figure 7b), respectively, and IS is the impact or error of segmentation. The obtained IS
result, was 4.3 ± 3.3%. This value may only inluence the discrimination between highly-lipidic and other tissues, for pressures equal and below 0.25 atm, where the pressure does not cause enough deformation to overcome the discrimination between highly lipidic and other tissues. However, better segmentation result can be obtained using other segmentation approaches, or with a good preprocessing.
Moraes MC, Cardoso FM, Furuie SS
Discussion
Previous works have demonstrated the importance, and contributed to Elastography, and coronary disease investigations (Baldewsing et al., 2004; De Korte and Van der Steen, 2002; Le Floc’h et al., 2009; Liang et al., 2009; Loree et al., 1994; Maurice et al., 2005; Ophir et al., 1991). Consequently, information of Elastography, coronary and atherosclerosis, has been provided. This knowledge is important to help
cardiologists and investigators to improve diagnostic, therapy, evaluation, as well as for creating new tools and methods. However, despite efforts, and advancements, atherosclerosis is still a dramatic problem. In addition, for the majority of cardiologic centers in the world, implementing, and managing the methods presented by the literature is dificult. The reason is that most of clinics and hospitals around the world lack inancial support, and specialists with expertise in computing and mathematical skills. As Figure 5. Bland Altman Analyses between AR and AS values for pressures of: (a) 1 atm; (b) 0.75 atm; (c) 0.5 atm; (d) 0.25 atm; (e) 0.1 atm; (f) 0.05 atm.
Rev. Bras. Eng. Bioméd., v. 30, n.2, p. 159-172, jun. 2014
Braz. J. Biom. Eng., 30(2), 159-172, June 2014
a result, buying new equipment, or implementing complex methods, is not always feasible. Therefore, new approaches with simpler implementation, more practical, yet as reliable as previous methods, are welcome.
We presented a simple and practical method, in which by the area ratio of a plaque the predominant tissue is classiied. The evaluation has shown that the proposed index reliably distinguishes the
Moraes MC, Cardoso FM, Furuie SS
in Figure 4, for all plaques, and considering all situations, the AR deformation values are proportional to the tissue stiffness, following the AS outcomes; as a result, a correlation close to 100% was obtained. The strong agreement between the two indices is reinforced by the Bland Altman analyses, in which the great majority of points are inside the limits of agreement (Figure 5). In addition, the AR distributions provide good tissue discrimination (Figure 6). The discrimination capability was quantiied by computing the histogram class separability (Otsu, 1979), and the difference in distance between classes in which, the strain values computed by AR provided a higher difference (Figure 6). Besides providing better discrimination among tissues, the AR estimation requests a very simple area computing operation after any segmentation method. The segmentation method, for the speciied acoustic parameters, provided an accuracy of 4.3±3.3%, this permits reliability for all results above 0.25 atm of pressure, since they provide difference above 7.2%. Moreover, the image processing operations can be entirely performed using basic operations of free license software, such as ImageJ.
In summary, the resultant high correlation between the proposed and well-known method, alongside the simplicity, proved the method feasibility, and low-cost. As a result, the contribution and implications are: (a) A combination of simple and usual procedures for plaque stiffness estimation; (b) The proposed method can be applied directly to similar modalities, for instance, Intravascular Optical Coherence Tomography (IOCT) and Intravascular Magnetic Resonance (IMR); (c) The proposed method may be an alternative in many places, by allowing clinics and centers to have an extra tool to support their exams, therapy planning, and evaluation.
The inclination and eccentricity of the catheter during image acquisition, not enough tissue contrast for segmentation process, may be seen as limitation for this approach. Consequently, they are also a restriction for any 2D algorithm, such as strain or elastic map, as they also rely only on 2D IVUS images. The Poisson’s ratio, ν = 0.49, does not varies in this study, the value were obtained and used in other related studies, which considered the coronary a quasi-incompressible material. Indeed, its variation would result in different deformation values, which would not represent the coronary strains, yet as this parameter is applied in the entire model and not locally these changes would be correspondent in the two indexes AR and AS. Moreover, 3D methods would be the best choice to provide more complete vessel and coronary information, since they provide deformations of all directions, and not only the transversal one. However, 2D approaches resultant of well acquired IVUS images, with transducer carefully placed perpendicular to vessel wall, provide good information to localize and estimate predominant tissues of suspect areas. Indeed, depending on the segmentation method accuracy, higher pressure by the balloon is required, so that the separation between highly-lipidic and other tissues is increased. Therefore, the possession and correct use of a compliance balloon is an important part of the presented procedure. As a result, a simpler and alternative method to estimate mechanical properties of plaques can be used and evolved.
Finally, since we do not currently possess clinical data with desirable features and pressure information, clinical data for validation was not in the scope of this paper. In addition, computational phantoms have become a very solid tool, which are lexible tool, providing numerous investigations (Culjat et al., 2010). Accordingly, numerical phantoms were the most Figure 7. Computation of the impact of segmentation. (a) AR deformation computed using the gray level images, gold standards. (b) AR deformation computed using the corresponding segmented phantoms.
Rev. Bras. Eng. Bioméd., v. 30, n.2, p. 159-172, jun. 2014
Braz. J. Biom. Eng., 30(2), 159-172, June 2014
advantageous and feasible choice for the methodology evaluation. In addition, transducers with different properties may change the segmentation accuracy, since the main goal herein was to verify the two indexes equivalence, a wider analysis about the impact of segmentation depending on the transducer properties was not the scope of this paper. However, investigations using images acquired from physical phantom and clinical data, with desired coronary features and controlled parameters, will be designed and carried out with a cardiac center, and results presented in future works.
Acknowledgements
São Paulo Research Foundation – Brazil (FAPESP): Brazilian National Council of Scientific and Technological Development, (CNPq), Biomedical Engineering Laboratory of the University of São Paulo, Brazil (LEB-USP). Institute of Science and Technology of the Federal University of São Paulo, Brazil (ICT-UNIFESP).
References
Baldewsing RA, De Korte CL, Schaar JA, Mastik F, Van der Steen AFW. A inite element model for performing intravascular ultrasound Elastography of human atherosclerotic coronary arteries. Ultrasound in Medicine & Biology. 2004; 30(6):803-13. http://dx.doi.org/10.1016/j. ultrasmedbio.2004.04.005
Cardenas DAC, Moraes MC, Furuie SS. Segmentação do lúmen em imagens de IOCT usando Fuzzy Connectedness e Reconstrução Binária Morfológica. Revista Brasileira de Engenharia Biomédica. 2013; 29(1):32-44. http://dx.doi. org/10.4322/rbeb.2013.004
Cardoso FM, Moraes MC, Furuie SS. Realistic IVUS image generation in Different Intraluminal Pressures. Ultrasound in Medicine & Biology. 2012; 38(12):2104-19. http://dx.doi. org/10.1016/j.ultrasmedbio.2012.08.005
Céspedes EI, Ophir J, Ponnekanti H, Maklad N. Elastography: Elasticity imaging using ultrasound with application to muscle and breast in vivo. Ultrasonic Imaging. 1993; 15(2):73-88.
Choi CD, Skovoroda AR, Emelianov SY, O’Donnell M . An integrated compliant balloon ultrasound catheter for intravascular strain imaging. IEEE Transaction on Ultrasonics Ferroelectric and Frequency Control. 2002; 49(11):1552-60. http://dx.doi.org/10.1109/TUFFC.2002.1049737
Culjat MO, Goldenberg D, Tewari P, Singh RS. A review of tissue substitutes for ultrasound imaging. Ultrasound in Medicine & Biology. 2010; 36(6):861-73. http://dx.doi. org/10.1016/j.ultrasmedbio.2010.02.012
Davies MJ. The pathophysiology of acute coronary syndromes. Heart and Education in Heart. 2000; 83(3):361-6. http://dx.doi.org/10.1136/heart.83.3.361
Davies MJ. Stability and instability: two faces of coronary atherosclerosis. The Paul Dudley White lecture 1995. Circulation. 1996; 94(8):2013-20. http://dx.doi. org/10.1161/01.CIR.94.8.2013
De Korte CL, Van der Steen AFW. Intravascular ultrasound Elastography: an overview. Ultrasonics. 2002; 40:859-65. http://dx.doi.org/10.1016/S0041-624X(02)00227-5 De Korte CL, Céspedes EI, Van der Steen AFW. Inluence of catheter position on estimated strain in intravascular Elastography. IEEE Transaction on Ultrasonics, Ferroelectrics, and Frequency Control. 1999; 46(3):616-25. http://dx.doi. org/10.1109/58.764848
Falk E, Shah PK, Fuster V. Coronary plaque disruption. Circulation. 1995; 92:657-71. http://dx.doi.org/10.1161/01. CIR.92.3.657
Fisher A, Gustein DE, Fayad ZA, Fuster V. Predicting plaque rupture: enhancing diagnosis and clinical decision-making in coronary artery disease. Vascular Medicine. 2000; 5:163-72.
Hoskins PR. Simulation and validation of arterial ultrasound imaging and blood low. Ultrasound in Medicine & Biology. 2008; 34(5):693-17. http://dx.doi.org/10.1016/j. ultrasmedbio.2007.10.017
Le Floc’h S, Ohayon J, Tracqui P, Finet G, Gharib AM, Maurice RL, Cloutier G, Pettigrew RI. Vulnerable atherosclerotic plaque elasticity reconstruction based on a segmentation-driven optimization procedure using strain measurements: Theoretical framework. IEEE Transaction on Medical Imaging. 2009; 28(7):1126-37. http://dx.doi. org/10.1109/TMI.2009.2012852
Liang Y, Zhu H, Friedman MH. The correspondence between coronary arterial wall strain and histology in a porcine model of atherosclerosis. Physics in Medicine and Biology. 2009; 54(18):5625-41. http://dx.doi. org/10.1088/0031-9155/54/18/018
Loree HM, Tobias BJ, Gibson LJ, Kamm RD, Small DM, Lee RT. Mechanical properties of model atherosclerotic lesion lipid pools. Arteriosclerosis, Thrombosis, and Vascular Biology. 1994; 14(2):230-4. http://dx.doi.org/10.1161/01. ATV.14.2.230
Maurice RL, Brusseau E, Finet G, Cloutuer G. On the potential of the Lagrangian speckle model estimator to characterize atherosclerotic plaques in endovascular Elastography: in vitro experiments using an excised human carotid artery. Ultrasound in Medicine & Biology. 2005; 31(1):85-91. http:// dx.doi.org/10.1016/j.ultrasmedbio.2004.07.009
Moraes MC, Furuie SS. An approach to automatically segment the media-adventitia borders in IVUS. Revista Brasileira de Engenharia Biomédica. 2010; 26(3):219-33.
Moraes MC, Furuie SS. Automatic coronary wall segmentation in intravascular ultrasound images using binary morphological reconstruction. Ultrasound in Medicine & Biology. 2011; 37(9):1486-99. http://dx.doi.org/10.1016/j. ultrasmedbio.2011.05.018
Moraes MC, Cardoso FM, Furuie SS
Coronary Artery Disease. 2001; 12:655-63. http://dx.doi. org/10.1097/00019501-200112000-00009
Ophir J, Céspedes EI, Ponnekanti H, Yazdi Y, Li X. Elastography. A quantitative method for imaging the elasticity of biological tissues. Ultrasonic Imaging. 1991; 13(2):111-34.
Otsu N. A threshold selection method from gray-level histograms. IEEE Transaction on Systems, Man, and Cybernetics - Part C Applications and Reviews. 1979; 9(1):62-6. http://dx.doi.org/10.1109/TSMC.1979.4310076
Roger VL, Go AS, Lloyd-Jones DM, Benjamin EJ, Berry JD, Borden WB, Bravata Dawn M, Dai S, Ford ES, Fox CS, Fullerton HJ, Gillespie C, Hailpern SM, Heit JA, Howard VJ, Kissela BM, Kittner SJ, Lackland DT, Lichtman JH, Lisabeth LD, Makuc DM, Marcus GM, Marelli A, Matchar DB, Moy CS, Mozaffarian D, Mussolino ME, Nichol G, Paynter NP, Soliman EZ, Sorlie PD, Sotoodehnia N, Turan TN, Virani SS, Wong ND, Woo D, Turner MB. Executive summary: heart disease and stroke statistics - 2012 update: a report from the American Heart Association. http://dx.doi.org/10.1161/ CIR.0b013e3182456d46irculation. 2012; 125(1):188-97.
Rosamond W, Flegal K, Friday G, Furie K, Go A, Greenlund K, Haase N, Ho M, Howard V, Kissela B, Kittner S, Lloyd-Jones D, McDer-mott M, Meigs J, Moy C, Nichol G, O’Donnell CJ, Roger V, Rumsfeld J, Sorlie P, Steinberger J,
Thom T, Wasserthiel-Smoller S, Hong Y. Heart disease and stroke statistics - 2007 update: a report from the American Heart Association Statistics Committee and Stroke Statistics Subcommittee. Circulation. 2007; 115(5):e69-171. http:// dx.doi.org/10.1161/CIRCULATIONAHA.106.179918
Shapo BM, Crowe JR, Skovoroda AR, Eberle MJ, Cohn NA, O’Donnell M. Displacement and strain imaging of coronary arteries with intraluminal ultrasound. IEEE Transaction on Ultrasonics, Ferroelectrics, and Frequency Control. 1996; 43(2):234-46. http://dx.doi. org/10.1109/58.485949
Viermani R, Kolodgie FD, Burke AP, Farb A, Schwartz SM. Lessons from sudden coronary death: A comprehensive morphological classiication scheme for atherosclerotic lesions. Arteriosclerosis, Thrombosis, and Vascular Biology. 2000; 20:1262-75. http://dx.doi.org/10.1161/01. ATV.20.5.1262
Zienkiewicz OC, Taylor RL, Zhu JZ. The inite element method: its basis & fundamentals. 6th ed. Great Britain:
Elsevier; 2010a.
Zienkiewicz OC, Taylor RL, Zhu JZ. The inite element method: for solid and structural mechanics. 6th ed. Great
Britain: Elsevier; 2010b.
Authors
Matheus Cardoso Moraes*
Departamento de Ciência e Tecnologia, Instituto de Ciência e Tecnologia – ICT,
Universidade Federal de São Paulo – UNIFESP, Rua Talim, 330, CEP 12231-280, São José dos Campos, SP, Brasil.
Fernando Mitsuyama Cardoso, Sérgio Shiguemi Furuie
Laboratório de Engenharia Biomédica, Departamento de Engenharia de Telecomunicações e Controle, Escola Politécnica – Poli, Universidade de São Paulo – USP, São Paulo, SP, Brasil.
Rev. Bras. Eng. Bioméd., v. 30, n.2, p. 159-172, jun. 2014
Braz. J. Biom. Eng., 30(2), 159-172, June 2014