www.epjournal.net – 2011. 9(4): 600-621
¯ ¯ ¯ ¯ ¯ ¯ ¯ ¯ ¯ ¯ ¯ ¯ ¯ ¯ ¯ ¯ ¯ ¯ ¯ ¯ ¯ ¯ ¯ ¯ ¯ ¯ ¯ ¯
Original Article
More Men Run Relatively Fast in U.S. Road Races, 1981-2006: A Stable Sex
Difference in Non-Elite Runners
Robert O. Deaner, Department of Psychology, Grand Valley State University, Allendale, MI, USA. Email:
Don Mitchell, Anthropology Department, Buffalo State College, Buffalo, NY, USA.
Abstract: Recent studies indicate that more men than women run fast relative to
sex-specific world records and that this sex difference has been historically stable in elite U.S. runners. These findings have been hypothesized to reflect an evolved male predisposition for enduring competitiveness in “show-off” domains. The current study tests this hypothesis in non-elite runners by analyzing 342 road races that occurred from 1981-2006, most in or near Buffalo, NY. Both absolutely and as a percentage of same-sex finishers, more men ran relatively fast in most races. During the 1980s, as female participation surged, the difference in the absolute number of relatively fast men and women decreased. However, this difference was stable for races that occurred after 1993. Since then, in any given race, about three to four times as many men as women ran relatively fast. The stable sex difference in relative performance shown here for non-elites constitutes new support for the hypothesis of an evolved male predisposition for enduring competitiveness.
Keywords: motivation, competition, runners, gender difference, Title IX
¯ ¯ ¯ ¯ ¯ ¯ ¯ ¯ ¯ ¯ ¯ ¯ ¯ ¯ ¯ ¯ ¯ ¯ ¯ ¯ ¯ ¯ ¯ ¯ ¯ ¯ ¯ ¯ ¯ ¯ ¯ ¯ ¯ ¯ ¯ ¯ ¯ ¯ ¯ ¯ ¯ ¯ ¯ ¯ ¯ ¯ ¯ ¯ ¯ ¯ ¯ ¯ ¯ ¯ ¯ ¯ ¯ ¯ ¯ ¯ ¯ ¯ ¯ ¯ ¯ ¯ ¯ ¯ ¯ ¯ ¯ ¯ ¯ ¯ ¯ ¯ ¯ ¯ ¯ ¯ ¯ ¯ ¯ ¯ ¯ ¯ ¯ ¯
Introduction
Evolutionary Psychology – ISSN 1474-7049 – Volume 9(4). 2011. -601- regulated male advantages in aerobic capacity, muscular strength, and body fat deposition (Cheuvront et al., 2005; Joyner, 1993; Shephard, 2000).
Recently Deaner (2006a, 2006b, 2011; see also Frick, 2011) demonstrated a second kind of sex difference in running: In similar sized populations, substantially more men than women run fast relative to sex-specific world records or similar standards. For instance, in the 10,000 m run in 2005, 25 U.S. men recorded times that were less than 110% of the then-current male world record, whereas only six women performed within 110% of the corresponding female record (Track & Field News, 2006). This sex difference in performance depth—about two to four times as many men running relatively fast—was demonstrated in U.S. populations for all commonly contested distances, for Open (i.e., mainly professional), NCAA Division 1 collegiate, and high school runners. A similar pattern was shown in large U.S. road races that occurred in 2003 (Deaner, 2006b) and in international elite distance running events that occurred from 1973 to 2009 (Frick, 2011). The sex difference in performance depth is also indicated by the apparently “easier” female qualifying standards for elite competitions. For instance, the 2008 Olympic “A” qualifying standard for the marathon was 2:15:00 for men (10:33, 8.4% over then-current men’s world record) and 2:37:00 for women (21:35, 15.9% over then-current women’s world record; The XXIX Olympic Games, 2008).
In contrast to persistent sex differences in world records, there is no general consensus regarding the cause(s) of the sex difference in performance depth. Deaner (2006a, 2011) considered several possible explanations, however, and concluded that, at present, only one had empirical support, at least for distance running. This explanation is remarkably straightforward: More men are motivated to engage in the kind of dedicated, high-volume training that is necessary for fast running performances. Evidence for this conclusion comes from studies showing that the relations between training volume and relatively fast performances are highly similar in men and women (Deaner, Masters, Ogles, and LaCaille, 2011) and that men generally report greater training volumes (Callen, 1983; Clement, Taunton, Smart, and McNicol, 1981; Ogles, Masters, and Richardson, 1995; Running USA's State of the Sport 2010 – Part I, 2010).
Deaner (2011; see also Deaner, 2006a) further hypothesized that the apparent sex difference in motivation to train might reflect an evolved male predisposition for enduring competitiveness in display or “show-off” domains. More specifically, distance running may function as a reliable indicator of quality to potential mates, competitors, and allies, and enduring competitiveness may be necessary to best display one’s quality. Similar arguments have been put forth for sex differences in displays of food acquisition and the arts and sciences (Hawkes and Bliege Bird, 2002; Kanazawa, 2000, 2003; Miller, 1999, 2000).
only on elite runners (i.e., best or near-best performers in high school, collegiate, and professional populations).
It is therefore possible that substantial changes may have occurred among runners who are competitive but fall short of elite standards. This possibility seems especially worthy of exploration because the historical patterns of participation among U.S. running populations have been heterogeneous. In particular, in the past two decades the number of high school and collegiate male and female distance runners has increased by 30-100%, while the number of recreational road participants has increased by 60% for men and nearly 500% for women, a pattern which means that, at present, more women than men participate in road races (see Table 1).
Table 1. Increased male and female running participation in U.S., 1989-2009
Male Female
Population 1989 2009 % Increase 1989 2009 % Increase
Road Race Finishers 3,041 4,857 60 908 5,433 498
High School Cross-Country 156 231 49 105 198 89
High School Track & Field 406 558 38 309 458 48
NCAA Cross-Country 9 13 39 7 14 91
NCAA Track and Field 18 23 32 12 23 98
Note: Numbers refer to thousands. Individuals often finish more than one road race each year. Individuals often participate in both cross-country and track and field. Track and field refers to outdoor track and field; many schools offer indoor track and field but rosters are highly similar to outdoor track and field rosters, so these data were not presented. Road race data were from Running USA's State of the Sport 2010 - Part III (2010). High school data were from Participation Statistics (2011). NCAA data were from NCAA Research (2010). Some intercollegiate competition in the U.S. is governed the NAIA, but most schools and participants fall under the auspices of the NCAA, and no participation data were available from the NAIA.
The substantially greater increase in women’s road race participation in the U.S. might seem, prima facie, to falsify the claim of an evolved male predisposition for enduring competitiveness. This interpretation would be incorrect, however, because distance running participation does not automatically equate with distance running competitiveness. In fact, studies of distance running motivation have consistently found that most non-elite runners, both male and female, report little competitive inclination and instead run for a variety of other reasons (e.g., affiliation, health orientation, weight concern, life meaning; see Masters, Ogles, and Jolton, 1993; Ogles and Masters, 2003).
Evolutionary Psychology – ISSN 1474-7049 – Volume 9(4). 2011. -603- et al., 1981; Ogles et al., 1995; Running USA's State of the Sport 2010 – Part I, 2010), and most experts believe that distance runners cannot approach their true potential unless they are consistently running at least 100 km/wk (Berg, 2003; Noakes, 2001). Even given conservative assumptions, this would suggest that, at most, one-third of runners are maintaining sufficient training volumes to be optimizing their performance (Deaner, 2011). Third, estimations of the relation between relative running performance and training volume in recreational runners indicate that running roughly 75-100 km/wk (i.e., in a manner consistent with trying to approach one’s true potential) typically is associated with finishing within 125% of a sex-specific world-class standard (Deaner et al., 2011; see also Williams, 1998). Deaner (2006b) found that, across a sample of large road races, this standard was only achieved by 1-3% of male finishers and by fewer than 1% of female finishers.
These considerations suggest that the tremendous increase in female road race participation conceivably might have occurred without an increase in the number of fast female runners. This possibility would provide new support for Deaner’s hypothesis (2006a, 2011) of an evolved male predisposition for enduring competitiveness. By contrast, if the number of fast female runners in U.S. road races has substantially increased and now approaches or equals the number of fast males, this would support some kind of socialization hypothesis (e.g., Eagly and Wood, 1999), as well as claims that female athletic motivations are converging with (or are equivalent with) those of males (Dowling, 2000; McDonagh and Pappano, 2007; Messner, 2002). The current study tests these competing hypotheses by analyzing a sample of 342 road races that took place between 1981 and 2006.
Materials and Methods
Sample
The sample of races was taken from the archives of the second author who, for 25 years, operated a road race timing business (Runtime Services). Although this archive included roughly one thousand races, this study focused on 342 races that met two criteria. First, races must have had at least 40 male and 40 female finishers between the ages of 20 and 39 years. Runners outside this age range might require somewhat different standards, unnecessarily complicating our analysis (Deaner, 2006b). Thus, all analyses in this paper are based on runners in this age range. Second, races must have been part of an annual series, and data must have been available from at least three occurrences of the race.
The base of operations for the timing business was Buffalo, NY, USA. Most races in the sample occurred within 20 km of Buffalo, although some race series occurred substantially farther away. Eighteen races were included that occurred in Ontario, Canada, because the participants overlapped substantially with those who participated in the races in the nearby Buffalo area. Races of all distances were included, ranging from 5K (5 km) to the marathon. Appendix A lists the races included in the sample and summarizes their key characteristics.
showed a consistent yearly pattern of awarding substantial prize money (e.g., “money races” where winner receives > $500 or equivalent in non-monetary awards) were compared to similar race series that consistently did not (e.g., winner receives an apple pie or a trophy). Because information about prizes for individual races occurring many years ago generally was not available, we focused on seven race series where we had many years of data and that were known to consistently award substantial prizes or else were known not to do so. These seven race series included 152 of 322 races in our sample (47%). The classifications were made by the second author prior to analysis. The race series that were classified as consistently having large prizes were: Boilermaker 15K, Lilac 10K, Run for the Shamrocks 5 Mile, and Subaru Chase 4 Mile. The race series that were classified as consistently not providing large prizes were: J.Y. Cameron Buffalo Turkey Trot 8K, Nickel City 5K, and Old First Ward Shamrock Run 8K.
Measures of relatively fast performance
In calculating the relative performance of each finisher, the “10-Fastest” standard was generally used as the denominator or standard, rather than the world records. This was done because there is some evidence that world records may artificially inflate the sex difference in relative speed (Deaner, 2006a; see also Cheuvront et al., 2005; Seiler, De Koning, and Foster, 2007). The 10-Fastest standard was defined as the mean best time of the 10 fastest all-time performers at a distance, with only one performance counted per individual. Because only road races were analyzed in this study, only road race performances in calculating the 10-Fastest standard were used, not track times. These data were obtained from the Association of Road Racing Statisticians (All-Time Lists, n.d.) on 10 November 2010, although the lists had last been revised on 10 January 2010. To investigate the robustness of the results, some analyses were repeated using the fastest ever performance recorded at the distance in a road race (“world record”; All-Time Lists, n.d).
Because some race distances are infrequently contested, some 10-Fastest standards (and world records) indicated a slower mean speed than did the 10-Fastest standard of a longer but more frequently contested distance. For example, the 10-Fastest standard in the men’s half-marathon (21.098 km) is 5.98 m/sec, whereas the corresponding speed in the 10 mile (16.08 km) is 5.95 m/sec. In such cases, it can be safely assumed that the shorter distance standard would be at least as fast as the longer distance standard if it was contested frequently, and thus the 10-Fastest Standard (or world record) was calculated according to the speed of the longer race. The 10-Fastest standards and world records for all distances assessed in this study are presented in Appendix B.
Evolutionary Psychology – ISSN 1474-7049 – Volume 9(4). 2011. -605- measurement of relative male performance, which corresponds to about 15 seconds to each male 5 km performance or about 150 seconds to each male marathon performance. Not performing this adjustment would have resulted in slightly larger estimates of the sex difference in performance depth.
The authors initially tabulated the percentage of finishers running faster or equal to each succeeding 25% increment of the 10-Fastest standard, e.g., 100-125%, 126-150%, 151-175%, etc. However, the analyses presented below focused on finishers that ran ≤ 125% of the 10-Fastest standard because a previous study (Deaner, 2006b) indicated a sex difference was most pronounced there, among the fastest runners.
Measures of sex difference
Two measures of a potential sex difference in relative performance were considered, the first referred to as “percent-percent sex difference.” To obtain this, the authors initially calculated, for each race, the percentage sex difference in the percentage of male and female finishers that ran < 125% of the 10-Fastest standard. They then divided the larger number by the smaller one, subtracted one, and multiplied by 100. In cases where proportionally more men ran relatively fast, the percentage difference was scored as positive in sign, and if more women ran relatively fast the percentage difference was scored as negative in sign. For example, if, in a given race, 5% of female finishers achieved a performance of < 125%, whereas only 3% of male finishers did, the percent-percent sex difference would be -60%. If the percentage of relatively fast men and the percentage of fast women were identical, the race would have been assigned a value of 0; however, there were no such cases.
In 20 of the 342 races in the original sample (6%), there was not a single man or woman who achieved the < 125% 10-Fastest standard; these races were ignored in most analyses below. In 59 of the 342 races (18%), there was at least one man who achieved the ≤ 125% 10-Fastest standard but no woman who did so. To allow a meaningful comparison (i.e., division by zero is undefined), one hypothetical male and one hypothetical female fast finisher were “added” to the race. Because the number of male finishers was generally greater than the number of female finishers, this could substantially reduce the percentage sex difference (or potentially even reverse it); to address this issue, the one hypothetical male finisher was multiplied by the ratio of male to female finishers in the race, meaning that, in practice, the same (small) percentage of fast male and female finishers to each race was added to each. In 7 of the 342 races (2%), there was at least one woman who achieved the ≤ 125% 10-Fastest standard but no man who did so. In these cases, a hypothetical male and female finisher were again added; in this case the hypothetical woman was multiplied by the ratio of female to male finishers, a number usually less than one.
performance of < 125%, whereas 10 male finishers did, the percent-absolute sex difference would be 233%. In nine races, the number of relatively fast men and the number of relatively fast women were identical, and such races were assigned a value of 0.
The 20 races where no individuals achieved the < 125% 10-Fastest standard were generally ignored. For the races where at least one individual of one sex, but none of the other, achieved the < 125% 10-Fastest standard, a hypothetical male and female fast finisher were added to the race.
Analyses
Analyses were conducted using two-tailed statistical tests, and α was set at 0.05. All analyses were conducted with Statistica 6.1 (Statsoft Inc., Tulsa, OK USA). To test whether the percent-percent sex difference or the percent-absolute sex difference differed significantly from 0, one sample t-tests were employed. To examine the relationships between these measures of sex difference and other variables of interest (e.g., number of finishers, percent female finishers, race distance), linear multiple regression was used, rather than correlation, so that the effects of several potential predictors could be simultaneously assessed and the intercepts could be calculated. To better meet assumptions of normality, the number of finishers was log transformed prior to analysis.
Results
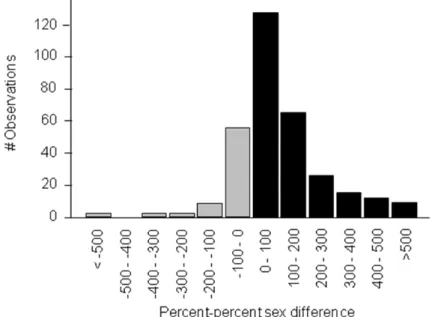
As predicted, in most races a higher percentage of men than women achieved or ran faster than the ≤ 125% 10-Fastest standard (see Figure 1). In particular, in the 322 races with at least one man or one woman achieving this standard, the male percentage was greater in 254 (79%) of the races. Even more dramatically, among these 322 races, 141 showed a sex difference of greater than 100%, and in 127 (90%) of these cases, there were more relatively fast men. The mean percent-percent sex difference for all 322 races was 99% and the median difference was 73%. This pattern departs significantly from zero,
Evolutionary Psychology – ISSN 1474-7049 – Volume 9(4). 2011. -607-
Figure 1. Histogram showing the frequency of percent-percent sex difference in 322 road
races
Note: Positive values (black bars) show cases where a greater
percentage of males ran relatively fast; negative values (gray bars) show cases where a greater percentage of females ran relatively fast.
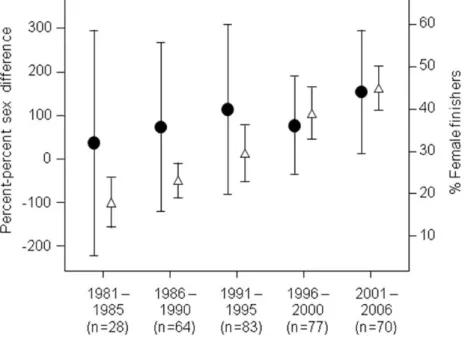
Although the greater percentage of relatively fast men is clear in this sample, this sex difference is somewhat smaller than reported in Deaner (2006b) where, across 40 large road races occurring in the U.S. in 2003, approximately two to four times (i.e., 100-300%) as many men as women ran relatively fast. To explore whether the comparatively modest sex difference found in the present sample reflects the increased participation of women over the past few decades (see Introduction), percent-percent sex difference was regressed on the percentage of finishers in the race that were female. As expected, the percentage of female finishers was a significant predictor (β = 0.24, R2 = 0.06, p < .0001), and the intercept indicated that there would be 170% more men than women running relatively fast in a given race if 50% of finishers were female. Figure 2 displays how, since 1981, the percentage of female finishers and the percent-percent sex difference both increased.
Figure 2. The relations between year and percent-percent sex difference (left ordinate) and percentage of female finishers (right ordinate)
Note: Filled circles indicate percent-percent sex difference; positive values indicate that a greater percentage of males ran relatively fast. Unfilled triangles indicate the percentage of female finishers. Error bars indicate one standard deviation of the mean.
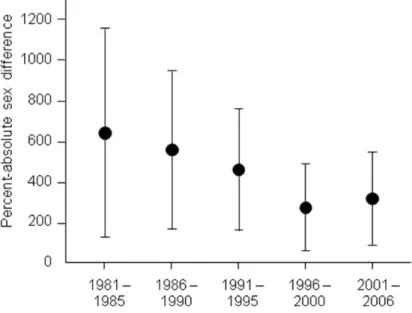
The percent-absolute sex difference decreased over all years in our sample (β = -0.36, R2 = 0.13, p < 0.0001). Nevertheless, visual inspection of scatterplots (not shown) indicated that this trend ended in the early 1990s. In fact, regressions using only races from the last 14 years (i.e., 1993-2006) or less revealed no significant decrease in this ratio (all ps > .14). Moreover, the regression coefficients were positive in sign for most years after 1996 (e.g., 1996-2006, 1997-2006). Figure 3 shows how the percent-absolute sex difference decreased from the 1980s to early 1990s and then stabilized.
Evolutionary Psychology – ISSN 1474-7049 – Volume 9(4). 2011. -609-
Figure 3. The relation between year and the percent-absolute sex difference
Note: Error bars indicate one standard deviation of the mean.
Alternative standards
One question that arises is the extent to which these results depend on the sex-specific relative standard employed. This issue was initially explored by repeating the previous analysis using world records. Results were highly similar: For the 312 races with at least one man and one woman meeting the < 125% world record standard, the mean percent-percent sex difference was 86%, and the median was 66%. Regression analysis indicated that, for this standard, there would 150% more men running relatively fast if there were the same number of male and female finishers. Similar results were obtained when considering the percent-absolute sex difference: The mean was 315% and the median was 208%. Regression analysis showed that when using world record standards, the percent-absolute sex difference decreased from 1980-2006 (β = -0.32, R2 = 0.10, p < 0.0001). However, there was no significant decrease after 1994.
standard, regression analysis indicated that there would be 128% more men than women running relatively fast if there were equal numbers of male and female finishers. With this standard, the percent-absolute sex difference decreased from 1980-2006 (β = -0.37, R2 = 0.13, p < 0.0001), but again there was no significant decrease after 1994. Thus, this study’s results appear robust to the sex-specific relative standard employed.
Non-elite competitors
Although the present results clearly show a sex difference in relative performance, one possibility is that this difference is limited to professional or elite runners (for a fuller discussion, see Deaner 2006b). This issue was addressed in two ways. First, four race series (85 races) which consistently awarded large prizes were compared to three other race series (67 races) which consistently did not. There was a substantial difference between these kinds of races in percent-percent sex difference, although it was the races that did not award substantial prizes where the sex difference was more pronounced (large prize races:
M = 60, SD = 101; small/no prize races: M = 211, SD = 199; t(150) = 6.1, p < .00001). The same pattern was obtained for percent-absolute sex difference (large prize: M = 384, SD = 262; small prize: M = 623, SD = 457; t(150) = 4.0, p < .00001). To explore whether this result might reflect some other difference between the prize and non-prize races, a general linear model was employed; offering large prizes was entered as a categorical predictor and year, log finishers, and percent female finishers were entered as continuous predictors. The large difference between prize and non-prize races was not substantially diminished for either measure of sex difference.
A second way this issue was addressed was by testing for sex differences among slower, yet still reasonably fast finishers, those in the > 125% but < 150% 10-Fastest standard grouping. Such performances generally require considerable training and talent, yet are far from elite. At least one man and one woman achieved this standard in all 342 races in Appendix B. The mean percent-percent sex difference was 41% (median = 32%), a pattern which differs significantly from zero, t(341) = 10.8, p < 0.0001. The percentage of female finishers was a significant predictor of the percent-percent sex difference (β = 0.26,
R2 = 0.07, p < .0001), and the intercept indicated that there would be 70% more men than women achieving this standard if 50% of finishers were female. The mean percent-absolute sex difference was 224% (median = 163%), which also differs significantly from zero,
t(341) = 14.5, p < 0.0001. Thus, the sex difference in relative performance holds even among runners who are indisputably non-elite.
Number of finishers
Another question is whether the greater percentage of relatively faster men is limited to races with either many or few finishers. To address this, we regressed percent- absolute sex difference on log number of finishers. We found there was a significant positive relation (β = 0.159, R2 = 0.03, p = .004), indicating that larger races tend to show a larger sex difference in relative performance. However, the regression equation indicated that even in a race with only 100 total finishers, there would be 310% more men than women running relatively fast.
Evolutionary Psychology – ISSN 1474-7049 – Volume 9(4). 2011. -611- weighting races by their number of finishers. We did this, considering every 80 finishers (our minimum for a race’s inclusion in the sample) as one case, and found that our key results remained largely unchanged: The mean percent-percent sex difference was 105% (compared to 99% unweighted); the mean percent-absolute sex difference for races occurring from 1993-2006 was 329% (335% unweighted); and the percent-absolute sex difference decreased over all years in our sample, but the relations weakened in the early 1990s and the regression coefficients were positive in the majority of years after 1996. Thus, our results were robust to the number of race finishers.
Discussion
The current study demonstrates that substantially more men than women run relatively fast in a sample of 342 U.S. road races that spans 26 years (1981-2006). It thus constitutes another line of evidence for the robustness of this phenomenon, which had previously been shown for elite runners (Deaner, 2006a, 2011; Frick, 2011) and in a sample of 40 U.S. road races occurring in 2003. In addition, the current study provides new insight into the increased popularity of distance running in the U.S. and many other nations (Gotaas, 2009; see also Deaner, 2011), especially among women in the 1990s and 2000s. Previous accounts of this so-called “2nd running boom,” have noted that many participants, both male and female, report little motivation to compete (Masters et al., 1993; Ogles and Masters, 2003). However, the present study provides the additional insight that massive increases in female participation (see Table 1) have not come close to eliminating the sex difference in relative performance: Since approximately 1993, in any given race, whether men substantially outnumbered women or whether there was approximate parity, there were typically three to four times as many men who ran relatively fast.
Before considering the explanations for these results, three issues regarding their robustness should be considered. First is whether the sex difference in relative performance could be an artifact of the 10-Fastest standard being somehow biased against women. In fact, this is not a major concern because the general results reported above were insensitive to the particular standards employed (i.e., 10-Fastest, world record, 13.2%), and similar patterns of robustness have been shown previously (Deaner, 2006a, 2006b). Moreover, the sex difference in relative performance phenomenon has been shown to exist entirely independent of sex-specific standards. In particular, within large populations of runners, the variability of the best male performances is reliably less than that of the comparable female performances, a pattern consistent with the idea that within any given population size, substantially fewer women than men engage in the kind of training needed to truly optimize performance (Deaner, 2006a; Frick, 2011).
races in the sample did not recruit or attract professionals, and analyses showed that the sex difference in races that do consistently award large prizes was substantially smaller than in races that did not, a pattern which flatly contradicts the claim that the results are mainly driven by professionals. Moreover, Deaner (2006b) reported the same pattern in large marathons. The fact that the sex difference in relative performance becomes accentuated in races that offer only recognition (i.e., status) for winning, rather than recognition and resources, supports a key prediction of the hypothesis that distance running is a kind of cultural display that serves to advertise male quality (Deaner, 2011).
A third issue is the representativeness of our sample, which was comprised of 342 road races occurring between 1981 and 2006, mostly in western New York. For two reasons, it is reasonable to expect that the present study’s results will generalize to other U.S. road races occurring during this time period. First, the increasing proportion of female runners in this sample (see Figure 1) parallels national trends (see Table 1). Second, the sex difference in relative depth found in this sample—about three to four times more relatively fast men in any given race—is highly similar to what was found in a sample of 40 large races that occurred in 2003 across the U.S. (Deaner, 2006b). Despite this evidence, it is certainly desirable that other researchers conduct additional studies of U.S. road races. Similar studies in other nations might be even more valuable.
In sum, the current study’s main result—that, among non-elite runners, relatively more men than women run fast in U.S. road races and this pattern, after decreasing in the 1980s and 1990s, has held stable for roughly 14 years—is likely to be reliable. The next section considers the various factors that might contribute to this sex difference in performance depth.
Proximate explanations for the sex difference
So why do more men run relatively fast in most U.S. road races? Achieving fast running performances undoubtedly requires talent, but another requirement is extended periods of consistent and demanding training, including the maintenance of running volumes of at least 100 km/wk (Berg, 2003; Midgley, McNaughton, and Jones, 2007; Noakes, 2001). There are several reasons to believe that a higher proportion of male than female runners engage in such training (reviewed in Deaner, 2011). First, male runners generally report greater competitiveness (Callen, 1983; Johnsgard, 1985; Ogles and Masters, 2003), and competitiveness is associated with maintaining larger running volumes (Masters et al., 1993; Ogles and Masters, 2000, 2003; Ogles et al., 1995). Second, the relations between training volume and relative performance are extremely similar in men and women, and there is no indication that training volume underestimates female performance (Deaner et al., 2011; see also Williams, 1998); thus, because more men are running relatively fast, more are probably maintaining high training volumes. Third, and most crucially, studies consistently find that, on average, men do report maintaining greater training volumes than do women (Clement et al., 1981; Callen, 1983; Ogles et al., 1995; Running USA's State of the Sport 2010 – Part I, 2010; for review, see Deaner, 2011).
Evolutionary Psychology – ISSN 1474-7049 – Volume 9(4). 2011. -613- constraint” hypotheses allow that there is a substantial sex difference in training but that this is due to some kind of inability or opportunity to train, rather than to a difference in motivation. For example, one possible training constraint hypothesis is that female runners might be more susceptible to injuries. The available data contradict this, however, because, once experience is controlled, there is no apparent sex difference in injury rates among runners (Macera, 1992; van Gent et al., 2007; van Mechelen, 1992). Deaner (2006a, 2006b, 2011) considers other alternative explanations for the sex difference in performance depth (e.g., sex-differentiated effects of exogenous anabolic steroids) and concludes that none have any substantial empirical support at present, although some warrant further investigation.
Ultimate explanations for the sex difference
So why would more men be motivated to engage in the dedicated, high-volume training necessary for fast running performances? Deaner (2006a, 2011) posited that this apparent sex difference in motivation could be viewed as a manifestation of sexual selection for male competitiveness. In this framework, men’s cultural displays in artistic, athletic, and scientific domains function to demonstrate a given man’s mental and behavioral talents relative to those of other men, and these displays thus serve as reliable indicators of quality to potential mates, competitors, and allies (Deaner, 2011; de Block and Dewitte, 2009; Kanazawa, 2000, 2003; Miller, 1999, 2000); although many display domains must have arisen fairly recently, men’s subsistence behavior in modern hunter-gatherer societies suggests that there were ample opportunities for display during the course of human evolution (Hawkes and Bliege Bird, 2002; Bliege Bird and Smith, 2005). These displays of male quality depend on both talent and enduring competitiveness, which can be defined as motivation to engage in dedicated training for an extended period to improve one’s performance in a domain (Deaner, 2011).
Although women may benefit by displaying their talents relative to those of other women, it is expected that they will be predisposed to do so in different ways than men, given the potential costs and benefits that would have prevailed during human evolutionary history (Campbell, 1999; Cashdan, 1996). In particular, whereas men’s long-term achievement motivation is expected to be greater in display or “show-off” domains, women’s long-term achievement motivation may be equal to (or greater than) men’s in domains more relevant to resource acquisition or its contemporary equivalents, such as school or job performance (Deaner, 2011).
However, it is exceedingly difficult to rule out alternative explanations for these sex differences, such as men enjoying greater achievement opportunities (Battersby, 1989; Miller, 1999; Russ, 1983).
Deaner (2011) argued that distance running is an ideal domain for making a strong claim for an evolved male predisposition for enduring competitiveness in “show-off” domains because alternative explanations for the sex difference in performance depth do not appear viable, at least in the U.S. For example, the argument that men enjoy greater opportunities to develop their running abilities seems implausible because running is a true meritocracy: No special equipment or facilities are necessary, and specialized training during youth is thought to be unhelpful (Greene and Pate, 2004). Another possible argument is that men have greater economic incentives to achieve in this domain. However, this argument also seems weak because men and women compete for similar shares of prize money at professional track and field meets and road races around the world (Prize Money, 2011), and there is no indication that open U.S. road races award men more prize money (personal observation, 2nd author). The only apparent difference in the U.S. is that among NCAA collegiate Division 1 and Division 2 runners, females receive 50% more athletic-related aid than do their male counterparts (NCAA Research, 2008). Finally, one might argue that perhaps distance running is more popular among men than women or is considered to be inappropriate for women. Participation data from the U.S. (see Table 1) contradict this, and studies of sport stereotyping conducted in several countries find that distance running is considered a gender-neutral activity (Italy: Lauriola, Zelli, Calcaterra, Cherubini, and Spinelli, 2004; Sweden: Koivula, 1995; U.S.: Matteo, 1986; U.K.: Colley, 1987).
In contrast to such explanations, the evolved male predisposition hypothesis apparently accounts for all aspects of the sex difference in performance depth. Perhaps most impressively, it predicts the stability of this sex difference in the U.S. among both elite (Deaner, 2006a, 2011) and non-elite runners (present study). This stability is especially remarkable given the well documented increases in opportunities and incentives for women in the U.S. beginning in the 1970s (Shulman and Bowen, 2001; U.S. Department of Education, 2003; Suggs, 2005; Stevenson, 2007). These increased opportunities and incentives have given rise to claims that girls’ and women’s interests and motivations in athletics are converging with those of men’s (Dowling, 2000; McDonagh and Pappano, 2007; Messner, 2002). However, it appears that the only empirical data bearing on such claims are the historical studies of the sex difference in relative running performance, which clearly contradict them.
Evolutionary Psychology – ISSN 1474-7049 – Volume 9(4). 2011. -615- Frick, 2011); they should explore possible sex differences in performance depth in other easily quantifiable athletic domains, such as swimming and biking; they should explore sex differences in enduring competitiveness in non-athletic domains, such as chess (de Bruin, Smits, Rikers, Henk, and Schmidt, 2008); and they should study the factors that affect individual decisions to pursue achievement in particular domains (e.g., Lubinski and Benbow, 2007).
The final point is that the ultimate benefit of studying sex differences in enduring competitiveness is not to dogmatically support an essentialist position (e.g., “Men, but not women, compete.”) The payoff, instead, should be insight into the various factors that affect long-term achievement motivation. The current study only considered gender, but Deaner (2011) highlighted how achievement motivation should be affected by whether achievement in the domain yields relatively greater status or resources, and other studies taking an evolutionary perspective have shown how achievement motivation can be affected by the prioritizing of mating or parenting (Kanazawa, 2003; Farrelly and Nettle, 2007; see also Ceci and Williams, 2010). As research better characterizes sex differences in motivation and how these interact with environmental and social conditions, it should be possible to craft policies to better achieve desirable outcomes, including policies that provide men and women with genuinely equal achievement opportunities (Ceci and Williams, 2010).
Acknowledgements: For helpful comments on previous drafts of this paper, the authors
thank Kevin R. Peters, William Rogers, and two anonymous reviewers.
Received 10 June 2011; Revision submitted 10 December 2011; Accepted 10 December 2011
References
All-Time Lists (n.d.). In Association of Road Racing Statisticians. Retrieved from
Battersby, C. (1989). Gender and genius. London: Women’s Press.
Berg, K. (2003). Endurance training and performance in runners: Research limitations and unanswered questions. Sports Medicine,33, 59-73.
Bliege Bird, R., and Smith, E. A. (2005). Signaling theory, strategic interaction, and symbolic capital. Current Anthropology,46, 221-248.
Callen, K. E. (1983). Mental and emotional aspects of long-distance running.
Psychosomatics,24, 133-151.
Campbell, A. (1999). Staying alive: Evolution, culture, and women’s intrasexual aggression. Behavioral and Brain Sciences,22, 203-252.
Cashdan, E. (1996). Women's mating strategies. Evolutionary Anthropology, 5, 134-143. Ceci, S. J., and Williams, W. M. (2010). The mathematics of sex: How biology and society
conspire to limit talented women and girls. New York: Oxford University Press. Cheuvront, S. N., Carter, R., Deruisseau, K. C., and Moffatt, R. J. (2005). Running
1017-1024.
Clement, D. B., Taunton, J. E., Smart, G. W., and McNicol, K. L. (1981). A survey of overuse running injuries. The Physician and Sportsmedicine,9, 47-58.
Coast, J. R., Blevins, J. S., and Wilson, B. A. (2004). Do gender differences in running performance disappear with distance? Canadian Journal of Applied Physiology,29, 139-145.
Colley, A. (1987). Attitudes to the female sex-role and sex-typing of physical activities.
International Journal of Sport Psychology, 18, 19-29.
Deaner, R. O. (2006a). More males run fast: A stable sex difference in competitiveness in U.S. distance runners. Evolution and Human Behavior, 27, 63-84.
Deaner, R. O. (2006b). More males run relatively fast in U.S. road races: Further evidence of a sex difference in competitiveness. Evolutionary Psychology,4, 303-314.
Deaner, R. O. (2011, May 13). Distance running as an ideal domain for demonstrating a sex difference in enduring competitiveness. Available at SSRN:
Deaner, R. O., Masters, K. S., Ogles, B. M., and LaCaille, R. A. (2011). Marathon performance as a predictor of competitiveness and training in men and women.
Journal of Sport Behavior, 34, 325-342.
de Block, A., and Dewitte, S. (2009). Darwinism and the cultural evolution of sports.
Perspectives in Biology and Medicine, 52, 1-16.
de Bruin A. B. H., Smits, N., Rikers, R. M. J. P., Henk, G., and Schmidt, H. G. (2008). Deliberate practice predicts performance over time in adolescent chess players and drop-outs: A linear mixed models analysis. British Journal of Psychology, 99, 473-497.
Dowling, C. (2000). The frailty myth. New York: Random House.
Eagly, A. H., and Wood, W. (1999). The origins of sex differences in human behavior: Evolved dispositions versus social roles. American Psychologist, 54, 408-423. Farrelly, D., and Nettle, D. (2007). Marriage affects competitive performance in male
tennis players. Journal of Evolutionary Psychology,5, 141-148.
Frick, B. (2011). Gender differences in competitiveness: Empirical evidence from professional distance running. Labour Economics, 18, 389-398.
Frietsch, R., Haller, I., Funken-Vrohlings, M., and Gruppa, H. (2009). Gender-specific patterns in patenting and publishing. Research Policy,38, 590–599.
Furlong, J. D. G., and Szreter, R. (1975). The trend of the performance differential between leading men and women athletes, 1951-1967. The Statistician,24, 115-128.
Gotaas, T. (2009). Running: A global history. London: Reaktion Books.
Greene, L., and Pate, R. (2004). Training for young distance runners (2nd ed). Champaign, IL: Human Kinetics.
Griskevicius, V., Cialdini, R. B., and Kenrick, D. T. (2006). Peacocks, Picasso, and parental investment: The effects of romantic motives on creativity. Journal of Personality and Social Psychology,91, 63-76.
Hawkes, K., and Bliege Bird, R. (2002). Showing off, handicap signaling, and the evolution of men's work. Evolutionary Anthropology, 11, 58-67.
Evolutionary Psychology – ISSN 1474-7049 – Volume 9(4). 2011. -617- intellectual domain. Journal of Biosocial Science,37, 371-380.
Johnsgard, K. (1985). The motivation of the long distance runner: I. Journal of Sports Medicine and Physical Fitness, 25, 135-139.
Jokl, E., and Jokl, P. (1968). The physiological basis of athletic records. Springfield, IL: Charles C Thomas.
Joyner, M. J. (1993). Physiological limiting factors and distance running: Influence of gender and age on record performances. Exercise and Sport Sciences Reviews, 21, 103-133.
Kanazawa, S. (2000). Scientific discoveries as cultural displays: A further test of Miller’s courtship model. Evolution and Human Behavior,21, 317-321.
Kanazawa, S. (2003). Why productivity fades with age: The crime–genius connection.Journal of Research in Personality,37, 257-272.
Koivula, N. (1995). Ratings of gender appropriateness of sports participation: Effects of gender-based schematic processing. Sex Roles,33, 543-557.
Lauriola, M., Zelli, A., Calcaterra, C., Cherubini, D., and Spinelli, D. (2004). Sport gender stereotypes in Italy. International Journal of Sport Psychology,35, 189-206.
Lubinski, D. S., and Benbow, C. P. (2007). Sex differences in personal attributes for the development of scientific expertise. In S. J. Ceci and W. M. Williams (Eds.), Why aren’t more women in science? Top researchers debate the evidence (pp. 79-100). Washington, DC: American Psychological Association.
Macera, C. A. (1992). Lower extremity injuries in runners: Advances in prediction. Sports Medicine, 13, 50-57.
Masters, K. S., Ogles, B. M., and Jolton, J. A. (1993). The development of an instrument to measure motivation for marathon running: The motivation of marathoners scales (MOMS). Research Quarterly for Exercise and Sport,64, 134-143.
Matteo, S. (1986). The effect of sex and gender-schematic processing on sport participation. Sex Roles,15, 417-432.
McDonagh, E., and Pappano, L. (2007). Playing with the boys: Why separate is not equal in sports. New York: Oxford University Press.
Messner, M. A. (2002). Taking the field: Women, men, and sports. Minneapolis, MN: University of Minnesota Press.
Midgley, A. W, McNaughton, L. R., and Jones, A. M. (2007). Training to enhance the physiological determinants of long-distance running performance? Can valid recommendations be given to runners and coaches based on current scientific knowledge? Sports Medicine,37, 857-880.
Miller, G. F. (1999). Sexual selection for cultural display. In R. Dunbar, C. Knight, and C. Power (Eds.), The evolution of culture: An interdisciplinary view (pp. 71-91). New Brunswick, NJ: Rutgers University Press.
Miller, G. F. (2000). The mating mind: How sexual choice shaped the evolution of human nature. New York: Doubleday.
NCAA Research. (2008). Gender equity: 2005-06 NCAA gender-equity report. Indianapolis, IN: National Collegiate Athletic Association.
Association.
Nettle, D., and Clegg, H. (2006). Schizotypy, creativity and mating success in humans.
Proceedings of the Royal Society of London B,273, 611-615.
Noakes, T. (2001). Lore of running (4th ed). Champaign, IL: Human Kinetics.
Ogles, B. M., and Masters, K. S. (2000). Older vs. younger adult male marathon runners: Participative motives and training habits. Journal of Sport Behavior,23, 130-142. Ogles, B. M., and Masters, K. S. (2003). A typology of marathon runners based on cluster
analysis of motivations. Journal of Sport Behavior,26, 69-85.
Ogles, B. M., Masters, K. S., and Richardson, S. A. (1995). Obligatory running and gender: An analysis of participative motives and training habits. International Journal of Sports Psychology,26, 233-248.
Participation Statistics (2011). In National Federation of State High School Associations.
Retrieved fro
Prize Money (2011, March 9). In Association of Road Racing Statisticians. Retrieved from
Ronay, R., and von Hippel, W. (2010). The presence of an attractive woman elevates testosterone and physical risk taking in young men. Social Psychological and Personality Science,1, 57-64.
Running USA's State of the Sport 2010 – Part I (2010, April 11). In Running USA.
Retrieved fro
Running USA's State of the Sport 2010 - Part III (2010, August 4). In Running USA.
Retrieved fro
Russ, J. (1983). How to suppress women’s writing. Austin, TX: U. Texas Press.
Seiler, S., De Koning, J. J., and Foster, C. (2007). The fall and rise of the gender difference in elite anaerobic performance 1952-2006. Medicine and Science in Sports and Exercise,39, 534-540.
Shephard, R. J. (2000). Exercise and training in women: Part I. Influence of gender on exercise and training responses. Canadian Journal of Applied Physiology, 25, 19-34.
Shulman, J. L., and Bowen, W. G. (2001). The game of life: College sports and educational values. Princeton, NJ: Princeton University Press.
Sparling, P. B., O' Donnell, E. M., and Snow, T. K. (1998). The gender difference in distance running has plateaued: An analysis of world rankings from 1980 to 1996.
Medicine andScience in Sports and Exercise, 30, 1725-1729.
Stevenson, B. (2007). Title IX and the evolution of high school sports. Contemporary Economic Policy,25, 486-505.
Suggs, W. (2005). A place on the team: The triumph and tragedy of Title IX. Princeton, NJ: Princeton University Press.
The XXIX Olympic Games (2008, February 5). In IAAF. Retrieved from
Track & Field News (2006). 2005 World/U.S. Lists. Track & Field News, January, 30-54. U.S. Department of Education. (2003). Open to all: Title IX at thirty. Washington, DC:
Evolutionary Psychology – ISSN 1474-7049 – Volume 9(4). 2011. -619- Koes, B. W., and Taunton, J. E. (2007). Incidence and determinants of lower extremity running injuries in long distance runners: A systematic review. British Journal of Sports Medicine,41, 469-480.
van Mechelen, W. (1992). Running injuries: A review of the epidemiological literature.
Sports Medicine,14, 320-355.
Whipp, B.J., and Ward, S.A. (1992). Will women soon outrun men? Nature,355, 25. Williams, P. T. (1998). Relationships of heart disease risk factors to exercise quantity and
intensity. Archives of Internal Medicine,158, 237-245.
Appendix A. Race Sample and Key Characteristics
Mean Mean Mean Name, Distance, & Location Years Years
with data Finishers M:F % Sex difference Around the Bay 30K
Hamilton, ONTa 86-94 8 638 4.1 0.38
Boilermaker 15K
Utica, NYb 85-06 22 3022 2.3 0.26
Buffalo Marathon (42.195K)
Buffalo, NY 89-98, 01-05 2 353 3.2 -1.47
Buffalo State College Bengal Run 5K
Buffalo, NY
98-00, 03-04 0 - - -
Depew-Lancaster Boys Club 10K
Lancaster, NY
83, 85-88, 92-06 12 255 3.0 -0.17
Erie County Fair 5K
Hamburg, NY 98-04 3 171 1.3 -0.52
Fisher-Price 5K
East Aurora, NY 95-00, 01-03 2 214 1.2 1.15 Hamburg Bun Run 5K
Hamburg, NY 88, 90-92, 94-95 2 207 2.7 0.07 Heart Run 5K
Amherst, NY 91-95 0 - - -
Hillside Run for Kids 5 Mile (8.04K)
Rochester, NYa
91-98 8 374 2.4 0.63
J.Y. Cameron Buffalo Turkey Trot 8K
Buffalo, NY
Lebros Fall Classic 5K
Amherst, NY 90-94 3 286 2.2 0.00
Lilac 10K
Rochester, NYa 82, 84-97, 99-04 21 1021 2.5 0.55 Linda Yalem 5K
Buffalo, NY 91-97, 99-04 10 523 1.1 2.07
N.F. YMCA Festival of Lights 5K
Niagara Falls, NY
95-00 2 188 1.5 0.53
Nickel City 5K
Buffalo, NY 86-04 17 755 1.7 1.87
Old First Ward Shamrock Run 8K
Buffalo, NY
84-06 22 1139 2.2 2.31
Pit Run 10K
Oneonta, NYb 99-02 2 274 1.2 0.85
Police Chase 5K
Buffalo, NY 87-04 14 226 2.0 1.39
Praxair 10K
Tonawanda, NY 92-97 6 207 2.8 0.56
Run for Hospice 10 Mile (16.08K)
Rochester, NYa
02-04 1 130 1.2 1.69
Run for Grapes 10 Mile (16.08K)
St. Catharines, ONTa
84-88, 98 5 311 3.9 -0.08
Run for Grapes 5K
St. Catharines, ONTa 92-99 5 299 1.5 1.75 Run for Shamrocks 5 Mile
(8.04K) Rochester, NYa
85-97, 00-05 17 520 2.6 1.02
Sallie Mae 10K
Washington, DCb 95-02, 04 9 975 1.2 0.75 Skylon International Marathon
(42.195K) Buffalo, NY
81-86 2 666 8.2 0.04
St. Gregory the Great 5K
Williamsville, NY 96-04 3 399 1.2 0.79
Subaru Chase 4 Mile (6.44K)
Evolutionary Psychology – ISSN 1474-7049 – Volume 9(4). 2011. -621- WBEN Run for Your Life 20K
Buffalo, NY 82-84, 86-90 5 304 4.8 -4.56
Wegmans 5K
Rochester, NYa 93-95 3 576 2.3 0.07
Note: Data on years with data, finishers, m:f ratio, and percentage sex difference are based only on races where at least 1 male and 1 female achieved the < 125% 10-Fastest standard. a50-120km from Buffalo;
b
>300km from Buffalo. For definition of % sex difference, see Methods.
Appendix B. 10-Fastest and World Record Gender-specific Standards
10-Fastest World Best
Distance Male Female % Difference Male Female % Difference
5K 13:13.8 14:52.2 12.4 12:59.5 14:46 13.7
4 mile
(6.44K) 17:28.1 19:46.4
a
13.2 17:07 19:28 13.7 8K 21:47.9 24:34.5 12.7 21:36 24:16.56a 12.4
10K 27:14.9 30:43.1 12.7 27:01 30:20.7 12.4 15K 41:55.9a 47:21.7 13.0 41:28.8a 46:27.7 12.0 10 mile
(16.08K) 44:57
a
50:52.5a 13.2 44:23a 50:02.66a 12.8 20K 55:24.5a 1:03:16.6a 13.2 55:02.1 1:02:14.6a 12.1 Half marathon
(21.098K) 58:58.6 1:06:45 13.2 58:35 1:05:39.6 12.1 30K 1:28:45.9a 1:37:57.9a 11.5 1:28:00 1:36:16.4a 9.4 Marathon
(42.195K) 2:04:50.9 2:19:11.7 11.5 2:03:58.2 2:15:24.6 9.2