Submitted 19 December 2014
Accepted 26 October 2015
Published7 December 2015
Corresponding author Annalisa Setti, [email protected]
Academic editor Stephen Macknik
Additional Information and Declarations can be found on page 11
DOI10.7717/peerj.1407
Copyright 2015 Setti et al.
Distributed under
Creative Commons CC-BY 4.0
OPEN ACCESS
Trail Making Test performance
contributes to subjective judgment of
visual e
ffi
ciency in older adults
Annalisa Setti1,2, James Loughman3,4, George M. Savva1and RoseAnne Kenny1,5
1The Irish Longitudinal Study on Ageing (TILDA), Trinity College Dublin, Dublin, Ireland 2School of Applied Psychology, University College Cork, Cork, Ireland
3Optometry Department, College of Sciences and Health, Dublin Institute of Technology, Dublin, Ireland
4African Vision Research Institute, Faculty of Sciences and Health, University of KwaZulu Natal, Durban, South Africa
5Mercer’s Institute for Successful Ageing, St. James Hospital, Dublin, Ireland
ABSTRACT
Introduction.The determinant factors that influence self-reported quality of vision have yet to be fully elucidated. This study evaluated a range of contextual information, established psychophysical tests, and in particular, a series of cognitive tests as potentially novel determinant factors.
Materials & Methods.Community dwelling adults (aged 50+) recruited to Wave 1 of The Irish Longitudinal Study on Ageing, excluding those registered blind, participated in this study (N=5,021). Self-reports of vision were analysed in relation
to visual acuity and contrast sensitivity, ocular pathology, visual (Choice Response Time task; Trail Making Test) and global cognition. Contextual factors such as having visited an optometrist and wearing glasses were also considered. Ordinal logistic regression was used to determine univariate and multivariate associations.
Results and Discussion. Poor Trail Making Test performance (Odds ratio,
OR=1.36), visual acuity (OR=1.72) and ocular pathology (OR=2.25) were
determinant factors for poor versus excellent vision in self-reports. Education, wealth, age, depressive symptoms and general cognitive fitness also contributed to determining self-reported vision.
Conclusions.Trail Making Test contribution to self-reports may capture higher level visual processing and should be considered when using self-reports to assess vision and its role in cognitive and functional health.
Subjects Epidemiology, Ophthalmology, Psychiatry and Psychology
Keywords Self-report, Visual acuity, Ocular pathology, Trail making test, Visual search
INTRODUCTION
Many subjective psychological constructs have been shown to have a number of objective underlying determining factors. Self reported memory is a clear example, in so much that it has been argued that other psychological aspects such as depression and personality could
be more linked to self reports of memory than memory itself (Abdulrab & Heun, 2008).
In the present work, we analyzed another psychological construct, self reported vision,
assessed by a simple question “How would you rate your vision? Excellent, Very good, Good, Fair or Poor?” and investigated the contribution of cognitive factors to this construct in a large sample of individuals aged 50 and over.
Although self reported vision is clearly associated with visual acuity, it is also clear that the answer to one simple question on one’s own visual ability can be largely dependent on factors other than visual acuity. The specific factor investigated here was visual processing, assessed by the Choice Response Time task and the Trail Making Test tasks. Whether impairment in visual processing can be captured by subjective reports of poor vision independently from global cognitive impairments and lower level acuity impairment (more related to optical factors) remains to be determined and could contribute in explaining why some individuals with good visual acuity report poorer vision and vice versa. In the domain of hearing, extensive work has been devoted to central presbycusis showing that specific hearing deficits linked to central hearing processing may exist independently both from peripheral deficits and central cognitive deficits, and can be captured in the subjective experience of individuals with poor hearing (Humes et al., 2012).
With ageing, the relationship between sensory efficiency and cognitive performance
becomes closer (Lindenberger & Baltes, 1994;Lindenberger & Ghisletta, 2009) and self reports of vision are predictive in terms of negative cognitive outcomes such as dementia (Rogers & Langa, 2010). While it is established that visual acuity is not the only determinant of self reported vision (Rubin et al., 2001), it is necessary to understand what factors underlie it. Among these factors, arguably, the least investigated is the cognitive dimension, while greater emphasis has been given to objective visual measures such as visual acuity (Klein et al., 1999;Rubin et al., 2001), use of vision to accomplish daily tasks (e.g.,Fors, Thorslund & Parker, 2006;Kempen et al., 1996;Rubin et al., 2001;Rubin et al., 2007), and socio-demographic factors (El-Gasim et al., 2012;Klein et al., 1999;Rubin et al., 2001).
Among cognitive factors, previous studies have investigated intelligence (Kempen et
al., 1996) and global cognitive status (Hidalgo et al., 2009), but their results are limited by the impossibility of jointly controlling for a range of confounding factors known to influence self reports, such as socio-economic status, depression, or global health status (e.g.,Dufouil, Fuhrer & Alp´erovitch, 2005;Ponds, Van Boxtel & Jolles, 2000) which we can control for in the present study. Importantly to our aim, whether specific cognitive tasks requiring visual processing are associated with self reported vision at a population level has not been studied, despite the fact that self reports are used in different epidemiological studies (e.g., the English Longitudinal Study on Ageing, UK and the Health and Retirement Study, USA). Further our understanding of the underlying cognitive factors to self reported vision could also inform the use of self reports in clinical settings, where knowing the validity of a simple question could inform on the need for further assessments that
go beyond a visual acuity test (Table S1provides an overview of studies including
socio-demographic and cognitive determinants of self reported vision).
Measures of visual processing differ from traditional psychophysical measures such as
level. Modifications occurring in the visual cortex, as well as more generally in the functional organisation of visual processing, could, therefore, be responsible for age
related changes in visual function (Cabeza et al., 1997;Grady, 2008) not explained
by psychophysical measures such as visual acuity and contrast sensitivity and could potentially be captured by self-reports. In fact, one of the most notable changes in cognitive ageing is the decline in visual processing speed that is also a marker of cognitive decline and brain dysfunction (Salthouse, 1996;Salthouse et al., 1996). Visual search is also one of the domains of visual processing that deteriorates with ageing in a manner that relates
to visual attention decline (Madden, 2007). The natural decline in visual processing has
a number of consequences on the ability to perform daily living tasks such as navigating the environment (including the possibility of suffering a fall) (Anstey et al., 2009), looking for a particular object or a person among others (Sekuler & Ball, 1986) and driving (Ball et al., 2006). These processes also mediate the successful training of visual capacities to improve daily living activities (Ball, Edwards & Ross, 2007;Edwards et al., 2013) and could, therefore, impact self perceived quality of vision. In the present study we assessed visual processing speed by the Choice Response Time Task, a specifically devised task based on the vast literature on processing speed tasks (seeSalthouse, 1991), and visual search and
attention as assessed by the Trail Making Test, a commonly used neurocognitive test (D’Elia
et al., 1996). This test was selected on the basis that visual search, scanning and visual attention are engaged in this task (Sanchez-Cubillo et al., 2009). However it differs from typical visual search tasks in which a target present/target absent response is required and the features and number of distracters are manipulated (Treisman & Gelade, 1980;Wolfe,
1998). Working memory and planning are strongly involved in this task, as well as a motor
component which is usually absent in visual search tasks (Sanchez-Cubillo et al., 2009). A number of other factors need to be controlled for that may determine self reported vision: eye disease is common in older adults, and can result in substantial visual loss
not captured by visual acuity tests (Charalampidou et al., 2011); the awareness of a
visual problem could potentially be linked to the frequency of attendance for eye health examination, which should be accounted for. These vision-related factors were controlled for in the present study (see ‘Method’). In addition socio-demographic and general physical and mental health factors, as well as global cognitive status were accounted for as they could co-determine the self reports (e.g.,Hidalgo et al., 2009).
MATERIALS & METHODS
Sample
Data from the first wave of the nationally representative Irish Longitudinal Study on
Ageing (TILDA) were used for this study (N =8,175 aged 50 years and older). The
recruitment and sampling method has been described elsewhere (Kearney et al., 2011).
Ethical approval was obtained from the Trinity College Dublin research ethics committee, and all participants provided written informed consent in accordance with the Declaration of Helsinki.
All participants completed a Computer Assisted Personal Interview (CAPI) in their own home, and each was then invited to a complete health assessment (Kearney et al., 2011). For the purpose of this study, only participants who attended the health assessment centre were
included (N =5,026; 2,304 male). The time delay between the CAPI interview and the
health assessment was approximately three months. The question relating to self-reported visual acuity was asked in the CAPI, the cognitive tasks utilized in this study as well as the visual acuity and contrast sensitivity tests were administered in the health assessment. Those respondents who reported themselves as registered blind (legally defined as visual acuity less than LogMAR 1.0 (6/60) or visual field less than 20◦) were also excluded from all
the analyses (N=5, 0.1% of the sample). The total sample size, therefore, included in the
current study wasN=5,021 (2,299 male).
Outcome variable
Self Reported Vision (SRV) was assessed during the CAPI with the following question: “Is your eyesight (using glasses or contact lenses if you need them). . .excellent, very good,
good, fair, poor, registered blind”. Those who reported themselves as ‘registered blind’ were not included in the study yielding a five point ordered scale for SRV.
Predictor variables
Choice Reaction Time (CRT) test: the CRT is a computer based test, and was administered at the health assessment according to a Standard Operating Procedure. The task consisted of three phases: maintaining the starting button press; releasing the button at the appearance of the target stimulus (words “yes” or “no”) on the computer screen (cognitive speed), and finally, pressing the button corresponding to “yes” or “no” on the button-box (motor speed). Instructions emphasized accuracy as well as speed. Response times from target onset to the release of the starting button indicated the ‘cognitive’ (decision) time and the time taken to press the ‘yes’ or ‘no’ button was taken as ‘motor’ response time.
Trail Making Tests
In TILDA, the Trail Making Test (TMT) utilized is the colour version, which is considered less biased by literacy and cultural differences (D’Elia et al., 1996). The task is administered in two versions, the first is simpler, requiring to draw a line between consecutive numbers (1–25) distributed on a sheet of paper (TMT1), and the second is more complex, requiring
to draw a line alternating between numbers of two different colours (TMT2). This test
Covariates
Visual acuity was measured monocularly during the health assessment using a LogMAR chart, and ETDRS letterset, at a test distance of four meters under photopic illumination conditions. Subjects were required, using their habitual refractive correction where applicable, to identify the letters presented on the chart in decreasing size (0.1 log unit decrease in size between lines). Visual acuity was recorded as the smallest line of letters accurately identified, accounting for any incorrectly identified letters on this line (each line consisted of five letters, each assigned a value of 0.02 log units, such that if a subject, for example, correctly identified four letters of the LogMAR 0.1 line, and incorrectly identified one letter, the final acuity was recorded as 0.12). For the present study visual acuity in the best performing eye was considered.
Contrast sensitivity (CS) was measured monocularly, with distance spectacles worn
(where appropriate), using the Functional Vision AnalyserTM(FVA; Stereo Optical Co.,
Inc—Chicago, USA). For the methodology seeLoughman et al. (2012). Testing was
performed under mesopic (3 cd/m2) background illumination conditions.
Covariates considered in this study were vision-related factors such as ocular pathology and ophthalmology/optometrist visits and other covariates related to demographic factors and physical and psychological health.
Eye disease was self reported during the CAPI interview. Respondents were asked to indicate the nature of any existing doctor-confirmed diagnosis of eye disease. Subjects were additionally asked to provide information in relation to their habitual use of spectacles or contact lenses, and visits to an optometrist.
Other covariates considered in this study were: age, sex, education, health (chronic conditions), wealth (based on house value), all of which were self-reported; hypertension (seating position systolic blood pressure>140 ml mercury or diastolic>90 ml mercury)
and depression (Centre for Epidemiological Studies Depression Scale, CES-D), all of which were measured during the health centre visit. Global cognitive status was assessed by the Montreal Cognitive Assessment, (MoCA), a widely used neurocognitive assessment. For the purpose of the present work we excluded the visual items to avoid a bias against
individuals with poor vision onto the overall cognitive assessment (seeCronin-Golomb et
al., 2007).Table S2summarises the variables utilized.
Statistical analysis
Ordinal logistic regression was used to investigate the association between the variables of interest (CRT and TMT) and the outcome variable (self-report of vision on a five point Likert scale). Ordinal logistic regression yields odds ratios that can be interpreted in the same way as for binary logistic regression, but irrespective of the dichotomization of the outcome variable. The ‘proportional odds’ assumption is therefore key; this is the assumption that ORs generated by the ordinal regression are applicable across the whole of the response range of the outcome. Each of our variables of interest passed a ‘Brant’
test for proportional odds (Brant, 1990) (using the ‘brant’ command in Stata) and so this
assumption was met. Univariate odds ratios were estimated for each predictor, as well as odds ratios adjusted for all covariates and other predictors.
Inverse probability weights were estimated and applied to all analyses to ensure that results based on the sample included in the current analysis were applicable to the community living middle aged and older population of Ireland. Statistical analyses were performed using STATA version 12 (StataCorp LP, College Station, TX).
RESULTS & DISCUSSION
Using the legal (visual acuity based) definition of visual impairment (corrected visual acuity<20/40 or>0.3 LogMar) as a proxy indicator of good (equal or better than 0.3)
versus poor (worse than 0.3) visual acuity, 89.8% of participants who reported good vision (excellent to good) had good visual acuity, while the remaining 10.2% demonstrated poor visual acuity. Among respondents rating their vision as poor, only 22.4% showed impaired visual acuity.
Considering the exclusion of participants presenting missing values on at least one of the variables of interest or covariates, the total sample entered into the final model was
N=4,178 (1,937 male), of which, 292 individuals (7%) reported fair or poor vision.
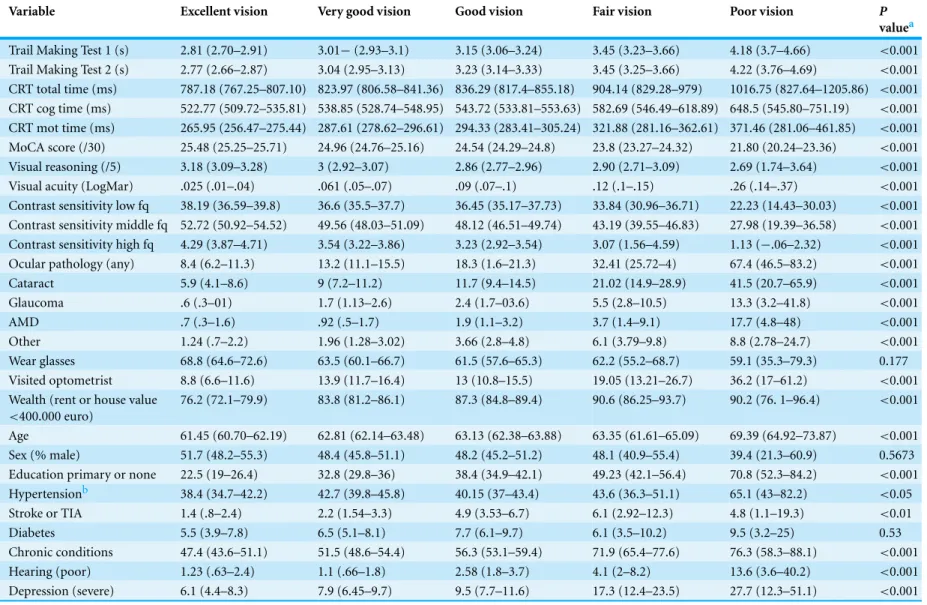
The descriptive statistics of the sample are presented inTable 1.
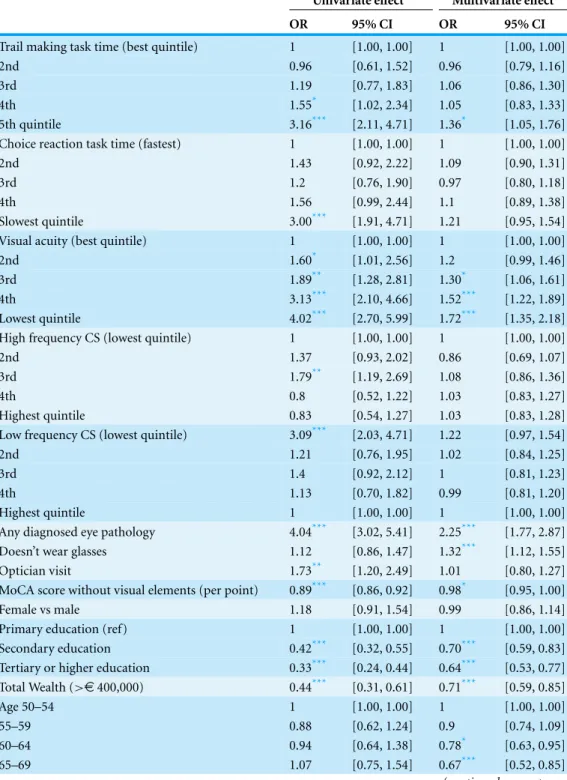
The odd ratios for the association between each predictor variable and poor SRV are shown inTable 2.
There was initial evidence that poor processing speed as measured by CRT indepen-dently influenced SRV, but this was not statistically significant (O.R.=1.21;p>0.05 for
poorest compared to best quintile). There was a dose–response relationship between slow TMT and SRV in univariate analysis. After adjusting for all other factors, those participants with visual search times in the slowest quintile had poorer SRV (OR=1.36;p<0.05).
It is worth noting that the question on SRV was answered several weeks before the health assessment, therefore, carry-on effects from the cognitive tasks to the self-reports can be likely excluded.
As expected there was a gradient in SRV with worsening visual acuity, with odds
ratio of 1.72 for lowest quintile (corresponding to LogMar mean=.345, standard
deviation=.153) compared to the highest quintile (LogMar mean−.131, standard
de-viation=.054). The univariate effect of low-frequency CS (OR=3.1;p<0.01 for poorest
compared to highest quintile) was almost completely explained by confounding factors in the fully adjusted model. High frequency CS was not related to SRV independently of visual function.
As to other vision-related covariates, eye disease was associated with self reporting poor vision (OR=2.25,p<0.001) not wearing glasses had a small but significant impact in
increasing the odds of poor SRV (OR=1.32;p<0.001).
Table 1 Characteristics of the sample (N=4,178 weighted to represent the population).
Variable Excellent vision Very good vision Good vision Fair vision Poor vision P
valuea
Trail Making Test 1 (s) 2.81 (2.70–2.91) 3.01−(2.93–3.1) 3.15 (3.06–3.24) 3.45 (3.23–3.66) 4.18 (3.7–4.66) <0.001
Trail Making Test 2 (s) 2.77 (2.66–2.87) 3.04 (2.95–3.13) 3.23 (3.14–3.33) 3.45 (3.25–3.66) 4.22 (3.76–4.69) <0.001
CRT total time (ms) 787.18 (767.25–807.10) 823.97 (806.58–841.36) 836.29 (817.4–855.18) 904.14 (829.28–979) 1016.75 (827.64–1205.86) <0.001
CRT cog time (ms) 522.77 (509.72–535.81) 538.85 (528.74–548.95) 543.72 (533.81–553.63) 582.69 (546.49–618.89) 648.5 (545.80–751.19) <0.001
CRT mot time (ms) 265.95 (256.47–275.44) 287.61 (278.62–296.61) 294.33 (283.41–305.24) 321.88 (281.16–362.61) 371.46 (281.06–461.85) <0.001
MoCA score (/30) 25.48 (25.25–25.71) 24.96 (24.76–25.16) 24.54 (24.29–24.8) 23.8 (23.27–24.32) 21.80 (20.24–23.36) <0.001
Visual reasoning (/5) 3.18 (3.09–3.28) 3 (2.92–3.07) 2.86 (2.77–2.96) 2.90 (2.71–3.09) 2.69 (1.74–3.64) <0.001
Visual acuity (LogMar) .025 (.01–.04) .061 (.05–.07) .09 (.07–.1) .12 (.1–.15) .26 (.14–.37) <0.001
Contrast sensitivity low fq 38.19 (36.59–39.8) 36.6 (35.5–37.7) 36.45 (35.17–37.73) 33.84 (30.96–36.71) 22.23 (14.43–30.03) <0.001
Contrast sensitivity middle fq 52.72 (50.92–54.52) 49.56 (48.03–51.09) 48.12 (46.51–49.74) 43.19 (39.55–46.83) 27.98 (19.39–36.58) <0.001
Contrast sensitivity high fq 4.29 (3.87–4.71) 3.54 (3.22–3.86) 3.23 (2.92–3.54) 3.07 (1.56–4.59) 1.13 (−.06–2.32) <0.001
Ocular pathology (any) 8.4 (6.2–11.3) 13.2 (11.1–15.5) 18.3 (1.6–21.3) 32.41 (25.72–4) 67.4 (46.5–83.2) <0.001
Cataract 5.9 (4.1–8.6) 9 (7.2–11.2) 11.7 (9.4–14.5) 21.02 (14.9–28.9) 41.5 (20.7–65.9) <0.001
Glaucoma .6 (.3–01) 1.7 (1.13–2.6) 2.4 (1.7–03.6) 5.5 (2.8–10.5) 13.3 (3.2–41.8) <0.001
AMD .7 (.3–1.6) .92 (.5–1.7) 1.9 (1.1–3.2) 3.7 (1.4–9.1) 17.7 (4.8–48) <0.001
Other 1.24 (.7–2.2) 1.96 (1.28–3.02) 3.66 (2.8–4.8) 6.1 (3.79–9.8) 8.8 (2.78–24.7) <0.001
Wear glasses 68.8 (64.6–72.6) 63.5 (60.1–66.7) 61.5 (57.6–65.3) 62.2 (55.2–68.7) 59.1 (35.3–79.3) 0.177
Visited optometrist 8.8 (6.6–11.6) 13.9 (11.7–16.4) 13 (10.8–15.5) 19.05 (13.21–26.7) 36.2 (17–61.2) <0.001
Wealth (rent or house value
<400.000 euro)
76.2 (72.1–79.9) 83.8 (81.2–86.1) 87.3 (84.8–89.4) 90.6 (86.25–93.7) 90.2 (76. 1–96.4) <0.001
Age 61.45 (60.70–62.19) 62.81 (62.14–63.48) 63.13 (62.38–63.88) 63.35 (61.61–65.09) 69.39 (64.92–73.87) <0.001
Sex (% male) 51.7 (48.2–55.3) 48.4 (45.8–51.1) 48.2 (45.2–51.2) 48.1 (40.9–55.4) 39.4 (21.3–60.9) 0.5673
Education primary or none 22.5 (19–26.4) 32.8 (29.8–36) 38.4 (34.9–42.1) 49.23 (42.1–56.4) 70.8 (52.3–84.2) <0.001
Hypertensionb 38.4 (34.7–42.2) 42.7 (39.8–45.8) 40.15 (37–43.4) 43.6 (36.3–51.1) 65.1 (43–82.2) <0.05
Stroke or TIA 1.4 (.8–2.4) 2.2 (1.54–3.3) 4.9 (3.53–6.7) 6.1 (2.92–12.3) 4.8 (1.1–19.3) <0.01
Diabetes 5.5 (3.9–7.8) 6.5 (5.1–8.1) 7.7 (6.1–9.7) 6.1 (3.5–10.2) 9.5 (3.2–25) 0.53
Chronic conditions 47.4 (43.6–51.1) 51.5 (48.6–54.4) 56.3 (53.1–59.4) 71.9 (65.4–77.6) 76.3 (58.3–88.1) <0.001
Hearing (poor) 1.23 (.63–2.4) 1.1 (.66–1.8) 2.58 (1.8–3.7) 4.1 (2–8.2) 13.6 (3.6–40.2) <0.001
Depression (severe) 6.1 (4.4–8.3) 7.9 (6.45–9.7) 9.5 (7.7–11.6) 17.3 (12.4–23.5) 27.7 (12.3–51.1) <0.001
Notes.
aThePvalues refer to one-way ANOVA tests for means comparison or Chi-square tests for frequencies comparisons. Confidence intervals in parentheses.
bAll cardiovascular health measures are self-reported (CAPI interview) apart from Hypertension that is measured in the heath assessment.
Setti
et
al.
(2015),
P
eerJ
,
DOI
10.7717/peerj.1407
Table 2 Ordinal odds ratios representing the effect of potential contributing factors to self- reported vision (excellent, very good, good, fair, poor).Participants suffering from Dementia, Parkinson’s Disease and serious memory impairment (all by self-report) were excluded from the analysis because they present cognitive impairment or neurologic illness that could influence the relationship between cognition and self-reported vision. Analyses are adjusted for clustered sample design and sampling weights.
Univariate effect Multivariate effect
OR 95% CI OR 95% CI
Trail making task time (best quintile) 1 [1.00, 1.00] 1 [1.00, 1.00]
2nd 0.96 [0.61, 1.52] 0.96 [0.79, 1.16]
3rd 1.19 [0.77, 1.83] 1.06 [0.86, 1.30]
4th 1.55* [1.02, 2.34] 1.05 [0.83, 1.33]
5th quintile 3.16*** [2.11, 4.71] 1.36* [1.05, 1.76]
Choice reaction task time (fastest) 1 [1.00, 1.00] 1 [1.00, 1.00]
2nd 1.43 [0.92, 2.22] 1.09 [0.90, 1.31]
3rd 1.2 [0.76, 1.90] 0.97 [0.80, 1.18]
4th 1.56 [0.99, 2.44] 1.1 [0.89, 1.38]
Slowest quintile 3.00*** [1.91, 4.71] 1.21 [0.95, 1.54]
Visual acuity (best quintile) 1 [1.00, 1.00] 1 [1.00, 1.00]
2nd 1.60* [1.01, 2.56] 1.2 [0.99, 1.46]
3rd 1.89** [1.28, 2.81] 1.30* [1.06, 1.61]
4th 3.13*** [2.10, 4.66] 1.52*** [1.22, 1.89]
Lowest quintile 4.02*** [2.70, 5.99] 1.72*** [1.35, 2.18]
High frequency CS (lowest quintile) 1 [1.00, 1.00] 1 [1.00, 1.00]
2nd 1.37 [0.93, 2.02] 0.86 [0.69, 1.07]
3rd 1.79** [1.19, 2.69] 1.08 [0.86, 1.36]
4th 0.8 [0.52, 1.22] 1.03 [0.83, 1.27]
Highest quintile 0.83 [0.54, 1.27] 1.03 [0.83, 1.28]
Low frequency CS (lowest quintile) 3.09*** [2.03, 4.71] 1.22 [0.97, 1.54]
2nd 1.21 [0.76, 1.95] 1.02 [0.84, 1.25]
3rd 1.4 [0.92, 2.12] 1 [0.81, 1.23]
4th 1.13 [0.70, 1.82] 0.99 [0.81, 1.20]
Highest quintile 1 [1.00, 1.00] 1 [1.00, 1.00]
Any diagnosed eye pathology 4.04*** [3.02, 5.41] 2.25*** [1.77, 2.87]
Doesn’t wear glasses 1.12 [0.86, 1.47] 1.32*** [1.12, 1.55]
Optician visit 1.73** [1.20, 2.49] 1.01 [0.80, 1.27]
MoCA score without visual elements (per point) 0.89*** [0.86, 0.92] 0.98* [0.95, 1.00]
Female vs male 1.18 [0.91, 1.54] 0.99 [0.86, 1.14]
Primary education (ref) 1 [1.00, 1.00] 1 [1.00, 1.00]
Secondary education 0.42*** [0.32, 0.55] 0.70*** [0.59, 0.83]
Tertiary or higher education 0.33*** [0.24, 0.44] 0.64*** [0.53, 0.77]
Total Wealth (>e400,000) 0.44*** [0.31, 0.61] 0.71*** [0.59, 0.85]
Age 50–54 1 [1.00, 1.00] 1 [1.00, 1.00]
55–59 0.88 [0.62, 1.24] 0.9 [0.74, 1.09]
60–64 0.94 [0.64, 1.38] 0.78* [0.63, 0.95]
65–69 1.07 [0.75, 1.54] 0.67*** [0.52, 0.85]
Table 2 (continued)
Univariate effect Multivariate effect
OR 95% CI OR 95% CI
70–74 1.08 [0.71, 1.66] 0.64** [0.48, 0.84]
75–79 1.59 [0.94, 2.70] 0.8 [0.56, 1.14]
80+ 3.27*** [1.84, 5.79] 0.68 [0.37, 1.28]
Hypertension 0.9 [0.65, 1.23] 0.99 [0.84, 1.16]
Diabetes 1.21 [0.75, 1.96] 0.95 [0.70, 1.28]
Stroke 2.07* [1.07, 3.99] 1.83** [1.22, 2.75]
Not depressed (CES-D<8) 1 [1.00, 1.00] 1 [1.00, 1.00]
Sub-threshold depressive symptoms (CES-D 8-15) 2.14*** [1.57, 2.92] 1.70*** [1.41, 2.04] Significant depression (CES-D≥16) 3.89*** [2.71, 5.56] 1.96*** [1.42, 2.70]
Notes. *p<0.05. **p<0.01. ***p<0.001.
of general cognitive function even after adjusting for all other covariates (OR=0.98 per
point;p<0.05).
Mental health had a highly significant impact on the ratings, with a dose response pattern indicating that more depressed participants were more likely to rate their vision
as poorer. In addition depression may have affected SVR due to a general decrease in
the ability to carry out daily functioning, in line with the finding that self-reports are modulated by health status (e.g.,Ponds, Van Boxtel & Jolles, 2000).
To clarify whether the relationship of TMT with SRV performance could be attributed to visual processing skills in this context, more so than to global cognitive function, additional analyses were performed. Adding to the model individual MoCA subscores related to working memory (serial subtraction) and executive function (verbal fluency),
which have been associated with TMT performance (Crowe, 1998) or visual reasoning
(indicative of fluid intelligence) (Salthouse, 2011) did not attenuate the effect of TMT on SRV (data not shown).
It is worth noting that the prevalence of sub-optimal self reported visual function (identifiable in ‘fair’ and ‘poor’ vision) was relatively low (7%). However this is in line with existing literature, for example a prevalence of self reported fair and poor vision of 10%
in people aged between 40 and 69 was reported (Klein et al., 1999), while the prevalence
increased over 70 years of age (Hidalgo et al., 2009) reported a prevalence of 6% (bad
or very bad vision by self report) in participants age 65 and older. Although the current study confirms a relationship between visual acuity and SRV, additional factors including the presence of ocular pathology and reduced visual processing capacity are identified as important determinants of SRV.
Visual processing, as assessed TMT was associated with SRV, independent of global cognition. The lack of significance of the CRT in the fully adjusted model was to be expected, in consideration of the fact that processing speed for visual targets was also captured by the TMT. The association between slow TMT and poor SRV may indicate
that the TMT captures the contribution of visual search and visual attention (Crowe, 1998;
Salthouse, 2011;Sanchez-Cubillo et al., 2009) to SRV. Indeed TMT has been used previously as a measure of visual scanning to predict driving restriction or cessation in line with
other visual attention tasks (Keay et al., 2009). However, TMT also captures visuo-motor
skills also declining with age, therefore it is not possible to exclude that decline in the ability to trace the trail may have influenced the results. Nonetheless, the lack of significant association between the CRT (cognitive and motor components) to SRV supports the idea that the visual processing component of TMT is more salient than the motor component in determining the association between TMT and SRV.
As expected, visual acuity and (self reported) ocular pathologies, independent of VA and CS, were associated with a substantial increase in the likelihood of reporting poor vision. The increased level of association suggests that self-reports capture day to day visual deficits that are not fully captured by acuity measures (Charalampidou et al., 2011;
Tejeria et al., 2002).
The contribution of wearing glasses to self-reports could be due to a need for refractive correction, whereby respondents not wearing glasses may need to correct a deficit that is not entirely captured by the distance visual acuity test, for example, for near vision.
Cognitive status, assessed by the MoCA indicated that higher cognitive scores were associated with decreased likelihood of self reporting poor vision. This result could be interpreted in terms of coping strategies. It is plausible to assume that memory and attention could contribute in maintaining functional efficiency in spite of a visual acuity deficit. It has been indicated previously, that the Short Portable Mental Status Questionnaire score (dichotomized according impairment and no impairment), which assesses global cognition, was associated with the score obtained in the Visual Function Index questionnaire (VF-14) (Hidalgo et al., 2009).
Among the other covariates, the protective effect of age was notable, with older olds
(65+) reporting relatively better vision than younger olds (50–54) when acuity was
controlled for. This may suggest a positive bias in self reports with ageing. Alternatively it may indicate that older people have developed coping strategies that alleviate the impact of their visual deficits on their daily life.
Higher educated individuals and wealthier individuals were also more likely to report good vision. This may be due to a positive attitude in self reports. However at present it is not possible to exclude that both self reported health and quality of life may be related to better coping strategies developed by more educated and wealthier individuals.
CONCLUSIONS
Our results confirm the existing evidence that visual acuity is a clear contributor to SRV as well as ocular pathology. Other factors such as depression are significant determinants of SRV. More importantly in relation to our hypotheses, higher level visual processing, in terms of response time to visual stimuli (CRT/TMT) and time to perform a task requiring visual search (TMT) play a part in SRV. This may be due to visual deficits linked to higher level visual processing that are not fully captured by psychophysical tests. A limitation of this study is constituted by the time delay between the CAPI and the health assessment, whereby the SRV question was always asked before (approximately three months) the vision and cognitive tests were administered. Therefore we cannot completely exclude biases due to the order of testing. However we feel that considering the vast amount of questions asked in the CAPI and the intensive assessment occurring in the health assessment it is unlikely that expectations on specific tests and their associations could be formed and significantly influence performance. A limitation of this study is also that TMT is not the ‘purest’ instrument to test the contribution of higher level visual processing to SRV because of the nature of the visual search required by the task and the variety of cognitive processes involved in performing it, especially working memory and attention (Crowe, 1998;Salthouse, 2011;Sanchez-Cubillo et al., 2009). Experimental tasks testing correlations between self reported vision and a wider range of visual processing skills going from psychophysical measures, to visual discrimination, to visual search, to more cognitively loaded vision based tasks such as TMT would allow determining which aspects of visual cognition underlie the apparently simple fact that one individual judges her/his vision as excellent and another poor. Such an experimental approach would complement the epidemiological approach proposed here, where only a limited amount of assessments could be administered. CRT and TMT represent viable instruments in the context of this epidemiological study aimed at assessing a broad spectrum of health related variables. Indeed epidemiological studies have shown that SRV is associated with physical and cognitive limitations and decline (e.g.,Rogers & Langa, 2010), the present study adds to this literature by showing that poorer SRV can be associated not only with poor visual acuity but also with poorer cognitive abilities related to visual processing, which are in turn likely to influence the capability to cope with visual acuity deficits themselves.
ADDITIONAL INFORMATION AND DECLARATIONS
Funding
This work was funded by The Irish Longitudinal Study on Ageing (TILDA). Funding for TILDA was received from the Atlantic Philanthropies, the Irish Government, and Irish Life plc. The funders had no role in study design, data collection and analysis, decision to publish, or preparation of the manuscript.
Grant Disclosures
The following grant information was disclosed by the authors: The Irish Longitudinal Study on Ageing (TILDA).
Atlantic Philanthropies. Irish Government. Irish Life plc.
Competing Interests
The authors declare there are no competing interests.
Author Contributions
• Annalisa Setti conceived and designed the experiments, performed the experiments,
analyzed the data, wrote the paper, reviewed drafts of the paper.
• James Loughman conceived and designed the experiments, wrote the paper, reviewed
drafts of the paper.
• George M. Savva conceived and designed the experiments, performed the experiments,
analyzed the data, contributed reagents/materials/analysis tools, prepared figures and/or tables, reviewed drafts of the paper.
• RoseAnne Kenny conceived and designed the experiments, performed the experiments,
contributed reagents/materials/analysis tools, reviewed drafts of the paper.
Human Ethics
The following information was supplied relating to ethical approvals (i.e., approving body and any reference numbers):
Data from the first wave of the nationally representative Irish Longitudinal Study on Ageing (TILDA) were used for this study. The recruitment and sampling method has been
described (Kearney et al., 2011). Ethical approval was obtained from the Trinity College
Dublin research ethics committee, and all participants provided written informed consent in accordance with the Declaration of Helsinki.
Data Availability
The following information was supplied regarding data availability: Irish Social Science Data Archive:http://www.ucd.ie/issda/data/tilda/.
Supplemental Information
Supplemental information for this article can be found online athttp://dx.doi.org/
10.7717/peerj.1407#supplemental-information.
REFERENCES
Abdulrab K, Heun R. 2008.Subjective Memory Impairment. A review of its definitions indicates the need for a comprehensive set of standardised and validated criteria.European Psychiatry 23:321–330DOI 10.1016/j.eurpsy.2008.02.004.
Anstey KJ, Wood J, Kerr G, Caldwell H, Lord SR. 2009.Different cognitive profiles for single compared with recurrent fallers without dementia.Neuropsychology23:500–508
DOI 10.1037/a0015389.
Ball K, Edwards JD, Ross LA. 2007.The impact of speed of processing training on cognitive and everyday functions.The Journals of Gerontology Series B: Psychological Sciences and Social Sciences62:19–31DOI 10.1093/geronb/62.special issue 1.19.
Ball KK, Roenker DL, Wadley VG, Edwards JD, Roth DL, McGwin Jr G, Raleigh R, Joyce JJ, Cissell GM, Dube T. 2006.Can high-risk older drivers be identified through performance-based measures in a Department of Motor Vehicles setting?Journal of the American Geriatrics Society54:77–84DOI 10.1111/j.1532-5415.2005.00568.x.
Brant R. 1990.Assessing proportionality in the proportional odds model for ordinal logistic regression.Biometrics46:1171–1178DOI 10.2307/2532457.
Cabeza R, Grady CL, Nyberg L, McIntosh AR, Tulving E, Kapur S, Jennings JM, Houle S, Craik FIM. 1997.Age-related differences in neural activity during memory encoding and retrieval: a positron emission tomography study.The Journal of Neuroscience17:391–400. Charalampidou S, Loughman J, Nolan J, Stack J, Cassidy L, Pesudovs K, Beatty S. 2011.
Prognostic indicators and outcome measures for surgical removal of symptomatic nonadvanced cataract.Archives of Ophthalmology129:1155–1161DOI 10.1001/archophthalmol.2011.111. Cronin-Golomb A, Gilmore GC, Neargarder S, Morrison SR, Laudate TM. 2007.Enhanced
stimulus strength improves visual cognition in aging and Alzheimer’s disease.Cortex 43:952–966DOI 10.1016/S0010-9452(08)70693-2.
Crowe SF. 1998.The differential contribution of mental tracking, cognitive flexibility, visual search, and motor speed to performance on parts A and B of the trail making test.Journal of Clinical Psychology54:585–591
DOI 10.1002/(SICI)1097-4679(199808)54:5<585::AID-JCLP4>3.0.CO;2-K.
D’Elia LF, Satz P, Uchiyama CL, White T. 1996.Color trails test. Professional manual. Odessa: Psychological Assessment Resources.
Dufouil C, Fuhrer R, Alp´erovitch A. 2005.Subjective cognitive complaints and cognitive decline: consequence or predictor? The epidemiology of vascular aging study.Journal of the American Geriatrics Society53:616–621DOI 10.1111/j.1532-5415.2005.53209.x.
Edwards JD, Ruva CL, O’Brien JL, Haley CB, Lister JJ. 2013.An examination of mediators of the transfer of cognitive speed of processing training to everyday functional performance. Psychology and Aging28(2):314–321DOI 10.1037/a0030474.
El-Gasim M, Munoz B, West SK, Scott AW. 2012.Discrepancies in the concordance of
self-reported vision status and visual acuity in the salisbury eye evaluation study.Ophthalmology 119:106–111DOI 10.1016/j.ophtha.2011.07.005.
Faubert J. 2002.Visual perception and aging.Canadian Journal of Experimental Psychology 56:164–176DOI 10.1037/h0087394.
Fors S, Thorslund M, Parker M. 2006.Do actions speak louder than words? Self-assessed and performance-based measures of physical and visual function among old people.European Journal of Ageing3:15–21DOI 10.1007/s10433-006-0021-5.
Grady CL. 2008.Cognitive neuroscience of aging.Annals of the New York Academy of Sciences 1124:127–144DOI 10.1196/annals.1440.009.
Hidalgo JL-T, Mart´ınez IP, Bravo BN, Pretel FA, Ferrer AV, Verdejo M ´AL. 2009.Visual function versus visual acuity in older people.Ophthalmic Epidemiology16:262–268
DOI 10.1080/09286580902999397.
Humes LA, Dubno JR, Gordon-Salant S, Lister JJ, Cacace AT, Cruickshanks KJ, Gates GA, Wilson RH, Wingfield A. 2012.Central presbycusis—a review and evaluation of the evidence. Journal of the American Academy of Audiology23.
Kearney PM, Cronin H, O’Regan C, Kamiya Y, Savva GM, Whelan B, Kenny R. 2011.Cohort profile: the irish longitudinal study on ageing.International Journal of Epidemiology40:877–884 DOI 10.1093/ije/dyr116.
Keay L, Munoz B, Turano KA, Hassan SE, Munro CA, Duncan DD, Baldwin K, Jasti S,
Gower EW, West SK. 2009.Visual and cognitive deficits predict stopping or restricting driving: the salisbury eye evaluation driving study (SEEDS).Investigative Ophthalmology & Visual Science50:107–113DOI 10.1167/iovs.08-2367.
Kempen GIJM, Heuvelen MJGV, Brink RHSVD, Koojman AC, Klein M, Houx PJ, Ormel J. 1996. Factors affecting contrasting results between self-reported and performance-based levels of physical limitations.Age and Ageing25:458–464DOI 10.1093/ageing/25.6.458.
Klein BEK, Klein R, Lee KE, Cruickshanks KJ. 1999.Associations of performance-based and self-reported measures of visual function: the Beaver Dam Eye Study.Ophthalmic Epidemiology 6(1):49–60DOI 10.1076/opep.6.1.49.1569.
Lindenberger U, Baltes PB. 1994.Sensory functioning and intelligence in old age: a strong connection.Psychology and Aging9:339–355DOI 10.1037/0882-7974.9.3.339.
Lindenberger U, Ghisletta P. 2009.Cognitive and sensory declines in old age: gauging the evidence for a common cause.Psychology and Aging24:1–16DOI 10.1037/a0014986. Loughman J, Nolan JM, Howard AN, Connolly E, Meagher K, Beatty S. 2012.The impact of
macular pigment augmentation on visual performance using different carotenoid formulations. Invest Ophthalmol Vis. Investigative Ophthalmology & Visual Science53:7871–7880
DOI 10.1167/iovs.12-10690.
Madden DJ. 2007.Aging and visual attention.Current Directions in Psychological Science16:70–74 DOI 10.1111/j.1467-8721.2007.00478.x.
Owsley C. 2011. Aging and vision. Vision Research 51:1610–1622 DOI 10.1016/j.visres.2010.10.020.
Ponds WHM, Van Boxtel MPJ, Jolles JR. 2000.Age-related changes in subjective cognitive functioning.Educational Gerontology26(1):67–81DOI 10.1080/036012700267402.
Rogers MAM, Langa KM. 2010.Untreated poor vision: a contributing factor to late-life dementia. American Journal of Epidemiology171:728–735DOI 10.1093/aje/kwp453.
Rubin GS, Bandeen-Roche K, Huang G-H, Mu˜noz B, Schein OD, Fried LP, West SK, Team ftSP. 2001.The association of multiple visual impairments with self-reported visual disability: SEE project.Investigative Ophthalmology & Visual Science42:64–72.
Rubin GS, Ng ESW, Bandeen-Roche K, Keyl PM, Freeman EE, West SK, The SEEPT. 2007.A prospective, population-based study of the role of visual impairment in motor vehicle crashes among older drivers: The SEE study.Investigative Ophthalmology & Visual Science48:1483–1491 DOI 10.1167/iovs.06-0474.
Salthouse TA. 1991.Mediation of adult age differences in cognition by reductions in working memory and speed of processing.Psychological Science2:179–183
DOI 10.1111/j.1467-9280.1991.tb00127.x.
Salthouse TA. 1996. The processing-speed theory of adult age differences in cognition. Psychological Review103:403–428DOI 10.1037/0033-295X.103.3.403.
Salthouse TA. 2011.What cognitive abilities are involved in trail-making performance?Intelligence 39:222–232DOI 10.1016/j.intell.2011.03.001.
Sanchez-Cubillo I, PeriI ´A ˜Nez JA, Adrover-Roig D, Rodriguez-S ´Anchez JM, R´Ios-Lago M, Tirapu J, Barcel ´O F. 2009.Construct validity of the Trail Making Test: role of task-switching, working memory, inhibition/interference control, and visuomotor abilities.Journal of the International Neuropsychological Society15:438–450DOI 10.1017/S1355617709090626. Sekuler R, Ball K. 1986.Visual localization: age and practice.Journal of the Optical Society of
America. Part A, Optics and Image Science3:864–867DOI 10.1364/JOSAA.3.000864. Tejeria L, Harper RA, Artes PH, Dickinson CM. 2002.Face recognition in age related macular
degeneration: perceived disability, measured disability, and performance with a bioptic device. British Journal of Ophthalmology86:1019–1026DOI 10.1136/bjo.86.9.1019.
Treisman A, Gelade G. 1980.A feature-integration theory of attention.Cognitive Psychology 12:97–136DOI 10.1016/0010-0285(80)90005-5.
Wolfe JM. 1998.What can 1 million trials tell us about visual search?Psychological Science9:33–39 DOI 10.1111/1467-9280.00006.