Determinants of Mammal and Bird Species
Richness in China Based on Habitat Groups
Haigen Xu1*, Mingchang Cao1, Jun Wu1, Lei Cai2, Hui Ding1, Juncheng Lei3, Yi Wu3, Peng Cui1, Lian Chen1, Zhifang Le1, Yun Cao1,4
1Nanjing Institute of Environmental Sciences, Ministry of Environmental Protection, Nanjing 210042, China,
2Department of Natural Ecology Conservation, Ministry of Environmental Protection, Beijing 100035, China,
3College of Forest Resources and Environment, Nanjing Forestry University, Nanjing 210037, China,
4Department of Biology, Nanjing University, Nanjing 210093, China
Abstract
Understanding the spatial patterns in species richness is a central issue in macroecology and biogeography. Analyses that have traditionally focused on overall species richness limit the generality and depth of inference. Spatial patterns of species richness and the mechanisms that underpin them in China remain poorly documented. We created a data-base of the distribution of 580 mammal species and 849 resident bird species from 2376 counties in China and established spatial linear models to identify the determinants of spe-cies richness and test the roles of five hypotheses for overall mammals and resident birds and the 11 habitat groups among the two taxa. Our result showed that elevation variability was the most important determinant of species richness of overall mammal and bird spe-cies. It is indicated that the most prominent predictors of species richness varied among dif-ferent habitat groups: elevation variability for forest and shrub mammals and birds,
temperature annual range for grassland and desert mammals and wetland birds, net pri-mary productivity for farmland mammals, maximum temperature of the warmest month for cave mammals, and precipitation of the driest quarter for grassland and desert birds. Noteworthily, main land cover type was also found to obviously influence mammal and bird species richness in forests, shrubs and wetlands under the disturbance of intensified human activities. Our findings revealed a substantial divergence in the species richness patterns among different habitat groups and highlighted the group-specific and disparate environmental associations that underpin them. As we demonstrate, a focus on overall spe-cies richness alone might lead to incomplete or misguided understanding of spatial pat-terns. Conservation priorities that consider a broad spectrum of habitat groups will be more successful in safeguarding the multiple services of biodiversity.
Introduction
Understanding spatial patterns in species richness is a central issue in macroecology and bioge-ography [1–5]. Spatial patterns in species richness are essentially generated by speciation, OPEN ACCESS
Citation:Xu H, Cao M, Wu J, Cai L, Ding H, Lei J, et al. (2015) Determinants of Mammal and Bird Species Richness in China Based on Habitat Groups. PLoS ONE 10(12): e0143996. doi:10.1371/journal. pone.0143996
Editor:Judi Hewitt, University of Waikato (National Institute of Water and Atmospheric Research), NEW ZEALAND
Received:November 23, 2014
Accepted:November 12, 2015
Published:December 2, 2015
Copyright:© 2015 Xu et al. This is an open access article distributed under the terms of theCreative Commons Attribution License, which permits unrestricted use, distribution, and reproduction in any medium, provided the original author and source are credited.
Data Availability Statement:All relevant data are within the paper and its Supporting Information files.
Funding:This work was funded by the National Key Technologies Research and Development Program (grants 2012BAC01B01, 2008BAC 39B06 and 2008BAC39B01) and the Biodiversity Conservation Program of China.
colonization and extinction processes along ecological and historical time scales [6] and corre-lated with variation in climate, topography and history [4,7–15]. Since the 19thcentury, ecolo-gists and biogeographers have been exploring the underlying mechanisms of species richness pattern across the earth, and this issue has triggered hot scientific debates for a long time [7–8, 16–19]. In the context of global climate change, the studies of species richness pattern are likely to offer reliable evidences for the prediction of the possible response of biodiversity to the envi-ronmental change, and have greater implication for biodiversity conservation [2].
To explain the spatial patterns of species richness, more than 100 explanatory hypotheses have been proposed to date [8,20]. Among them, such hypotheses are at the core of current studies, e.g., the energy hypothesis, the environmental stability hypothesis and the habitat het-erogeneity hypothesis. The energy hypothesis can be classified into three versions: The“ water-energy dynamics”version states that areas with higher water-energy dynamics harbor higher species richness [3,21]. The“ambient energy”version was established based on the physiologi-cal requirements of organisms [3,22] and considers heat as the predictor of species richness gradients [9]. The“productivity”version asserts that species richness increases with productiv-ity [22]. Accordingly, animal species richness can be driven by resource availability, e.g., plant biomass for herbivores, herbivore biomass for predators [3,22]. The environmental stability hypothesis claims that a stable environment can accelerate species specialization and ecological niche diversification, which may further cause an increase in species richness [21,23]. The hab-itat heterogeneity hypothesis posits that species richness gradients are correlated with heteroge-neity in habitats [4], because variability in elevation, landscape or vegetation can create diverse habitats for co-existing species and thereby lead to higher species richness [21]. However, the explanatory power of different hypotheses and their relative roles in explaining variation of species richness lack scrutiny [4,8].
Some previous studies indicate that a unified mechanism associated with environmental determinants can not generally be proposed when explaining species richness at different scales [6,10,24–26]. Species richness patterns across the earth are the consequences of the multiple interaction of a multitude of biotic and environmental variables. Analyses that focus on overall species richness may represent the majority of species among multiple taxa particularly based on the geographical distribution and thus bring the obstacle to the generality and depth of inference [27]. In recent years, some ecologists initiated to make research by partitioning varia-tion in species richness of one or several specific taxa, e.g., birds in North America [6], bats in the entire New World [28], and macroinvertebrates in Finland [29]. Though some advances have been made currently, it still lacks a systematic study of species richness pattern and the related potential mechanisms in various habitats across a broad geographical range.
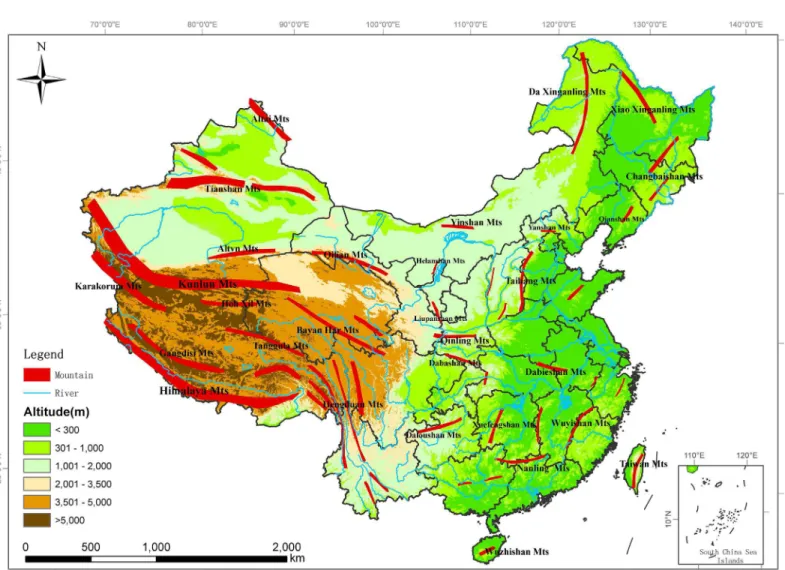
China is one of several‘mega-diversity’countries in the world [30]. It covers a huge geo-graphical area (9.6 million km2), from tropical to boreal zones, from a very low altitude (156 m below sea level) to the highest mountain in the world (Mount Everest) (Fig 1) [31]. In particu-lar, most of the different types of biomes on the earth are found in China, which exhibits as a prerequisite for rich biodiversity especially the diverse mammals and birds [12] and offers an opportunity to study spatial patterns of the species richness and the mechanisms that underpin them. In recent years, some considerable progresses have been made in empirical descriptions of its biogeography [32–34] and quantitative analyses of some taxa [5,12,35–40]. However, there are few quantitative analyses at a finer resolution based on a complete database of all mammals and birds across China.
mammal species and 849 resident bird species from 2376 counties in China. By partitioning the two taxa into 11 habitat groups, we aim to (i) identify the most dominant determinants of species richness of overall mammals and resident birds and that among different habitat groups; (ii) test the roles of five hypotheses [i.e. the water-energy hypothesis, the ambient energy (temperature) hypothesis, the productivity hypothesis, the environmental stability hypothesis and the habitat heterogeneity hypothesis] in explaining variation of species richness of overall mammals and resident birds and that among different habitat groups; and (iii) explore the implication of our analysis based on habitat groups to biodiversity conservation across China.
Materials and Methods
Species richness data
We compiled a database of the geographical distribution of 580 mammal species and 849 resi-dent bird species from 2376 counties in the terrestrial and inland water ecosystems of China Fig 1. Sketch map of China showing elevation and major mountain ranges.The names of major mountain ranges were derived from Shen (2001). The inset in the right bottom of the figure shows the south boundary of China, including all islands in the South China Sea. This figure was used only for illustrative purposes.
(seeS1andS2Appendices), which account for nearly all the mammal and resident bird species native to China [41–42]. We excluded species in marine ecosystems, cultivated or bred species in zoos or farms, and exotic species. In addition, migratory birds were excluded in this study since this group shows the complex association with environment variables. To get a finer reso-lution and facilitate the future work of biodiversity conservation in China, we mainly used ‘county’as the basic assessment unit in this study. In addition, we treated the following units respectively as an assessment unit, i.e., a municipality, a capital city in a province or autono-mous region, a city at prefectural level, and a special administrative region (e.g., Hong Kong, Macau) since the distribution data were recorded at the above levels instead of county-level. To sum up, 2376 assessment units (thereafter named as counties) were used in this study. The checklist of mammal and bird species in the database was derived from the complete studies [42–43]. The information of species distribution in the database was collected from three sources: (i) more than 400 literature on the distribution of birds and mammals from 1970 to 2012 (80%), e.g. Fauna Sinicae, provincial monographs on birds and mammals [42–44]; (ii) collection information of specimens in herbaria of more than 20 institutes and universities (15%); and (iii) field survey records by experts specialized in taxonomy or biodiversity from over 30 institutes in China (5%). To reduce sampling bias and obtain more accurate distribu-tion, more than 20 taxonomists specialized in the study of mammal and bird taxa from China were invited to review the spatial distribution of each species in the database. To elucidate the species richness in different habitats, we classified mammal species into six habitat groups and resident bird species into five habitat groups according to their habitat types (seeS1andS2 Appendices). The habitat types of mammals and resident birds were compiled based on Fauna Sinicae [44]. Generalist species were categorized into several habitat groups if they occupy more than one habitat type.
Environmental data
Statistical analyses
We used multivariate models to test hypotheses explaining species richness patterns as follows (S1 Fig):
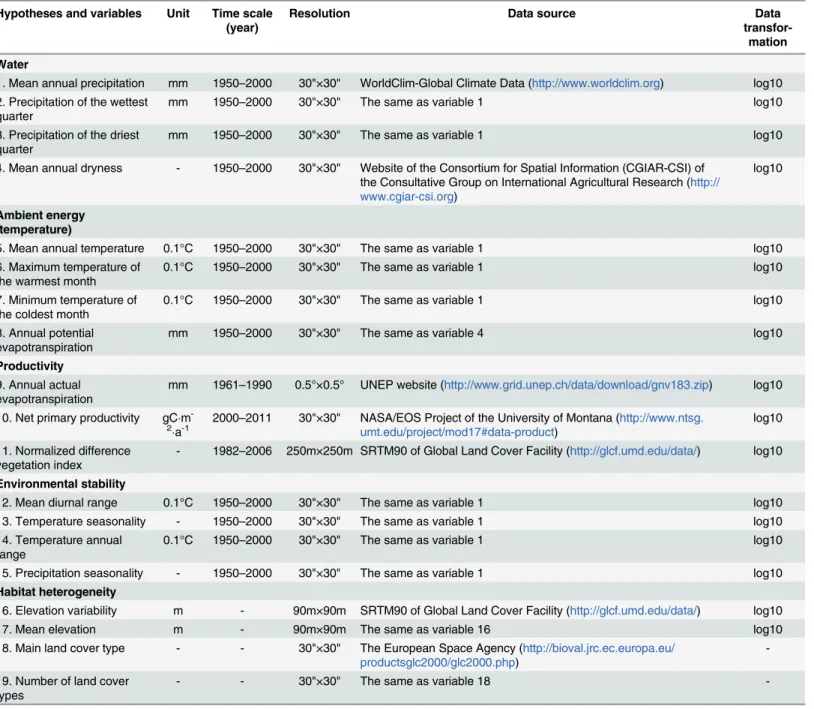
Data Processing. Counties in China vary in size (mean: 3908.7km2; standard deviation: 9287.6km2), which might have effects on species richness. We regressed species richness on county area (both variables were log10-transformed), and obtained the residuals of species rich-ness [48]. The residuals of species richness (S3 Appendix) were used to avoid the effects of area [49]. County area and environmental variables were log10-transformed and the residuals of Table 1. Five main hypotheses explaining species richness patterns.
Hypotheses and variables Unit Time scale (year)
Resolution Data source Data
transfor-mation Water
1. Mean annual precipitation mm 1950–2000 30"×30" WorldClim-Global Climate Data (http://www.worldclim.org) log10 2. Precipitation of the wettest
quarter mm 1950–2000 30"×30" The same as variable 1 log10
3. Precipitation of the driest
quarter mm 1950–2000 30"×30" The same as variable 1 log10
4. Mean annual dryness - 1950–2000 30"×30" Website of the Consortium for Spatial Information (CGIAR-CSI) of the Consultative Group on International Agricultural Research (http:// www.cgiar-csi.org)
log10
Ambient energy (temperature)
5. Mean annual temperature 0.1°C 1950–2000 30"×30" The same as variable 1 log10
6. Maximum temperature of
the warmest month 0.1°C 1950–2000 30"×30" The same as variable 1 log10
7. Minimum temperature of
the coldest month 0.1°C 1950–2000 30"×30" The same as variable 1 log10
8. Annual potential
evapotranspiration mm 1950–2000 30"×30" The same as variable 4 log10
Productivity
9. Annual actual
evapotranspiration mm 1961–1990 0.5°×0.5° UNEP website (http://www.grid.unep.ch/data/download/gnv183.zip) log10 10. Net primary productivity gCm
-2
a-1
2000–2011 30"×30" NASA/EOS Project of the University of Montana (http://www.ntsg.
umt.edu/project/mod17#data-product) log10 11. Normalized difference
vegetation index - 1982–2006 250m×250m SRTM90 of Global Land Cover Facility (http://glcf.umd.edu/data/) log10
Environmental stability
12. Mean diurnal range 0.1°C 1950–2000 30"×30" The same as variable 1 log10
13. Temperature seasonality - 1950–2000 30"×30" The same as variable 1 log10 14. Temperature annual
range 0.1°C 1950–2000 30"×30" The same as variable 1 log10
15. Precipitation seasonality - 1950–2000 30"×30" The same as variable 1 log10
Habitat heterogeneity
16. Elevation variability m - 90m×90m SRTM90 of Global Land Cover Facility (http://glcf.umd.edu/data/) log10
17. Mean elevation m - 90m×90m The same as variable 16 log10
18. Main land cover type - - 30"×30" The European Space Agency (http://bioval.jrc.ec.europa.eu/
productsglc2000/glc2000.php)
-19. Number of land cover
types - - 30"×30" The same as variable 18
species richness were used in all analyses unless otherwise stated. Statistical analyses were car-ried out using the statistical software R 2.15 unless otherwise stated [50,51].
Variable Selection. Multicollinearity of explanatory variables can cause failures in regres-sion analyses [50]. We successively took two approaches to select the variables for model analy-ses to exclude multicollinearity among the variables. First, we performed Spearman (two-sided) correlation analysis (S1 Table) to avoid multicollinearity between any two variables in each category. In addition, we also calculated the deviance of variables in univariate regression models. If the correlation coefficient between them was>0.7, we removed strongly intercorre-lated variables and retained the variables that explained more deviance in univariate regression models [4,52–53]. For example, if elevation variability and mean elevation were highly corre-lated (r>0.7) and the explained deviance of elevation variability in univariate models was larger than that of mean elevation, we dropped mean elevation from further analysis. Thus, we selected a set of variables from each category for the next analysis (S2 Table). In the second step, we performed hierarchical partitioning analysis with the combination of selected predic-tors from each category to screen out the predicpredic-tors that have the most independent effects on the residuals of species richness since this method can overcome multicollinearity among the variables [50]. In the hierarchical partitioning, all possible models were considered in a hierar-chical multivariate regression setting to jointly identify most possible predictors. The increased goodness-of-fit was calculated in each model with a particular variable compared to the equiva-lent model without that variable, and the improvement in the fit was averaged across all possi-ble models with that predictor included [54]. Then, we got a list of predictors and their independent and joint effects on the residuals of species richness [54,55]. A 1000-randomiza-tion procedure was carried out to test the statistical significance of the independent effects of each predictor, which was expressed as a z-score [50]. A z-score greater than or equal to 1.65 is statistically significant at p<0.05. Finally, we selected the top six predictors according to z-score because they had distinctly larger independent effects than any other variables and avoided the multicollinearity among variables across the categories (S3 Table).
Model Selection. First, we used generalized linear models (GLM) to establish a set of can-didate models that include all possible combinations of six core predictors [27]. The best-fit model was selected from the candidate models based on Akaike’s information criterion (AIC) [56]. The model with the lowest AIC is considered as the best-fit model (S4 Table). In the next step, we established spatial linear models (SLM) [4] for the best models identified by GLM, to avoid inflation of type I errors and invalid parameter estimate owning to spatial autocorrela-tion [27]. We used simultaneous autoregressive (SAR) models to account for spatial autocorre-lation. SAR spatial error models were used because their performance is better than the SAR lag model and SAR mix models when dealing with spatially autocorrelated species distribution data [57]. We examined a range of possible lag distances (100, 200, 400, 600, 800 and 1000 km) for each model and used Moran’s I coefficient to determine the degree of spatial autocorrela-tion in the residual of models. Spatial error models with a lag distance of 100 km generally accounted best for the spatial structure in the data set according to the minimum value of AIC. As r2values are not directly provided for SAR models, we used a pseudo-r2value to assess the SLM model goodness fit. Pseudo-r2was calculated as the squared Pearson correlation between predicted and observed (species richness) values [57]. We also identified the contribution of each predictor to the residuals of species richness in the best-fit SLM by testing z value for its significance [27]. Finally, we compared multivariate regressions of six predictors with that of 19 predictors to examine the robustness of six-predictor best-fit GLM and SLM [27].
variable in the model. We found that there was no obvious difference in multivariate models between the two methods (S5 Table). Therefore, results of residuals of species richness were presented in this study.
Sampling-bias Test. The multivariate models can be influenced by geographical sampling bias [59–60]. Two principles were designed to deal with sampling bias. The first principle is that the study area of the target region should remain unchanged, and the second is that sampling units should be randomly selected. To test the impacts of sampling bias on multivariate models, we used stratified random sampling. The study area was divided into 32 strata according to the administrative boundary of provinces, autonomous regions or municipalities in China. Random sampling of counties was conducted in each stratum. We selected 60% of the number of coun-ties for each stratum and obtained a subset of councoun-ties, which were randomly selected and mini-mized sampling bias. We established SLM multivariate models for the residuals of species richness of mammals and resident birds in this subset of counties. We compared the prominent predictors of SLM models for this subset of counties to that of all counties in China in order to test the impact of sampling bias. We found that the prominent predictors were the same after the treatment. Therefore, the residuals of richness data of all counties were used in this study.
Results
Patterns of mammal and bird species richness
Both mammals and birds are widely distributed across China. Mammal species richness was higher in the south than in the north, and in the mountains than in the plains. Such regions harbor the highest mammal species richness, i.e. the southeastern Himalaya Mountains, the Hengduan Mountains, the Minshan Mountains, the Qionglai Mountains, the Qinling Moun-tains, the Daba mounMoun-tains, the Wuyi MounMoun-tains, the Xishuangbanna in Yunnan Province, the border regions of southwestern Guangxi, and the mountains of central and southern part of Hainan. All these hot spots covered 49 assessment units of ten provinces (autonomous
regions). Mammal species richness reached the maximum (i.e., 107) in Jingdong, Yunnan. Spe-cies richness of mammals ranged from 45 to 69 in such regions, i.e. the Nanling Mountains, the Wushan Mountains, the Dalou Mountains, the mountains in the borders of Zhejiang Province and Anhui Province, the Xiao Hinggan Mountains, the Changbai Mountains, the Helan Moun-tains, the Qilian Mountains and the Altai Mountains. Species richness in other regions was less than 18, e.g., the North China Plain and the Sichuan Basin.
Resident birds share the similar distribution patterns. Our result showed that resident bird species richness was higher in the south than in the north, and in the mountains than in the plains and plateaus. The highest species richness of resident birds occurs in the southeastern Himalaya Mountains, the Hengduan Mountains, the Daliang Mountains, the Gaoligong Mountains, the Xishuangbanna and the border regions of southwestern Guangxi. The hot spots included 37 assessment units of four provinces in China. The species richness of resident birds reached the maximum (i.e., 323) in Tsonag, Tibet. Species richness of resident birds ran-ged from 99 to 170 in such regions, i.e. the hills in Guangdong, Taiwanese mountains, the Wuyi Mountains, the Nanling Mountains, the Qinling Mountains, the Daba Mountains, the Dalou Mountains and the Minshan Mountains. The species richness was less than 33 in most assessment units of northwestern China (e.g., the Qinghai-Tibet Plateau, the Inner Mongolian Plateau and the Tarim Basin).
Determinants of mammal and bird species richness
Mean annual precipitation, net primary productivity and environmental variability were also prominent predictors of species richness of mammals and resident birds. These core predictors together explained 53% and 66% of the variance of species richness of these two taxa, respec-tively (Tables2and3). When considering all 19 environmental variables, the change in model fit was small (Δr2= 0.01). Therefore, we are confident of the robustness of these best models. Habitat heterogeneity hypothesis explained most of the variance of species richness of mam-mals and resident birds. We also found broad support for the water-energy hypothesis, the pro-ductivity hypothesis and the environmental stability hypothesis (Tables2and3).
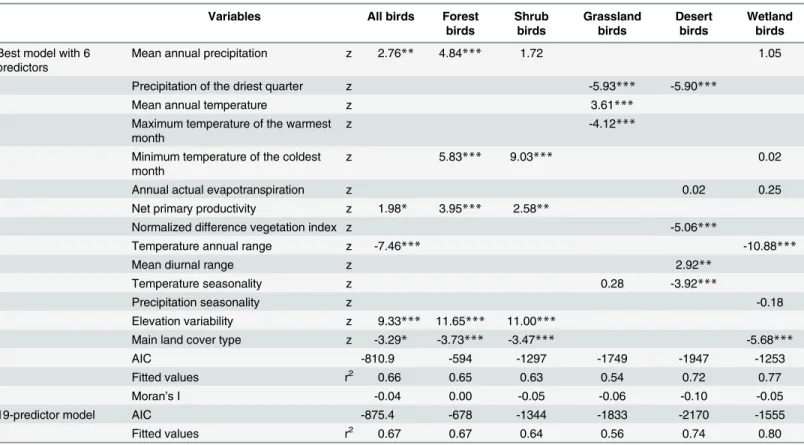
We also established SLM models for species richness of mammals and resident birds in dif-ferent habitat groups (Tables2and3). The change in fitted values between SLM models with six predictors and that with 19 predictors was small (Δr2ranges from 0.01 to 0.05). Therefore, we are confident of the robustness of these best models. Elevation variability was the most important predictor of species richness of forest and shrub mammals (z = 11.76 and 11.51, respectively, P<0.001) and resident birds (z = 11.65 and 11.00, respectively, P<0.001) (Tables 2and3). However, elevation variability was not a prominent predictor of species richness of the habitat groups (i.e., grassland, desert, farmland or cave mammals; grassland, desert or wet-land birds). Elevation variability was a relatively independent variable in China, with low corre-lations with other variables except mean elevation (S1 Table). For example, the correlation coefficients between elevation variability and precipitation, temperature and productivity were less than 0.2. Temperature annual range was the most important predictor of species richness of grassland and desert mammals (z = 7.13 and 5.44, respectively, P<0.001) (Table 2). The maximum temperature of the warmest month was the only prominent predictor of species richness of cave mammals (bats) (z = 4.14, P<0.001) (Table 2). Precipitation of the driest quar-ter was the most important predictor of species richness of grassland and desert birds (z = -5.93 and -5.90, respectively, P<0.001) (Table 3). Temperature annual range was the most important predictor of species richness of wetland birds (z = -10.88, P<0.001) (Table 3).
Discussion
Determinants of overall mammal and bird species richness
We found that elevation variability was the most important predictor of species richness of mammals and resident birds in the terrestrial and inland water ecosystems of China since the higher z values were yielded in the study (z = 9.49 and 9.33 for mammals and resident birds, respectively) (Tables2and3). Similar findings were reported in the previous studies of species richness at the global and regional scales, e.g., mammals in the continental USA and southern Canada [7], birds across the globe [14], birds in South America [8], birds in North America [10] and mammals and birds in Southeast Spain [61]. Regions with high variability in elevation provide diverse habitats, and thus harbor more species.
productivity as the key determinant underpinning patterns of bird species richness in East Asia. It is probably due to the smaller extent with higher variability in elevation and the finer grain used in our study. Liu et al. [64] identified annual precipitation and annual mean temperature as the most prominent factors accounting for avian species richness in China. The inconsistency between our analyses and Liu et al.‘s study [64] may stem from the fact that all bird species were addressed and the coarser grain of 100 × 100 km2was used by Liu et al. [64].
Determinants of mammal and bird species richness among habitat
groups
A unified mechanism associated with environmental determinants can’t often be proposed when explaining species richness [6]. Thus, habitat grouping may be an appropriate approach to advance the study of the species richness patterns. Taking mammals and birds as the pio-neers, our study provided insights into group-specific patterns of species richness among the habitat groups. It suggests that there were differences in species richness patterns of mammals Table 2. SLM multivariate models for the residuals of species richness of all mammals and its habitat groups.
Variables All
mammals
Forest mammals
Shrub mammals
Grassland mammals
Desert mammals
Farmland mammals
Cave mammals
Best model with
6 predictors Mean annual precipitation z 5.11*** 2.39*
Precipitation of the wettest
quarter z -2.47*
Precipitation of the driest
quarter z 0.77
Mean annual dryness z 5.76*** 5.74***
Mean annual temperature z 4.74*** 2.40*
Maximum temperature of the warmest month
z -5.69*** 2.09* 4.14***
Annual actual evapotranspiration
z 5.60*** -0.56
Net primary productivity z 3.58*** 8.91*** 7.46*** 3.24** 1.72
Normalized difference
vegetation index z 1.35 2.21* 2.20*
Temperature annual range z 1.84 -2.11* 7.13*** 5.44***
Mean diurnal range z -1.66
Precipitation seasonality z -2.70** -3.95*** -2.30* -0.58
Elevation variability z 9.49*** 11.76*** 11.51***
Mean elevation z 3.56***
Main land cover type z -6.24*** -6.41*** -5.88***
AIC -1502.3 -1209 -1702 -2119 -2204 -1759 -1124
Fitted values r2 0.53 0.61 0.64 0.51 0.50 0.47 0.54
Moran’s I -0.02 -0.03 -0.01 -0.03 -0.05 -0.02 -0.02
19-predictor
model AIC -1524.2 -1329 -1768 -2200 -2282 -2002 -1363
Fitted values r2 0.54 0.64 0.66 0.53 0.52 0.52 0.59
Six variables that explained most of the variance of the residuals of species richness were selected based on univariate regression models and hierarchical partitioning. We established the best multivariate model using multivariable GLM regression. To avoid inflation of type I errors and invalid parameter estimate owning to spatial autocorrelation, we then performed SLM multivariate regression (seeMethods). All continuous variables were log10-transformed (n = 2376;*: Pr(>|z|)<0.05;**: Pr(>|z|)<0.01;***: Pr(>|z|)<0.001).
and resident birds based on habitat groups and that the role of each hypothesis and their com-binations in explaining patterns of species richness also differed among habitat groups. We found that some environmental variables that were not dominant in explaining the overall spe-cies richness of mammal and resident birds stood out prominently in the habitat groups, which should receive more attention in the making of conservation policies.
Forest and shrub mammals and birds. Our result showed that elevation variability was a prominent determinant of species richness of forest and shrub mammals and birds in China (z = 11.76 and 11.51 for forest and shrub mammals respectively; z = 11.65 and 11.00 for forest and shrub birds respectively) (Tables2and3). Similar results were also reported in previous studies of birds in temperate Danish forests [65], and mammals and block-endemic birds within the Eastern Arc Mountains of Kenya and Tanzania [66]. According to the definition of UNEP-WCMC [67], China harbors approximately 4.6 million km2mountains accounting for 48% of its total land area [12] (Fig 1). Forest and shrub mammals and birds are mainly distrib-uted in the mountainous regions. Compared to other ecosystems, mountainous regions possess the distinct elevation variability, create diverse niches (e.g. the vertical partitioning of resources and nesting sites) for the species formation and specialization and eventually influence the diversity of mammal and bird species richness by vegetation physiognomy [65].
Grassland and desert mammals and birds. Temperature annual range was the most important predictor of species richness of grassland and desert mammals instead of elevation variability (z = 7.13 and 5.44 for grassland and desert mammals, respectively, P<0.001) (Table 2). Temperature annual range was negatively and significantly correlated with mean Table 3. SLM multivariate models for the residuals of species richness of all resident birds and its habitat groups.
Variables All birds Forest
birds
Shrub birds
Grassland birds
Desert birds
Wetland birds
Best model with 6
predictors Mean annual precipitation z 2.76** 4.84*** 1.72 1.05
Precipitation of the driest quarter z -5.93*** -5.90***
Mean annual temperature z 3.61***
Maximum temperature of the warmest
month z -4.12***
Minimum temperature of the coldest month
z 5.83*** 9.03*** 0.02
Annual actual evapotranspiration z 0.02 0.25
Net primary productivity z 1.98* 3.95*** 2.58**
Normalized difference vegetation index z -5.06***
Temperature annual range z -7.46*** -10.88***
Mean diurnal range z 2.92**
Temperature seasonality z 0.28 -3.92***
Precipitation seasonality z -0.18
Elevation variability z 9.33*** 11.65*** 11.00***
Main land cover type z -3.29* -3.73*** -3.47*** -5.68***
AIC -810.9 -594 -1297 -1749 -1947 -1253
Fitted values r2 0.66 0.65 0.63 0.54 0.72 0.77
Moran’s I -0.04 0.00 -0.05 -0.06 -0.10 -0.05
19-predictor model AIC -875.4 -678 -1344 -1833 -2170 -1555
Fitted values r2 0.67 0.67 0.64 0.56 0.74 0.80
The details of analysis are the same with that inTable 2(n = 2376;*: Pr(>|z|)<0.05;**: Pr(>|z|)<0.01;***: Pr(>|z|)<0.001).
annual precipitation (r = -0.81, P<0.01) and mean annual temperature (r = -0.78, P<0.01). As for grassland and desert birds, precipitation of the driest quarter was the most important pre-dictor of the species richness (z = -5.93 and -5.90 for grassland and desert birds, respectively, P<0.001) (Table 3). Grasslands and deserts are mainly distributed in the arid region of north-western China and the Qinghai-Tibet Plateau. Both of the regions harbor the low precipitation and temperature: the arid region of northwestern China is characterized by its typical arid and semi-arid climate with mean annual precipitation around 254 mm, and the Qinghai-Tibet Pla-teau is the world's largest and highest plaPla-teau with low temperatures (Mean annual tempera-ture is around 0.1°C). Therefore, the unique climate of low precipitation and temperatempera-ture greatly affects the distribution of mammal and resident bird species in the two regions. Our conclusion was partially supported by Li et al. [68], who considered that vertebrate richness was more strongly determined by energy availability and supported the energy hypothesis (the “water-energy dynamics”version). In the arid region of northwestern China and the Qinghai-Tibet Plateau, precipitation and/or temperature (ambient energy) greatly influences vegetation growth (e.g., net primary production) and the structure of plant community as the key factors, and thus indirectly affects the species richness of animals since the plants can offer food and habitats for animals [68–71]. The endemic species in both regions have developed unique adaptation to extreme environments, such as draught-and-coldness tolerance. Understanding the special characters and their synergic relationship with climate change may enhance the conservation of the endemic species across China.
Cave mammals. The maximum temperature of the warmest month was found to mostly account for species richness of cave mammals (bats) (z = 4.14, P<0.001;Table 2). Our result can be explained by the bats’physiological features. As the bats lack the ability of thermoregu-latory control in the inactive state, their resting temperature and metabolic rate is dependent on the ambient temperature in the environment [72]. In addition, temperature can also have effects on bat species richness indirectly through food resources and availability [73–74]. It was discovered that bats prefer stable caves with the temperature higher than 13°C [75]. Our analy-sis partially supported the meta-analyanaly-sis of bat species richness at the global scale [76], which identified temperature and water availability as the major drivers of the bat species richness. The discrepancy between our analysis and previous study may result from the fact that bats are mostly distributed in southern China where relatively sufficient precipitation is not a promi-nent predictor for species richness of bats.
Wetland birds. Temperature annual range was the most important predictor of resident wetland birds in China (z = -10.88;Table 3). Most waterbirds aggregate in relatively small wet-land areas [77–78]. In addition, waterbirds do not inhabit the wetlands with low temperature and freezing in winter which prevents the birds from foraging. Resident wetland birds are mainly distributed in southern China with a warm and stable climate. By contrast, fewer resi-dent wetland birds inhabit northern China where temperature is low and shows large variabil-ity [42]. Thus, a stable habitat with suitable temperatures contributes dominantly to higher species richness of wetland birds.
richness was discovered in Ontario, Canada [82] and the Conterminous United States [83]. Thus, conservation policies should consider the land use change as an indispensible factor to protect wetland birds.
Hypotheses explaining mammal and bird species richness
Although we found support for the importance of energy, habitat heterogeneity and environ-mental stability hypotheses, their relative contributions to explaining patterns of species rich-ness varied strongly among habitat groups. The sets of prominent predictors of species richness in habitat groups were generally diverse. The habitat heterogeneity hypothesis was one of the two most important hypotheses for species richness of mammals, resident birds, for-est and shrub mammals and resident birds. The environmental stability hypothesis played the most important role in explaining variation of species richness of wetland birds, and the water-energy hypothesis played the most important role for desert birds. The ambient water-energy (tem-perature) hypothesis was the most important hypothesis for species richness of cave mammals. The synergistic effects of specialization and adaption to different habitats likely lead to differ-ences in species richness patterns of habitat groups. Therefore, understanding the richness gra-dients requires the appropriate de-composition of constituent groups.
Conclusions and Future Work
In summary, our analyses revealed a substantial divergence in geographical richness patterns among habitat groups and highlighted the group-specific and disparate environmental associa-tions that underpin them. Further studies are needed to identify habitat groups of animal spe-cies based on different purposes. Furthermore, our results clearly demonstrated how large-scale patterns of species richness were best viewed as the overlaid response of different groups to diverse environmental factors [6,84]. Understanding of the patterns, status and trends of biodiversity requires the identification and inclusion of different habitat groups. Our findings suggest that biodiversity surveys and monitoring will benefit from addressing many representa-tive habitat groups. As we demonstrate, a focus on overall species richness alone might lead to incomplete or misguided understanding of spatial patterns. Conservation policies and prioriti-zation strategies that consider a broad spectrum of habitat groups from multiple taxa will be more successful in safeguarding the multiple services of biodiversity.
Supporting Information
S1 Appendix. Checklist of mammals based on habitat groups.
(XLS)
S2 Appendix. Checklist of resident birds based on habitat groups.
(XLS)
S3 Appendix. Residuals of species richness of mammals and resident birds and their habitat groups.
(XLS)
S1 Fig. Flow diagram of the statistical methods.
(DOC)
S1 Table. Correlations between environmental variables.Number in the first row corre-sponds to the number of variables in the first column. 1-Mean annual precipitation. Spearman (two-sided) correlation was performed (n = 2376;, P<0.01;P<0.05).
S2 Table. Variables selected based on Spearman (two-sided) correlation analysis and uni-variate regression for species richness of mammals and resident birds and their habitat groups.Spearman (two-sided) correlation analysis between any two variables in each category was performed. The deviance of each variable in each category explaining species richness was calculated using univariate regression models. If the correlation coefficient between two vari-ables in a category was>0.7, we removed strongly intercorrelated variables and retained the variables that explained more deviance in univariate regression models.
(DOCX)
S3 Table. Top six predictors selected based on hierarchical partitioning analysis.P<0.05. (DOCX)
S4 Table. GLM multivariate models for the residuals of species richness of mammals and resident birds and their habitat groups.Six variables that explained most of the variance of the residuals of species richness were selected based on univariate regression models and hier-archical partitioning. The results of GLM multivariable regression based on six variables were listed with that based on 19 variables as a comparison.
(DOCX)
S5 Table. SLM multivariate models for species richness of mammals and birds and treating area as a variable in the models.Six variables that explained most of the variance of species richness were selected based on univariate regression models and hierarchical partitioning. We established the best multivariate model using GLM multivariable regression. To avoid inflation of type I errors and invalid parameter estimate owning to spatial autocorrelation, we then per-formed SLM multivariate regression (seeMethods). Species richness and all continuous vari-ables were log10-transformed (n = 2376;: Pr(>|z|)<0.05;: Pr(>|z|)<0.01;: Pr(>|z|)< 0.001).
(DOCX)
Acknowledgments
We thank the more than 500 field biologists and conservation staff from the Chinese Academy of Sciences (CAS), universities, research institutes and government bodies who made these data sets possible. We are grateful to Walter Jetz from Yale University for his discussion and comments on the manuscript. This work was funded by the National Key Technologies Research and Development Program (grants 2012BAC01B01, 2008BAC 39B06 and 2008BAC39B01) and the Biodiversity Conservation Program of China.
Author Contributions
Conceived and designed the experiments: HX MC C. Lei HD JW. Analyzed the data: HX MC JL YW. Wrote the paper: HX YC MC C. Lei. Developed the methods: MC HX. Collected the data: JW PC C. Lei C. Lian MC JL YW ZL HD.
References
1. Rohde K. Latitudinal gradients in species diversity: the search for the primary cause. Oikos. 1992; 65: 514–527.
2. Gaston KJ. Global patterns in biodiversity. Nature. 2000; 405: 220–227. PMID:10821282
3. Hawkins BA, Field R, Cornell HV, Currie DJ, Guégan J-F, Kaufman DM, et al. Energy, water, and
broad-scale geographic patterns of species richness. Ecology. 2003; 84: 3105–3117.
5. Qian H, Kissling WD. Spatial scale and cross-taxon congruence of terrestrial vertebrate and vascular plant species richness in China. Ecology. 2010; 91: 1172–1183. PMID:20462131
6. Carnicer J, Díaz-Delgado R. Geographic differences between functional groups in patterns of bird spe-cies richness in North America. Acta Oecologica. 2008; 33: 253–264.
7. Kerr JT, Packer L. Habitat heterogeneity as a determinant of mammal species richness in high-energy
regions. Nature. 1997; 385: 252–254.
8. Rahbek C, Graves GR. Multiscale assessment of patterns of avian species richness. Proceedings of the National Academy of Sciences. 2001; 98: 4534–4539.
9. Francis AP, Currie DJ. A globally consistent richness-climate relationship for angiosperms. The Ameri-can Naturalist. 2003; 161: 523–536. PMID:12776882
10. Hurlbert AH, Haskell JP. The effect of energy and seasonality on avian species richness and
commu-nity composition. The American Naturalist. 2003; 161: 83–97. PMID:12650464
11. Currie DJ, Mittelbach GG, Cornell HV, Field R, Guégan J-F, Hawkins BA, et al. Predictions and tests of
climate-based hypotheses of broad-scale variation in taxonomic richness. Ecology Letters. 2004; 7: 1121–1134.
12. Tang Z, Wang Z, Zheng C, Fang J. Biodiversity in China's mountains. Frontiers in Ecology and the
Envi-ronment. 2006; 4: 347–352.
13. Buckley LB, Jetz W. Environmental and historical constraints on global patterns of amphibian richness. Proceedings of the Royal Society B: Biological Sciences. 2007; 274: 1167–1173. PMID:17327208
14. Davies RG, Orme CD, Storch D, Olson VA, Thomas GH, Ross SG, et al. Topography, energy and the global distribution of bird species richness. Proceedings of the Royal Society B: Biological Sciences. 2007; 274: 1189–1197. PMID:17311781
15. Hortal J, Rodríguez J, Nieto-Díaz M, Lobo JM. Regional and environmental effects on the species rich-ness of mammal assemblages. Journal of Biogeography. 2008; 35: 1202–1214.
16. Currie DJ. Projected effects of climate change on patterns of vertebrate and tree species richness in the Conterminous United States. Ecosystems. 2001; 4: 216–225.
17. Wilson RJ, GutiÉRrez D, GutiÉRrez J, Monserrat VJ. An elevational shift in butterfly species richness
and composition accompanying recent climate change. Global Change Biology. 2007; 13: 1873–1887.
18. Iverson LR, Prasad AM. Potential changes in tree species richness and forest community types follow-ing climate change. Ecosystems. 2001; 4: 186–199.
19. Kerr J. Global biodiversity patterns: from description to understanding. Trends in Ecology & Evolution. 2001; 16: 424–425.
20. Palmer MW. Variation in species richness: towards a unification of hypotheses. Folia Geobotanica & Phytotaxonomica. 1994; 29: 511–530.
21. Luo Z, Tang S, Li C, Fang H, Hu H, Yang J, et al. Environmental effects on vertebrate species richness:
Testing the energy, environmental stability and habitat heterogeneity hypotheses. PLoS ONE. 2012; 7: e35514. doi:10.1371/journal.pone.0035514PMID:22530038
22. Koh CN, Lee PF, Lin RS. Bird species richness patterns of northern Taiwan: primary productivity,
human population density, and habitat heterogeneity. Diversity and Distributions. 2006; 12: 546–554.
23. Qian H, Ricklefs RE. Taxon richness and climate in angiosperms: Is there a globally consistent relation-ship that precludes region effects? The American Naturalist. 2004; 163: 773–779. PMID:15122494
24. Evans KL, Newson SE, Storch D, Greenwood JJD, Gaston KJ. Spatial scale, abundance and the spe-cies—energy relationship in British birds. Journal of Animal Ecology. 2008; 77: 395–405. PMID: 18005031
25. Qian H. Effects of historical and contemporary factors on global patterns in avian species richness. Journal of Biogeography. 2008; 35: 1362–1373.
26. Qian H. Environment—richness relationships for mammals, birds, reptiles, and amphibians at global and regional scales. Ecological Research. 2010; 25: 629–637.
27. Jetz W, Rahbek C. Geographic range size and determinants of avian species richness. Science. 2002;
297: 1548–1551. PMID:12202829
28. Tello JS, Stevens RD. Multiple environmental determinants of regional species richness and effects of geographic range size. Ecography. 2010; 33: 796–808.
29. Grönroos M, Heino J. Species richness at the guild level: effects of species pool and local environmen-tal conditions on stream macroinvertebrate communities. Journal of Animal Ecology. 2012; 81: 679–
691. doi:10.1111/j.1365-2656.2011.01938.xPMID:22220712
31. Shen SA. China’s Topography. Bejing: China Cartographic Publishing House; 2001.
32. Wu ZY, Sun H, Zhou ZK, Li DZ, Peng H. Floristics of Seed Plants from China. Beijing: Science Press;
2011.
33. Ying TS, Chen ML. Plant Geography of China. Shanghai: Shanghai Scientific and Technical Publish-ers; 2011.
34. Zhang RZ. Zoogeography of China. Beijing: Science Press; 2011.
35. Qian H, Wang XH, Wang SL and Li YL. Environmental determinants of amphibian and reptile species
richness in China. Ecography. 2007; 30: 471–482.
36. Chen SB, Jiang GM, Zhang JL, Li YG, Qian H. Species turnover of amphibians and reptiles in eastern China: disentangling the relative effects of geographic distance and environmental difference. Ecol Res. 2011; 26: 949–956.
37. Huang JH, Chen B, Liu CR, Lai JS, Zhang JL, Ma KP. Identifying hotspots of endemic woody seed plant diversity in China. Diversity and Distributions. 2012; 18: 673–688.
38. Huang JH, Chen JH, Ying JS, Ma KP. Features and distribution patterns of Chinese endemic seed plant species. Journal of Systematics and Evolution. 2011; 49: 81–94.
39. Wang ZH, Rahbek C, Fang JY. Effects of geographical extent on the determinants of woody plant
diver-sity. Ecography. 2012; 35: 1160–1167.
40. Wang ZH, Fang JY, Tang ZY, Lin X. Relative role of contemporary environmental versus history in
shaping diversity patterns of China’s woody plants. Ecography. 2012; 35: 1124–1133.
41. Ministry of Environmental Protection. China National Biodiversity Conservation Strategies and Action Plan. Beijing: Environmental Science Press; 2011.
42. Zheng GM. A Checklist on the Classification and Distribution of the Birds of China. Beijing: Science Press; 2011.
43. Wang YX. A Complete Checklist of Mammal Species and Subspecies in China: a Taxonomic and Geo-graphic Reference. Beijing: China Forestry Publishing House; 2003.
44. Editorial Committee of Fauna Sinicae. Fauna Sinicae. Beijing: Science Press; 1978–2012.
45. Mittelbach GG, Schemske DW, Cornell HV, Allen AP, Brown JM, Bush MB, et al. Evolution and the lati-tudinal diversity gradient: speciation, extinction and biogeography. Ecology Letters. 2007; 10: 315–
331. PMID:17355570
46. Fielding AH, Haworth PF. Testing the generality of bird—habitat models. Conservation Biology. 1995; 9: 1446–1481.
47. Trabucco A, Zomer RJ. Global Aridity Index (Global-Aridity) and Global Potential Evapo-Transpiration
(Global-PET) Geospatial Database. CGIAR Consortium for Spatial Information. 2009. Available:http:// www.cgiar-csi.org/.
48. Lamoreux JF, Morrison JC, Ricketts TH, Olson DM, Dinerstein E, Mcknight MW, et al. Global tests of biodiversity concordance and the importance of endemism. Nature. 2006; 440: 212–214. PMID: 16382239
49. Qian H, Ricklefs RE. Global concordance in diversity patterns of vascular plants and terrestrial
verte-brates. Ecology Letters. 2008; 11: 547–553. doi:10.1111/j.1461-0248.2008.01168.xPMID:18318717
50. Mac Nally R. Multiple regression and inference in ecology and conservation biology: further comments
on identifying important predictor variables. Biodiversity and Conservation. 2002; 11: 1397–1401.
51. R Development Core Team. R: a language and environment for statistical computing. R Foundation for Statistical Computing, Vienna, Austria. 2012. Available:http://www.r-project.org.
52. Graf RF, Bollmann K, Suter W, Bugmann H. The importance of spatial scale in habitat models: Caper-caillie in the Swiss Alps. Landscape Ecology. 2005; 20, 703–717.
53. Benitez-Lopez A, Vinuela J, Hervas I, Suarez F, Garcia JT. Modelling sandgrouse (Pterocles spp.) dis-tributions and large-scale habitat requirements in Spain: implications for conservation. Environmental Conservation. 2014; 41: 132–143.
54. Mac Nally R. Regression and model-building in conservation biology, biogeography and ecology: the distinction between—and reconciliation of–‘predictive’and‘explanatory’models. Biodiversity and Con-servation. 2000; 9: 655–671.
55. Chevan A and Sutherland M. Hierarchical partitioning. The American Statistician. 1991; 45: 90–96.
56. Rangel TF, Diniz-Filho JA, and Bini LM. SAM: a comprehensive application for Spatial Analysis in Macroecology. Ecography. 2010; 33: 46–55.
58. Freckleton RP. On the misuse of residuals in ecology: regression of residuals vs. multiple regression. Journal of Animal Ecology. 2002; 71: 542–545.
59. Hortal J, Lobo JM, JimÉNez-Valverde A. Limitations of biodiversity databases: Case study on seed-plant diversity in Tenerife, Canary Islands. Conservation Biology. 2007; 21: 853–863. PMID:17531062
60. Yang W, Ma K, Kreft H. Geographical sampling bias in a large distributional database and its effects on
species richness—environment models. Journal of Biogeography. 2013; 40: 1415–1426.
61. Moreno-Rueda G, Pizarro M. The relative influence of climate, environmental heterogeneity, and human population on the distribution of vertebrate species richness in south-eastern Spain. Acta Oeco-logica. 2007; 32: 50–58.
62. Lin X, Wang ZH, Tang ZY, Zhao SQ, Fang JY. Geographic patterns and environmental correlates of ter-restrial mammal species richness in China. Biodiversity Science. 2009; 17: 652–663.
63. Ding TS, Yuan HW, Geng S, Koh CN, Lee PF. Macro-scale bird species richness patterns of the East Asian mainland and islands: energy, area and isolation. Journal of Biogeography. 2006; 33: 683–693.
64. Liu C, Zheng CY, Zhang T, Zeng FX, Wang YR. Geographic patterns of avian species richness in China and their environmental factors. Acta Scientiarum Naturalium Universitatis Pekinensis. 2014; 50: 429–438.
65. Poulsen B. Avian richness and abundance in temperate Danish forests: tree variables important to birds and their conservation. Biodiversity and Conservation. 2002; 11: 1551–1566.
66. Rovero F, Menegon M, FjeldsåJ, Collett L, Doggart N, Leonard C, et al. Targeted vertebrate surveys
enhance the faunal importance and improve explanatory models within the Eastern Arc Mountains of Kenya and Tanzania. Diversity and Distributions. 2014; 20: 1438–1449.
67. UNEP—WCMC. Mountains and Mountain Forests. Cambridge, UK: World Conservation Monitoring
Centre; 2002.
68. Li L, Wang Z, Zerbe S, Abdusalih N, Tang Z, Ma M, et al. Species richness patterns and water-energy dynamics in the drylands of northwest China. PLoS ONE. 2013; 8: e66450. doi:10.1371/journal.pone. 0066450PMID:23840472
69. Xia Y, Moore DI, Collins SL, Muldavin EH. Aboveground production and species richness of annuals in Chihuahuan Desert grassland and shrubland plant communities. Journal of Arid Environments. 2010; 74: 378–385.
70. Zhao X, Tan K, Zhao S, Fang J. Changing climate affects vegetation growth in the arid region of the northwestern China. Journal of Arid Environments. 2011; 75: 946–952.
71. Yan Y, Yang X, Tang Z. Patterns of species diversity and phylogenetic structure of vascular plants on the Qinghai-Tibetan Plateau. Ecology and Evolution. 2013; 3: 4584–4595. doi:10.1002/ece3.847 PMID:24340197
72. Hock RJ. The metabolic rates and body temperatures of bats. The Biological Bulletin. 1951; 101: 289–
299.
73. Graham GL. Changes in bat species diversity along an elevational gradient up the Peruvian Andes. Journal of Mammalogy. 1983; 64: 559–571.
74. Szewczak JM, Szewczak SM, Morrison ML, Hall LS. Bats of the White and Inyo Mountains of
Califor-nia-Nevada. Great Basin Naturalist. 1998; 58:66–75.
75. Zhang CJ, Wu Y. Habitat selection, ecological roles and conservation of cave bats. Bulletin of Biology. 2006; 41: 4–6.
76. McCain CM. Could temperature and water availability drive elevational species richness patterns? A global case study for bats. Global Ecology and Biogeography. 2007; 16: 1–13.
77. Rogers DI, Yang H, Hassell CJ, Boyle AN, Rogers KG, Chen B, Zhang Z, Piersma T. Red Knots (Cali-dris canutus piersmai and C. c. rogersi) depend on a small threatened staging area in Bohai Bay, China. Emu. 2010; 110: 307–315.
78. Stralberg D, Cameron DR, Reynolds MD, Hickey CM, Klausmeyer K, Busby SM, et al. Identifying
habi-tat conservation priorities and gaps for migratory shorebirds and waterfowl in California. Biodiversity and Conservation. 2011; 20: 19–40.
79. Ma Z, Wang Y, Gan X, Li B, Cai Y, Chen J. Waterbird population changes in the wetlands at Chongming Dongtan in the Yangtze River Estuary, China. Environmental Management. 2009; 43: 1187–1200. doi: 10.1007/s00267-008-9247-7PMID:19139954
80. Zhang J, Ma K, Fu B. Wetland loss under the impact of agricultural development in the Sanjiang Plain,
NE China. Environmental Monitoring and Assessment. 2010; 166: 139–148. doi: 10.1007/s10661-009-0990-xPMID:19475485
82. Findlay CS, Houlahan J. Anthropogenic correlates of species richness in southeastern Ontario wet-lands. Conservation Biology. 1997; 11: 1000–1009.
83. Rittenhouse CD, Pidgeon AM, Albright TP, Culbert PD, Clayton MK, Flather CH, et al. Land-cover change and avian diversity in the Conterminous United States. Conservation Biology. 2012; 26: 821–
829. doi:10.1111/j.1523-1739.2012.01867.xPMID:22731630
84. Terribile LC, Diniz-Filho JAF, Rodríguez MÁ, Rangel TFLVB. Richness patterns, species distributions