ISSN: 2067-533X
INTERNATIONAL JOURNAL
OF
CONSERVATION SCIENCE
Volume 3, Issue 4, October-December 2012: 325-338 www.ijcs.uaic.ro
EFFECTS OF DEFORESTATION AND FOREST DEGRADATION ON
FOREST CARBON STOCKS IN COLLABORATIVE FORESTS, NEPAL
Ram Asheshwar MANDAL1*, Ishwar Chandra DUTTA2, Pramod Kumar JHA1, Sidhibir KARMACHARYA1, Kamalesh YADAV3, Bechu YADAV4,
Utsaw THAPA5, Samsul HAQUE6
1 Department of Botany, Tribhuvan University 2 Tribhuvan University Commission
3
Leasehold programme, Food Agriculture Organization, Nepal
4 Department of Forests, Nepal
5 Regional Training Centre, Biratnage, Nepal 6 Institute of Forests, Hetauda Campus, Nepal
Abstract
There are some key drivers that favor deforestation and forest degradation. Consequently, levels of carbon stock are affected in different parts of same forest types. But the problem lies in exploring the extent of the effects on level of carbon stocking. This paper highlights the variations in levels of carbon stocks in three different collaborative forests of same forest type i.e. tropical sal (Shorea robusta) forest in Mahottari district of the central Terai in Nepal. Three collaborative forests namely Gadhanta-Bardibas Collaborative Forest (CFM), Tuteshwarnath CFM and Banke- Maraha CFM were selected for research site. Interview and workshops were organized with the key informants that include staffs, members and representatives of CFMs to collect the socio-economic data and stratified random sampling was applied to collect the bio-physical data to calculate the carbon stocks. Analysis was carried out using statistical tools. It was found five major drivers namely grazing, fire, logging, growth of invasive species and encroachment. It was found highest carbon 269.36 ton per ha in Gadhanta- Bardibash CFM. The findings showed that the levels of carbon stocks in the three studied CFMs are different depending on how the drivers of deforestation and forest degradation influence over them.
Keywords: Collaborative forest; REDD+; deforestation; degradation; carbon stock.
Introduction
Reducing Emissions from Deforestation and Forest Degradation (REDD+) is considered as the major effective and efficient measure to address the issues of climate change but the clear analysis of drivers of deforestation and forest degradation and adapting the appropriate management options are essential to operate REDD+ properly. Avoiding deforestation and forest degradation can reduce 17.4% emission from the atmosphere, globally. Hundreds of millions of people struggle with poverty around the world and most of them are dependent on the forest products. Obviously, managing the forests means first to manage the poor forest
*
dependant people [1-3]. Hence, REDD+ has prime focuses on managing the forests and forest dependant people.
Globally, the net change in forest area in the period 2000–2010 was estimated at -5.2 million hectares per year down from -8.3 million hectares per year in the period 1990–2000 [4]. The tropical forest has a great importance in the world but present alarming deforestation is a big challenge [5, 6]. The tropical deforestation was 14.2 million ha per year during 1990- 2000, it was about 1 % of the tropical forest. A net annual forest loss was about 7.3 million hectares for 2000-2005 [7] and it accounted about 15% of the world's global warming [8].
Southeast Asia experienced the largest decline in forest since last ten years, with an annual net forests loss of more than 0.9 million hectares [9]. However, when compared with figures for 1990–2000 (-2.4 million hectares per year), this represented a significant drop. The gross deforestation during the 1990's was 2.8 million in Asia. The deforestation occurs in diverse circumstances which obscure underlying patterns and it has multiple causes with the particular mix of causes varying from place to place [10, 11].
About 84,000 hectare of forest land became deforested annually between 1991 and 2001in Nepal [12]. Out of this annual deforestation was nearly 10000 hectares in Tarai which was about 1.7%. Nepal has lost forest cover at the rate of nearly 2% per annum. However, there was positive change in forest cover about 0.25% in Mahottary district in between 1991 to 2001, the reason behind it may be due to plantation and community forest management activities [13]. In reality, the present situation is different seeing the high rate of deforestation and forest degradation. Realizing this Nepal has started to practice another unique model of forest management in Terai, that is collaborative forest management (CFM) which focuses on managing large blocks of forest with involvement of distant users. However, the management of drivers of deforestation and forest degradation is risky job, especially in Terai than hills because of their diverse nature and level of damaging.
There are many causes of deforestation and forest degradation in Mahottary district. Infact, community forests are almost protected but logging is shifted to the adjoining collaborative forests. Drivers and underlying causes of deforestation and forest degradation are varied even in different collaborative forests so how they are differed and what are the common drivers casing deforestation and forest degradation in these collaborative forests is essential part of study. Surely, these drivers and their underlying causes have resultant effects on forest carbon stock, hence how they are affecting on status of carbon stocks of these forests are other major part of the study. Moreover, if the management and protection organizations function properly to counteract against the drivers and their underlying causes, the deforestation and forest degradation can be halted but it is matter of concern that, are these organizations are acting well? If not there may be negative effects on carbon stocks of these CFMs, so how they are affected is another essential part of study.
Therefore, this research has aims to explore the drivers of Deforestation and Forest Degradation in collaborative forests, to illustrate the effects of institutional mechanism on forest carbon stocks in collaborative forests and to show the differences in forest carbon stocks in collaborative forests due to effect of deforestation and forest degradation.
Materials and Method
Research site
Mahottary district in central part of Nepal was selected for study area. This district is situated in 26° 36' to 28° 10' North and 85° 41' to 85° 57' East. The temperature ranges between 20-25°Celsius and average annual rain fall recorded between 1100-3500mm.
robusta) and other species were Saj (Terminalia tomentosa), Botdhairo (Lagerstroemia parviflora), Harro (Terminalia chebula) and Barro (Terminalia belerica).
.
Fig. 1. Nepal Map and research site
Data Collection
Socio-economic and bio-physical data were collected to meet the objectives.
Socio-economic data
Socio-economic data includes information regarding drivers and underlying causes of deforestation and forest degradation as well as effects of forest management and protection units on forest carbon stock. So, key informants interview and workshops were organized to gather the data.
Firstly, the questionnaires were developed to list out the main drivers and underlying causes of deforestation and forest degradation discussing with forest expert team. These questionnaires were tested in small group interview with staff of district forest offices to finalize them. Secondly, interview was carried out with selected key informants to prepare the draft list of drivers of deforestation and forest degradation. Thirdly, another workshop was organized with users of the collaborative forests and executive members to know the variations in drivers and underlying causes of deforestation and degradation as well as how these agents affect in each collaborative forest.
Similarly data regarding the forest management and protection units were gathered from questionnaire survey organizing informal interaction in the field. It was focus on how the management and protection institutions were functioning in minimizing the rate of deforestation and forest degradation.
Bio-physical data a. Sampling Design
The stratified random sampling was applied to gather the bio-physical data. So, collaborative forests were divided into three main strata namely regeneration, pole and tree strata based on stage of the forest.
Hence, 32, 33 and 31 samples were collected from Banke- Maraha CFM, Tuteshwarnath and Gadhanta –Bardibas CFMs respectively.
Firstly, the collaborative forests were surveyed using the GPS receiver and maps of the forests were prepared. Then forests were divided into three major strata like regeneration, pole and tree. Latter, sample plots were distributed on each stratum of the map. Then, the coordinates of sample plots were uploaded in GPS.
Secondly, sample plots were established in the field by navigating the uploaded GPS coordinates. So, the plots were fixed according to the nature of the stratum. The tree stratum 20mx25m sample plot was established and nested plots for poles (10mx10m), sapling (5mx5m), seedling (5mx2m) and litter, herbs and grasses (1mx1m) were established simultaneously [16]. Similarly, soil sample was fixed in the centre of plot.
b. Data generation
Height and diameter of sapling, poles and trees (dbh>5cm) were measured from determined sample plot. Then, sapling (dbh >1cm and <5cm) seedlings, herbs and shrubs were counted and their fresh weights were taken. The soil samples were collected from three different depths 0-10, 10-30 and 30-60 cm in order to determine the soil carbon [17, 18].
The socioeconomic data were analyzed applying the descriptive analysis. Similarly, the bio-physical data were analyzed to assess the variation in carbon in collaborative forests due to drivers of deforestation and forest degradation. All results of damages on carbon stocks of regeneration, HGL and pole and trees were reported as significant at 0.05 probability multiple comparisons of means were performed with Tukey’s test by using software SPSS [19]
Calculation of forest carbon stock
It is essential to calculate the forest biomass before determining the carbon except soil. Therefore, Above Ground Tree dry Biomass (AGTB) was calculated by using equation (1)
AGTB = 0.0509 x ρ D2H (1)
This is given by Chave etal [20] for dbh (sapling, poles and tree)> 5cm. then, above ground sapling biomass having DBH<5cm was calculated by applying the formula compiled by Tamrakar [21] and its sample was taken to get dry biomass as this allometric equation provide only the fresh weight. So, samples of sapling (DBH<5cm ), seedling, leaf litter, herbs and grass (LHG) together were carried out to dry in the lab and their dry biomass was calculated using unitary method. Moreover, the root biomass was calculated by using root shoot ratio 12.5% . The biomass was converted into carbon by multiplying with 0.47%.
The carbon content in the soil was analyzed by Walkley Black Method [22].
Bulk Density (BD g/cc) = (oven dry weight of soil)/ (volume of soil in the core) (2)
SOC = Organic Carbon Content % x Soil Bulk Density (Kg/cc) x thickens of horizon. (3)
Total Carbon = Total Biomass carbon + Soil carbon (4)
Results
Drivers of deforestation and forest degradation
As shown in figure 2, it was found that there were five major drivers and many underlying causes of deforestation and forest degradation in these collaborative forests. However, twelve causes were listed as major underlying causes that had been resulting in deforestation and forest degradation but effects of these underlying causes are not same.
Forest Fire and grazing
The forest fire is very common in all collaborative forest but grazing was less common in Gadhanta - Bardibash collaborative forest. The underlying causes of the forest fire is intentional fire and carelessness while the underlying causes of grazing were keeping high number of low productive livestock, limited alternatives for fodder and grasses and traditional system of grazing.
Fig. 2. Drivers of deforestation and forest degradation
Invasive species
It was observed that where canopy was opened and forest fire and grazing pressure were high, the invasive species like Lantana camara, Cassia tora, Mikania micarantha and Ipomoea quamoclit flourished well. The result showed that there was high pressure of invasive species in Tuteshwarnath CFM and it was followed by Banke-Maraha collaborative forest and Gadhanta- Bardibash CFMs.
Logging
There were many underlying causes of illegal logging. They are: increasing population and poverty and lack of livelihood alternatives, limited access to alternatives for fuel wood and timber, inefficient forest fuel wood and timber use, weak law enforcement and impunity due to weak governance, inefficient distribution mechanisms of timber and firewood, high cross border demand of forest products, insufficient technical inputs, greediness of the people (staff and others even police) to generate money and increasing unemployment.
types of effects were also common in all collaborative forests however level of effects was differed. It was found that, there was high logging in Banke Maraha and it was followed by Tuteshwarnath CFM, Gadhanta- Bardibash CFM.
It was found that cross border problem of logs was serious in Banke- Maraha and Tuteshwarnath collaborative forests because smugglers used to export logs from these forests to India. The smugglers get high price NRs 4000-5000 per cubic feet for selling the timbers to India while if they sell in local market price was NRs 1000- 2000 per cft. Moreover, the price was NRs 500-800 low when they sell in local area and royalty of grade log A is NRs 800. This problem was not observed in Gadhanta- Bardibash CFM. There was a bitter fact that the loggers use the students studying in grade 9, 10 and 11 of Khayarmara higher secondary school in illegal logging from Banke- Maraha CFM so what will be the future of such students is a serious matter.
Though Gadhanta- Bardibash CFM is very close to growing small town Bardibash but most of people here used biogas for cooking and some hotels used firewood. Generally people said that, the firewood was brought from Sagarnath plantation project and Banke Maraha and Tuteshwarnath CFM areas. Therefore, it was less effect of firewood collection on Gadhanta- Bardibash CFM. Moreover, annually about 5-10 houses were constructed at Bardibash and there are high demands of timber but the supply of this is from community forests and government managed forests of Churia area. Thus, there is low pressure of timber on Gadhanta- Bardibash CFM.
Encroachment
The encroachment was common in all collaborative forests however underlying causes of it were not common. For instance local and temporary market was expanding in Tuteshwarnath and Gadhanta- Bardibash CFMs but it was happened in Banke- Maraha CFM. Temples were made in all collaborative forests while old settlements were more influencing in Banke- Maraha than Gadhanata- Bardibash CFM but it was not found in Tuteswarnath CFM. Altogether 10.1 ha forest area was deforested, out of this 2 ha was seen in Tuteshwarnath CFM, 5.5 ha in Banke- Maraha CFM and 2.5 ha were in Gadhanta- Bardibash CFM. The armed police camp was built at Gadhanta- Bardibash CFM area and temporary armed police post was at Banke- Maraha CFM and it was absent in Tuteshwarnath CFM area. East-west highway and high tension line are common in all CFMs.
Carbon Stock in Collaborative Forests
The estimated carbon stock per ha was highest 274.670 ton in Gadhanta- Bardibash CFM while it was least 197.113 ton per ha in Banke- Maraha CFM and the estimated carbon stock of Tuteshwarnath CFM was found about 222.580 ton per ha. Similar studies also support this work.
Forest Carbon Stock (C ton/ha) in collaborative forests
Carbon stock in Herbs, Litter and Grasses was found highest 6.325 ton/ ha in Gadhanta- Bardibash CFM and least 3.603 ton/ ha in Banke- Maraha CFM whereas the estimated carbon stock of seedling was highest in Banke- Maraha CFM (6.792 ton C/ ha) and least in Tueswahrnath (3.578 ton C/ ha). Moreover, the carbon stock in Sapling was found to be highest in Gadhanta - Bardibash CFM (nearly 7.139 C ton/ha) and least in Tuteshwarnath CFM (about 6.124 ton C /ha).
Fig. 3. Carbon stock ton/ha in Banke-Maraha collaborative forest
Fig. 4. Carbon stock ton/ ha in Tuteshwarnath collaborative forest
Fig. 5. Carbon stock in Gadhanta-Bardibash collaborative forest
of tree, Gadhanta- Bardibas (103.020 ton)> Tuteshwarnath (81.958 ton)> Banke- Maraha (79.379 ton) CFMs.
The result showed variation in carbon stocks of tree and pole biomass was high. Obviously, people used timber prepared from logs of tree and pole for construction work and smugglers accordingly focus to supply these logs. The consequences were seen large variation in carbon stock of pole and tree biomass in these collaborative forests.
Contribution of Carbon stocks according to stage of the plant
As shown in table 1, the carbon stock was varied according to the stage of plant. It was found that average carbon stocks of these three collaborative was 230.56 ton/ha. Here, the carbon stock of tree was highest with 38.39% and it was followed by root and pole having value 19.44% and 21.05%. So any changes in carbon stock of tree and pole have valuable contribution in total carbon stock. There was about very less contribution of carbon of HGL, Seedling and sapling nearly 2%.
Table 1. Carbon stock of different stages of plant
Types HGL Seedling Sapling Root Pole Soil Tree Total
Mean c ton/ha 4.65 5.19 6.60 48.55 44.82 32.25 88.50 230.56
% carbon 2.02 2.25 2.86 21.06 19.44 13.99 38.39 100.00
Total Forest Carbon stock in collaborative forests
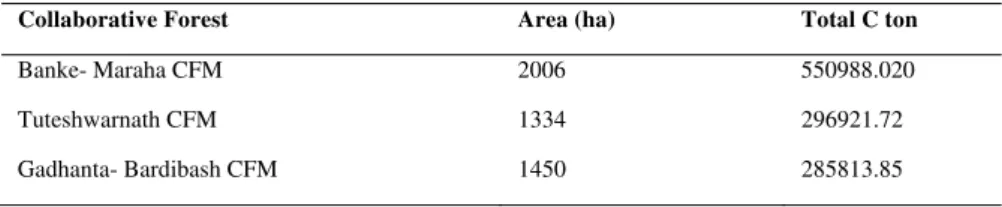
As shown in table 2, the estimated total carbon stock was varied according to area of collaborative forests. As the area of Banke – Maraha CFM was the largest (2006 ha) the total C stock was also highest about 550988.020 ton. However, the area of Tuteshwarnath CFM was 1334 ha less than the area of Gadhanta- Bardibash CFM 1450 ha., the total estimated carbon stock was more in former CFM (296921.72 ton) than in latter CFM (285813.85 ton).
Table 2. Total Forest Carbon Stock
Collaborative Forest Area (ha) Total C ton
Banke- Maraha CFM 2006 550988.020
Tuteshwarnath CFM 1334 296921.72
Gadhanta- Bardibash CFM 1450 285813.85
Discussion
Drivers of deforestation and forest degradation
The main drivers of deforestation and forest degradation were illegal logging, grazing, forest fire, invasive species, encroachments in theses collaborative forests and their underlying causes are opening crown, intentional fire, market failure, weak governance, increasing population and poverty. This finding was supported by different types of studies. It was found similar types of drivers of deforestation and forest degradation in Readiness Plan Idea Note (R-PIN) of Nepal [23] and nine major drivers were listed in preliminary report during the preparation of Readiness Preparation Proposal (R-PP) [24] Nepal. The illegal logging was the major drivers of deforestation and forest degradation in Nepal [9].
forest fire sweeps through the understory and livestock eats or tramples seedlings and saplings are very common drivers in tropical forests like Nepal.
Encroachment for building road, temples, offices, high tension line and telephone line were common underlying causes of deforestation and forest degradation which were also supported by study done by Angelsen [26] and Hiemstra [27] and population growth in developing countries during the 1970s and 1980s led to substantial encroachment on forests throughout the tropics.
Variation in Carbon Stocks in Forests
The estimated carbon stock per ha was highest 274.670 ton in Gadhanta- Bardibash CFM while it was least 197.113 ton per ha in Banke- Maraha CFM and the estimated carbon stock of Tuteshwarnath CFM was found about 222.580 ton per ha. Similar studies also support this work.
The pilot study done in Kayarkhola watershed in community forest showed that 276.5 ton C/ha, the inventory done by Rana [28] while it was found different in studies done in Terai Arc Landscape that there was 206.15 ton C/ha in government managed forests, 240 ton C/ha in community forests and 274.58 ton C/ha in protected forests, the inventory was carried out by Manandhar [29].
Effects of Drivers of Deforestation and Forest Degradation on Forest Carbon
As shown in table 3, the regeneration like seedling and sapling were damaged due to forest fire, grazing and invasive species. Similarly, the herbs, grasses and litter were also damaged by fire and grazing. However serious damages were seen in pole and trees which are converted into timber for local use and smuggling on that loggers have vested interests. In addition, there is the highest contribution of carbon by poles and trees so any damage in this stage of plants has significantly high variation in carbon stock.
Table 3. Effect of drivers of deforestation and forest degradation on different stages of plants
Stage of the plants Types of drivers and their damage Remarks
Regeneration (seedling & sapling)
Generally, forest fire and grazing damage the regeneration stage of the plants
Invasive species also damage the regeneration
Annual Timber collection (cft) from CFM Based
Fig. 1. Collection of timber of different CFMs
Effects of Protection and Management Unit
The Management and Protection organizations are also playing vital positive role to reduce the deforestation and forest degradation. In this context, there are five major institutions namely CFM representatives, Range post, Ilaka, District Forest Office and Security (arm police camp) are functioning to control the illegal logging.
These institutions have not effective equally in protection and management of these collaborative forests. It was found that patrolling works were conducted jointly by these institutions to control the illegal logging of these collaborative forests. However, it was most effective in Gadhanta- Bardibash CFM in comparison to others, Though there were a range post and representatives in Tuteshwarnath CFM but there is less patrolling work here than other CFM areas. Patrolling work is also irregular in Banke- Maraha CFM, although there are Ilaka, Rangepost, temporary arms post and watcher of CFMs. Indeed, the loggers are more active during the festival and rainy season when protection units have difficulties to organize the patrolling work because of leave in festival and difficult to drive (rains) the vehicles.
Other noticeable fact was found that staff of Tuteshwarnath and Banke- Maraha CFM was very irregular because of less monitoring and evaluation system but it was very regular in Gadhanta- Bardibash CFM. The reason of the irregularity is low payment and it needs to pay fare to reach Tuteshwarnath and Banke- Maraha CFM while Gadhanta- Bardibash CFM is close to Bardibash Market where most of staffs stay. It was heard that sometimes greedy staff also involved in smuggling activities it was more frequent in Banke- Maraha and Tuteshwarnath CFM.
Moreover, CFM representatives also play a vital role to control the illegal logging. It was found that representatives of Gadhanta- Bardibash CFM were very active but it was less active in Banke- Maraha CFM and Tuteshwarnath CFM. In addition, political pressure influences in law enforcement against the illegal loggers.
CFM. Hence, collective actions are fruitful to control deforestation and forest degradation and restore the affected forests.
The finding was supported by several authors in different ways. Agrawal and Ostrom [30] stated that, the coalition of actors in forest management respecting the local knowledge can play a vital role to add in work efficiency in halting the deforestation and forest degradation and storing degraded resource. Share management responsibility with either local communities or a range of stakeholders plays a vital role in Terai's forest management. Other similar thought supported by Adhikari etal [31] that the development of community-based resource management has led to devolution of forest management from centralized government control to local user groups. Similarly, empty, idle, and “natural” environments need protection from harmful large-scale developers, loggers, and ranchers, as well as from farmers, hunters, and gatherers but collective action is significant. Co-management involving the community can play a vital role to manage the forest of Nepal’s Terai rather than working only with traditional institution in this dynamic condition of Terai. Amy and Elinor [32] and Nagendra etal [33] suggested that to sustain long-term use of renewable resource systems like forests, collective action is needed to limit resource use and to undertake various forms of active management.
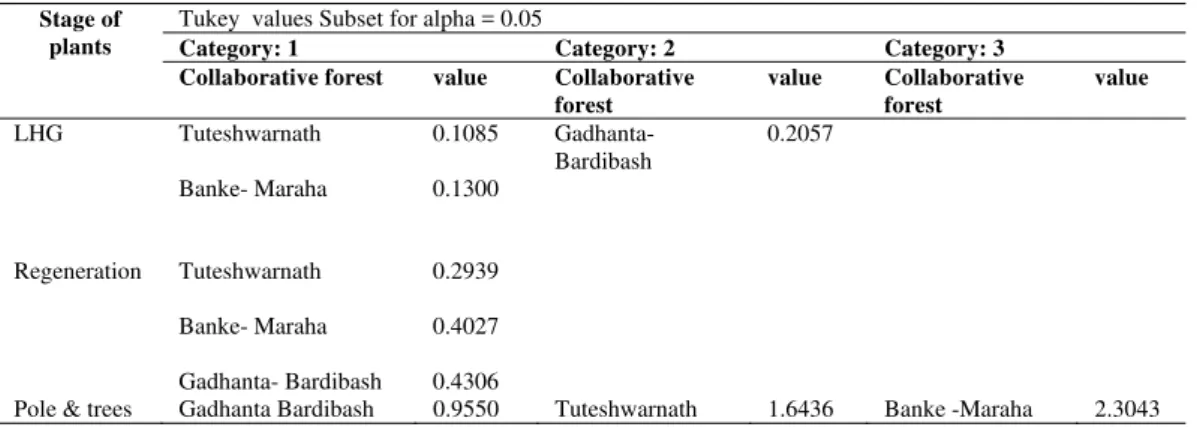
Table 4. Statistical Analysis
Stage of plants
Tukey values Subset for alpha = 0.05
Category: 1 Category: 2 Category: 3
Collaborative forest value Collaborative forest
value Collaborative forest
value
LHG Tuteshwarnath
Banke- Maraha
0.1085
0.1300
Gadhanta- Bardibash
0.2057
Regeneration Tuteshwarnath
Banke- Maraha
Gadhanta- Bardibash
0.2939
0.4027
0.4306
Pole & trees Gadhanta Bardibash 0.9550 Tuteshwarnath 1.6436 Banke -Maraha 2.3043
As shown in table 4, the Tukey's significance post hoc test showed there was not so variation in carbon stocks of LHG in Tuteshwarnath and Banke Maraha- Maraha CFM but it was differed in Gadhanta and Bardibas. In case of regeneration, no variation was found in carbon stock in these CFMs while clear variation was seen in carbon stocks of pole & tress among three CFMs. It indicated that minor there was less variation in damages done by grazing, fire and invasive species which was observed on carbon stock of LHG. Moreover, there was less effect of timber logging on pole and trees in Gadhanta- Bardibash CFM and it was followed by Tuteshwarnath and Banke- Maraha CFMs. Hence, there was high pressure of logging (timber and firewood extraction) on Banke- Marha CFM and followed by Tuteshwarnath and Banke- Maraha CFMs.
Conclusions
was common in these both collaborative CFMs but it was less in Gadhanta- Bardibash CFM. Moreover, domestic use of timber and firewood was also most common in Banke- Maraha CFM since community forest users use the products of CFM and protect their community forests among others. So, the estimated carbon stock per ha was low in Banke- Maraha and Tuteshwarnath CFMs with 197.113 ton and 222.580 ton respectively than in Gadhanta- Bardibash CFM with 274.670 ton.
Similarly, protection and management units were very effective in Gadhanta – Bardibash CFM because it is very near to all protection organization.
Recommendations:
• It is essential to find the local drivers and underlying causes of deforestation and forest degradation so that options can be suggested strategically
• The intensive studies should be carried out in other districts too so that the database of forest carbon stock can be prepared
Acknowledgements
I respectfully acknowledge Dr. Ram Kailash P. Yadav, Dr. Bharat Babu Shrestha, Assistant Professor in TU and Dr. Dr. Bishnu Hari Pandit, principle in Kathmandu Forestry College for their encouragement to write this article.
References
[1] M.S. Ashton, C. Gunatilleke, B. Singhakumara, and, I. Gunatilleke, Restoration pathways for rain forest in southwest Sri Lanka: A review of concepts and models, Forest Ecology and Management, 154, 2001, pp. 409-430.
[2] N. Delpierrea, K. Soudania, B, C. Franc ¸ G. Le Mairec, C. Bernhoferd, W. Kutsche, L. Missonf, S. Rambalf, T. Vesalag, E. Dufrênea, Quantifying the influence of climate and biological drivers on the interannual variability of carbon exchanges in European forests
through process-based modeling, Agricultural and Forest Meteorology,154-155, 2012,
pp. 99– 112.
[3] T. Durak, Changes in diversity of the mountain beech forest herb layer as a function of the
forest management method, Forest Ecology and Management,276, 2012, pp. 154–164.
[4] FRA, State of the World's Forests, Food and Agriculture Organization of the United Nations, Rome, Italy, 2011.
[5] P.S. Roy, C.B.S. Dutta, P.K. Joshi, Tropical forest resource assessment and monitoring,
Tropical Ecology,43(1), 2002, pp. 21-37.
[6] F. William Laurance, Reflections on the tropical deforestation crisis, Biological Conservation,91, 1999, pp. 109-117.
[7] T.P. Upadhyay, P.L. Sankhayan, B. Solberg, A Review of Carbon Sequestration Dynamics in the Himalayan Region as a Function of Land-use Change and Forest/Soil Degradation
with Special Reference to Nepal, Agriculture, Ecosystems and Environment, 105, 2005,
pp. 449-465.
[9] J. Geist Helmut & F. Lambin Eric, What Drives Tropical Deforestation?: A meta-analysis of proximate and underlying causes of deforestation based on subnational case study
evidence, LUCC Report Series4, CIACO, Louvain-la-Neuve, .2001, pp. 138-142.
[10] M. Skutsch, P. Van Laake, REDD as Multi-level governance in Making, Energy and Environment, 19(6), 2009, pp. 831-844.
[11] E. Ramsteiner, Governance Concepts and their application in Forest Policy Initiatives from Global to Local Levels, Small Scale Forestry,8, 2009, pp.143-158.
[12] S.K. Pandit, J.K. Sharma CBS, Environment Statistics of Nepal, Centre Bureau of Statistics, Kathmandu, Nepal, 2008.
[13] B.R. Kandel, R.R. Sharma, G.J. Thapa, M.K. Shrestha, Forest Cover Change Analysis of the Terai Districts, Department of Forests, Kathmandu, Nepal, 2005.
[14] K.G. MacDicken, A Guide to Monitoring Carbon Storage in Forestry and Agroforestry
Projects, Winrock International Institute for Agricultural Development, Arlington VA
(US), 1997.
[15] S.D. Moore, P.G. McCabe, Introduction to the Practice of Statistics, M.H. Freeman and Company, New York, Prude University, 2003.
[16] B.R. Kandel, C. Rai, R. Subedi, D. Paudel, R.B. Shrestha, G. Paudel, M.R. Maharjan,
Community Forest Resource Inventory Guideline, Community Forests Division,
Department of Forests, Kathmandu, Nepal, 2003.
[17] S. Eggleston, L. Buendia, M. Kiyoko, T. Nygra, T. Kiyoto, IPCC, Guidelinesfor National
Greenhouse Gas Inventories, National Greenhouse Gas Inventories Programme, IGES,
Japan, 2006.
[18] A. Chabbra, S. Palriya, V.K., Dadhwal, Soil Organic Carbon Pool in Indian Forest,Forest Ecology and Management,14, 2002, pp. 87-101.
[19] S. Unger, C. Maguas, S.J. Pereira, T.S. David, C. Werner, Interpreting post-drought rewetting effects on soil and ecosystem carbon dynamics in a Mediterranean oak
savannah, Agricultural and Forest Meteorology, 154–155, 2012, pp. 9– 18.
[20] J. Chave, C. Andalo, C. Brown, Tree allometry and improved estimation of carbon stocks and balance in tropical forests, Oecologia,145, 2005, pp. 87–99.
[21] P.R Tamrakar, Biomass and Volume Tables with Species Description for Community
Forest Management, Ministry of Forests and Soil Conservation, Kathmandu, Nepal,
1995.
[22] A.E. Walkley, J.A. Black, An Examination of the Method for Determining Soil Organic
Method, and Proposed Modification of the Chromic Acid Titration Method, Soil Science
37,1958, pp.29-38.
[23] J.C. Baral, P.R Tamrakar R.A. Mandal, D.C. Pokhrel, R.K. Kotru, Readiness Plan Idea
Note (R-PIN),Ministry of Forests and Soil Conservation,Kathmandu, Nepal,2000.
[24] K.P. Acharya, R.B. Dangi, K.P. Khanal, M.V. Linden, P. Branney, S. Dangal, Readiness
Preparation Proposal,Ministry of Forests and Soil Conservation, Kathmandu, Nepal,
2010.
[25] K.P. Acharya, Unfavourable structure of forest in the Terai of Nepal needs immediate management, Banko Janakari, 10(2), 2000, pp. 25–28.
[26] A. Angelsen, Policies for reduced deforestation and their impact on agricultural
production, Proceedings of the National Academy of Sciences, 2010, pp.107-117.
[28] E.B. Rana, Processes and Experiences,REDD+ and Conflict: A Case Study of the REDD Pilot Project in Nepal, International Centre for Integrated Mountain Development (ICIMOD), Nepal, 2011.
[29] Y. Manandhar, REDD Readiness and Monitoring, Reporting and Verification, Lesson Learned from Field, WWF, Nepal, 2010.
[30] A. Agrawal, A. Ostrom, Collective Actions, Property Rights and Decentralization in Resource Use in India and Nepal, Politics and Society, 29, 2001, pp. 485-514.
[31] B. Adhikari, S.D. Falco, J.C. Lovett, Analysis Household characteristics and forest dependency. Evidence from common property forest management in Nepal, Ecological Economics,48, 2004, pp. 245– 257.
[32] R.P. Amy, O. Elinor, Heterogeneity, Group Size and Collective Action. The Role of
Institutions in Forest Management, Development and Change,35(3), 2004, pp. 435–461.
[33] H.M. Nagendra, B. Karmacharya, Evaluating forest management in Nepal: views across space and time, Ecology and Society,10(1), 2005 pp. 24-34.