Surface Coverage in Wireless Sensor Networks Based on
Delaunay Tetrahedralization
M G Ribeiro1, L A Neves1, A R Pinto2, M Z Nascimento3, G F D Zafalon1 and C Valêncio1
1
São Paulo State University (UNESP), Department of Computer Science and Statistics (DCCE), Brazil
2
Universidade Federal de Santa Catarina, Campus de Blumenau, Brazil 3
Federal University of Uberlandia, FACOM, Brazil E-mail: [email protected]
Abstract. In this work is presented a new method for sensor deployment on 3D surfaces. The method was structured on different steps. The first one aimed discretizes the relief of interest with Delaunay algorithm. The tetrahedra and relative values (spatial coordinates of each vertex and faces) were input to construction of 3D Voronoi diagram. Each circumcenter was calculated as a candidate position for a sensor node: the corresponding circular coverage area was calculated based on a radius r. The r value can be adjusted to simulate different kinds of sensors. The Dijkstra algorithm and a selection method were applied to eliminate candidate positions with overlapped coverage areas or beyond of surface of interest. Performance evaluations measures were defined using coverage area and communication as criteria. The results were relevant, once the mean coverage rate achieved on three different surfaces were among 91% and 100%.
1. Introduction
Wireless Sensor Networks (WSN) are defined as a subclass of Ad hoc networks, aiming to monitor some phenomena. This kind of network is mainly applied on locations of hard access or in dangerous areas, for military purposes or not [1-3]. The main component of this kind of network is the sensor node, which is responsible for detecting a signal of interest. The inappropriate positioning of a node can cause failures on the WSN to monitor the desired event [1-5]. Studies involving WSN are developed to guarantee appropriate distributions of the sensor nodes on different interest areas. Among the motivations, emphasize to obtain the biggest sensing coverage area, with the best possible quality and with the lesser sensor quantity.
Distributions of sensor nodes with the Delaunay triangulation and Voronoi diagram provide relevant results, but there are few approaches exploring more realistic terrains, considering volumes and roughness of natural reliefs [4, 5]. The generally encountered are studies on simplified and bi-dimensional spaces [6]. For 3D proposal, the limitations involve the need of a non-trivial pre-processing step to discretize a single surface, surfaces non-representative of the real reliefs or restriction to increase the number of nodes. Therefore, in this work a new method is presented for sensor deployment on 3D surfaces, considering a combination of Delaunay and 3D Voronoi. The method was structured on representing the surface with the Delaunay algorithm, construction of the 3D Voronoi diagram and definition of the circumcenter from each cell as candidate position for a
IC-MSQUARE 2014 IOP Publishing
Journal of Physics: Conference Series574(2015) 012083 doi:10.1088/1742-6596/574/1/012083
Content from this work may be used under the terms of theCreative Commons Attribution 3.0 licence. Any further distribution of this work must maintain attribution to the author(s) and the title of the work, journal citation and DOI.
sensor node. The preliminary results were significant, indicating which the proposed approach is promising and already provides an important contribution for studies involving sensor deployment. 2. Methodology
The first step of the method was to define the boundary of the 3D reliefs for distribution of the sensor nodes. This task was performed applying the Blender graphic package, which is maintained by
Blender Foundation and available under double license (BL / GNU General Public License) [7]. From
the boundaries represented, the Delaunay triangulation [6] was applied, aiming to subdivide the geometric domain in simplexes. This was possible considering the limits as a set of vertices V and s as a k-simplex (0 ≤ k ≤ n), composed by the vertices V. The circumcenter of s was comprehended as a circumference with radius r that crosses all vertices from s. If k=d, s has a single circumcenter, otherwise, there are infinite circuncemters from s. The simplex s is Delaunay if exists a circumcenter from s which no vertex from V is inside it. Therefore, the lines between the points that satisfy the condition were drawn, constituting the Delaunay triangles.
The next step was to define the Voronoi diagram [5]. Each Voronoi cell V from the diagram was represented by equation (1). The duality was defined as: for each Delaunay’s edge, the middle point was determined and a perpendicular line was drawn, obtaining the edges from the Voronoi cell. Then, the circumcenter was calculated as the intersection of the bisector from the sides of a triangle. Therewith, it is possible to draw a circumscribed circumference to the triangle which touches the corresponding vertex, guaranteeing that the cell is Voronoi. The circumcenter of a cell was used as a candidate position of the sensor node on the surface.
V(pi)={p | d(p,pi) d(p,pj), j i, j=1,...,n}, (1)
where, p1,..., pn is a set of nodes (defined with x, y and z coordinates), generated by the Delaunay algorithm; n define the total of nodes which discretize the analyzed surface; d(p, ) represents the Euclidian distance between a node p (took as base) and a node , both belonging to a tetrahedron; V( ) represents the Voronoi cell associated to the node
From each candidate position defined, the next step was to calculate performance measures, such as: (a) local and global communications; and, (b) coverage area with quality [4].
Local communication measure was defined by verifying if a candidate position has at least one neighbor for communication. Local communication was determined by the coordinates and the circumcenter radius of interest, checking if the neighbors are within enough distance for communication. This was guaranteed considering that the distance between the analyzed circumcenters is less than the sum of radius, identifying positions which imply in isolated nodes. Global communication was guaranteed with the use of Dijkstra algorithm [8], aiming to guarantee the existence of routes among the nodes of the interest area. The weight between each edge was determined according to the Euclidean distance and using as input method the adjacency matrix.
To define the coverage area with quality was necessary to delete possible circumcenters with identical spatial positions and analyze unwanted intersections. This was performed by verifying the distances among a position taken as reference and the relative neighbor positions: considering a radius range r of the sensor node (which was provided by the user), the positions were deleted when the distance between evaluated positions was greater than the sum of radius. This condition was applied for each candidate position. The coverage area of a node was obtained by equation (2):
, (2)
where s is the surface area and x, y and z are vertex coordinates which constitute the tetrahedron of the 3D surface of interest.
Total area was obtained by the sum of individual areas, following the relation a=πr². Therewith, it was necessary to consider areas with circumference intersections of the coverage, analyzing pairs of
IC-MSQUARE 2014 IOP Publishing
Journal of Physics: Conference Series574(2015) 012083 doi:10.1088/1742-6596/574/1/012083
positions, applying the described method by [4]. The relations were defined by the Euclidean distances c among each position i=1,...,n, equation (3). Values and were the corresponding radius range of the centers called A and B. The points C and D are the intersection points between the circumcenters A and B. Therefore it was possible to determine the angles between the points CAD and CBD, which were called respectively by . At first, only half of the angle was calculated, considering the triangle constituted by the point CBA, equation (4). By calculating the angle among the points CBA, it can be concluded that . For the other half, the process was similar, therefore it can be concluded that . Finally obtained by equation (5), the angles composed by the points CBD and CAD in radian, it was possible to determine the region of each one of the circles cut by the chord CD. Calculating the sector area of the circle BCD and subtracting the area of the triangle ACD, the desired area was defined without overlap (equation (6)).
(3)
(4)
, ; , (5)
(6)
It is important to emphasize that the area (equation 6) is true for intersection in pairs. For others scenarios, the strategy used was broader, aiming to consider two nodes which are neighbors (P and Q) with intersection and involving another intersection with a third node R. In this scenario, the intersection area was PQ and QR. This situation was corrected considering the difference between the intersections PQ and QR, defining the intersection area among the three circumferences PQR and subtracting of the area of the previous calculation from the intersection area two by two. The last step was to sum the intersection value PQR to obtain the final area.
3. Results
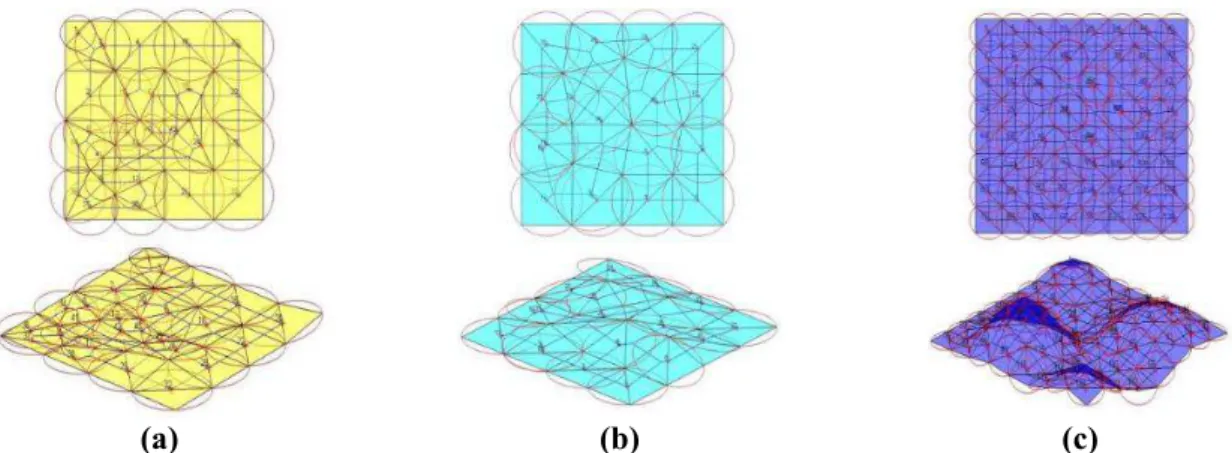
The proposed approach was tested on three distinct reliefs: plain, plateau and hilly. These reliefs are commonly found on applications of WSN for forest fire control, for instance. The length of the example surfaces were fixed in 2000 x 2000 m². In figure 1(a) is shown the plain relief, with total area of 4022.23 m². In figure 1(b) is presented the plateau relief, with total area of 4080.24 m² and in figure 1(c) is presented the hilly relief (4405.92 m²). The values were obtained considering peaks and valleys.
(a) (b) (c)
Figure 1. Representative surfaces of (a) plain, (b) plateauand (c) hilly, which were used as examples for sensor deployment considering the proposed method.
After applying the proposed method, it was obtained: 26 sensor nodes for the plain relief, where 295 56 meters of mean range radius of the sensor, resulting in 100% of coverage area (4022.23 m²); 20 sensor nodes for the plateau relief, with coverage of 98.2% (4006.74 m²). The mean range radius of the sensor was 335 20.7 meters; and, 62 sensor nodes for the hilly relief, representing 91.01% of coverage (4009.65 m²), with mean of 180 4.5 meters from range radius of the sensor.
Another quality measure used was the check on local and global communications, using the Dijkstra shortest path algorithm. As results, the global communication of the distribution was from 18 sensor nodes for the plain terrain, 8 sensor nodes for plateau terrain and 42 sensor nodes for hilly
IC-MSQUARE 2014 IOP Publishing
Journal of Physics: Conference Series574(2015) 012083 doi:10.1088/1742-6596/574/1/012083
terrain. In all cases, by the minimum limits presented for global communication, local communication was satisfied through Dijkstra algorithm. To ilustrate these distributions, in figures 2(a), 2(b) and 2(c) are presented the positions of the sensor nodes in relation to the relief, by Delaunay triangulation and 3D Voronoi. There is still the representative circumferences from the region covered by the nodes, from the circumcenters (position of the sensor nodes).
(a) (b) (c)
Figure 3. Visualization of the candidate positions to all sensor nodes relative to the plain (a), plateau (b) and hilly (c) surfaces.
4. Conclusion
In this work was presented a new method for sensor deployment on 3D surfaces, which provided relevant candidate positions for the surfaces used as example. The coverage values were above 91% and with guarantees of global and local communications: the 3D approach presented by [5] provided a coverage rate of 76.3%, less than the one achieved here. The developed method still does not handle obstacles or priority regions. However, the preliminary results indicate which the method is promising and can be already used by specialists focused on studies involving sensor deployment and 3D surfaces. In future work, the method will be refined, considering obstacles, deployment on priority regions and inclusion of another quality measures.
Acknowledgements
This work was financially supported by PROPe/UNESP (Pró-Reitoria de Pesquisa/UNESP). References
[1] Winkler M, Tuchs K D, Hughes K and Barclay G 2008 Theoretical and practical aspects of military wireless sensor networks. Journal of Telecommunications and Information
Technology 2 37-45
[2] Lynch J P and Loh K J 2006 A summary review of wireless sensors and sensor networks for structural health monitoring Shock and Vibration Digest 38(2) 91-130
[3] Wang Y, Liu Y and Guo Z 2012 Three-dimensional ocean sensor networks: a survey. Journal of
Ocean University of China 11(4) 436-450
[4] Unaldi N, Temel S and Asari V K 2012 Method for optimal sensor deployment on 3D terrains utilizing a steady state genetic algorithm with a guided walk mutation operator based on the wavelet transform Sensors12(4) 5116-5133
[5] Jin M, Rong G, Wu H, Shuai L and Guo X 2012 Optimal surface deployment problem in wireless sensor networks In Proceedings IEEE INFOCOM 2345-2353
[6] Chen L and Holst M 2011 Efficient mesh optimization schemes based on optimal delaunay triangulations Computer Methods in Applied Mechanics and Engineering 200(9) 967-984 [7] Blender, Blender foundation, http://www.blender.org/ (Dec. 2013).
[8] Dijkstra E W 1959 A note on two problems in connection with graphs Numerische Math1
269-271
IC-MSQUARE 2014 IOP Publishing
Journal of Physics: Conference Series574(2015) 012083 doi:10.1088/1742-6596/574/1/012083