Analysis of k-Coverage in Wireless Sensor Networks
Rasmi Ranjan Patra Dept. of Mathematics, Utkal University,Vani Vihar Bhubaneswar, Odisha, India
Prashanta Kumar Patra College of Engineering and Technology, Bhubaneswar, Biju Patnaik University of
Technology, Odisha, India
Abstract— Recently, a concept of wireless sensor networks has attracted much attention due to its wide-range of potential applications. Wireless sensor networks also pose a number of challenging optimization problems. One of the fundamental problems in sensor networks is the coverage problem, which reflects the quality of service that can be provided by a particular sensor network. The coverage concept is depending from several points of view due to a variety of sensors and a wide-range of their applications. One fundamental issue in sensor networks is the coverage problem, which reflects how well a sensor network is monitored or tracked by sensors. In this paper, we formulate this problem as a decision problem, whose goal is to determine the degree of coverage of a sensor network, which is covered by at least k sensors, where k is a predefined value. The sensing ranges of sensors can be same or different. Performance evaluation of our protocol indicates that degree of coverage of wireless sensor networks can be determined within small period of time. Therefore energy consumption of the sensor networks can be minimized.
Keywords- Wireless sensor networks; coverage; k-coverage; connectivity.
I. INTRODUCTION
In computer networking there is a great value of wireless networking because it has no difficult installation, no more expenditure and has lot of way to save money band time. In the field of wireless networking there is another form of networking which is called as wireless sensor network. A type of wireless networking which is comprised on number of numerous sensors and they are interlinked or connected with each other for performing the same function collectively or cooperatively for the sake of checking and balancing the environmental factors. This type of networking is called as Wireless sensor networking. Basically wireless sensor networking is used for monitoring the physical conditions such as weather conditions, regularity of temperature, different kinds of vibrations and also deals in the field of technology related to sound.
Total working of wireless sensor networking is based on its construction. Sensor network initially consists of small or large nodes called as sensor nodes. These nodes are varying in size and totally depend on the size because different sizes of sensor nodes work efficiently in different fields. Wireless sensor networking have such sensor nodes which are specially designed in such a typical way that they have a microcontroller which controls the monitoring, a radio transceiver for generating radio waves, different type of
wireless communicating devices and also equipped with an energy source such as battery. The entire network worked simultaneously by using different dimensions of sensors and worked on the phenomenon of multi routing algorithm which is also termed as wireless ad hoc networking.
There are mainly three types of coverage problem like Area Coverage, Point Coverage, Barrier Coverage .In Area of coverage, the main objective of the sensor network is to cover (monitor) an area (also referred sometimes as region). In the point coverage problem, the objective is to cover a set of points. There are two types of coverage approach (a) random point coverage (b) deterministic point Coverage. In barrier Coverage minimize the probability of undetected penetration through the barrier (sensor network).
The main goal of this idea is to determine the degree of coverage of an area covered by two or more sensors & then find out the lowest degree of coverage.
II. RELATED WORK
Wireless sensor networks (WSNs) have attracted a great deal of research attention due to their wide-range of potential applications. A WSN provides a new class of computer
systems and expands people’s ability to remotely interact with
the physical world. In a broad sense, WSNs will transform the way we manage our homes, factories, and environment. Applications of WSNs [1] include battlefield surveillance, biological detection, home appliance, smart spaces, and inventory tracking.
Sensors in a network can cooperatively gather in- formation from an interest region of observation and transmit this collected information to a base station. There are two types of data sent to the base station: 1. event-driven and 2. On-demand. In the former case, the data is sent to the base station when one or more sensors detect an event in the vicinity. In the latter case, the data is sent from the sensors to the base station based on an explicit request.
An important problem addressed in literature is the sensor coverage problem. This problem is centered around a
Since sensors may be spread in an arbitrary manner, one of the fundamental issues in a wireless sensor network is the coverage problem. In general, this reflects how well an area is monitored or tracked by sensors. In the literature, this problem has been formulated in various ways. For example, the Art Gallery Problem is to determine the number of observers necessary to cover an art gallery (i.e., the service area of the sensor network) such that every point in the art gallery is monitored by at least one observer. This problem can be solved optimally in a 2D plane, but is shown to be NP-hard when extended to a 3D space [3].
Reference [4] defines a sensor coverage metric called surveillance that can be used as a measurement of quality of service provided by a particular sensor network, and centralized optimum algorithms that take polynomial time are proposed to evaluate paths that are best and least monitored in the sensor network. The work further investigates the problem of how well a target can be monitored over a time period. While it moves along an arbitrary path with an arbitrary velocity in a sensor network. Localized exposure-based coverage and location discovery algorithms are proposed in [5].
On the other hand, some works are targeted at particular applications, but the central idea is still related to the coverage
issue. For example, sensors’ on-duty time should be properly scheduled to conserve energy. Since sensors are arbitrarily distributed, if some nodes share the common sensing region and task, then we can turn off some of them to conserve energy and thus extend the lifetime of the network. This is feasible if turning off some nodes still provide the same
“coverage” (i.e., the provided coverage is not affected).Author in [6] proposes a heuristic to select mutually exclusive sets of sensor nodes such that each set of sensors can provide a complete coverage the monitored area. Author in [7] proposes a probe-based density control algorithm to put some nodes in a sensor-dense area to a doze mode to ensure a long-lived, robust sensing coverage. A coverage preserving node scheduling scheme is presented in [8] to determine when a node can be turned off and when it should be rescheduled to become active again.
In this work, we consider a more general sensor coverage problem. Given a set of sensors deployed in a target area, we want to determine if the area is sufficiently k-covered, in the sense that every point in the target area is covered by at least k sensors, where k is a predefined constant. As a result, the aforementioned works [6,7] can be regarded as a special case of this problem with k = 1. Applications requiring k > 1 may occur in situations where the stronger environmental monitoring is necessary, such as military applications. It also happens when multiple sensors are required to detect an event.
For example, the triangulation-based positioning protocols [3,4, 7] require at least three sensors (i.e., k ≥ 3) at any moment to monitor a moving object. Enforcing k ≥ 2 is also necessary for fault-tolerant purpose. In paper [9], a novel solution is proposed to determine whether a sensor network is k-covered. The sensing range of each sensor can be a unit
disk or a non-unit disk. The solution can be easily translated to a distributed protocol where each sensor only needs to collect local information to make its decision. Instead of determining the coverage of each location, our approach tries to look at
how the perimeter of each sensor’s sensing range is covered,
thus leading to an efficient polynomial time algorithm. As long as the perimeters of sensors are sufficiently covered, the whole area is sufficiently covered. In this paper, we propose a simple solution to determine the degree of coverage of a sensor network. In paper [9], authors consider the perimeter only but not determine it in a mathematical way. So, in this paper we consider the intersection area and calculate in set theory method and also calculate the area of intersection geometrically. We consider for same and different sensing range of a sensor. After finding the degree of coverage, it is easy to find out which node always be active
III. SYSTEM MODEL
A. Definitions & Notations 1) Sensing Range :
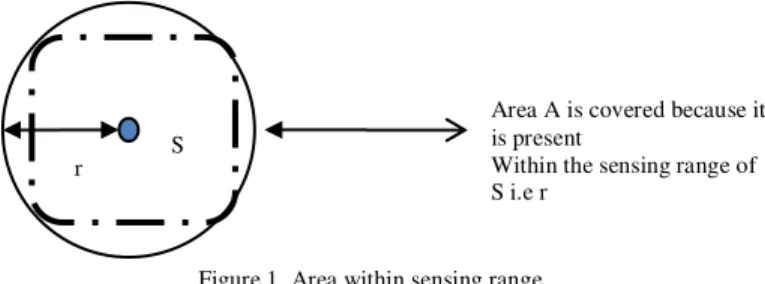
Within which range a sensor can sense a particular area. Suppose an area A is covered by a sensor S, when it is covered within the sensing range of s.
Figure 1. Area within sensing range.
2) Communication Range :
Within which range a sensor can communicate with another.
3) Degree of Coverage
When an area is covered by a sensor s, then the degree of coverage of particular that area is one because it is covered within the sensing range of only one sensor.
Figure 2. Sensor S within it’s sensing range.
B. Condition for Intersection
1) Consider two sensors S1 and S2. Both two sensors are intersect with each other when sum of radii is less than and equal to distance between centers.
S
r
Area A is covered because it is present
Within the sensing range of S i.e r
S
r
Sensor s covered a piece of area within its
Sensing range i.e - r
Means the degree of coverage of this area
Figure 3. Condition for intersection of two sensors
(1) This idea also states that how to know one sensor should be always active or go to sleep mode.
2) Based on condition for intersection some special case arises:-
Figure 4. Two sitution for two sensors for intersection
a) Some Special Cases for Intersection
o When two sensor sensing range separate with each
other
Figure 5. Two separated sensors
b) When one sensor present within another sensor sensing range
Figure 6. Overlapped sensors.
c) When two sensor only touched means intersect with each other without creating any area:
Figure 7. Touched sensors.
IV. DETERMINATION OF K-COVERAGE
A. Determination of Area of Intersection
1) When two sensors sensing range intersect with each other creating any area.
o Case1
Figure 8. Two intesect sensors
(2)
o Case2
Figure 9. Two intesect sensors
2)Find the area of intersection between two circles
(3)
Figure 10. Two intesect sensors
3) We can see that if we draw the line y=x on the graph, we will split the intersection area into two equal pieces.
s1 s
2 r
1
r2
Both are intersect when Sum of radii <= Distance between centers
r1+r2 <=
=> D(s1,s2)
Case 1 Case 2
=> d(s1,s2) > r1+r2 means A∩B =Ø
=>d(s1,s2) < (r1-r2) & r> r2
If r1=r2 then
=> d(s1,s2) = r1+r2
s
1
s
2
=> r1-r2 < d(s1,s2) < r1+r2 Means A∩B ≠ Ø
s
1 s
2
s 1
s 2
=> r1-r2 < d(s1,s2) < r1+r2
(0,1)
(1,0)
S 1
Figure 11. Two intesect sensors
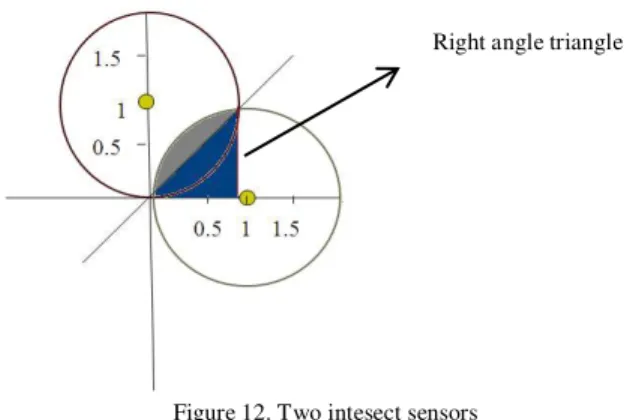
Now, notice that we can form a triangle in the second circle, from the dashed line to the center at (1,1). It will be a 45º-45º-90º right triangle.
Figure 12. Two intesect sensors
We know the area of the sector of the circle is π/4 since we
are dealing with a quarter of the circle with radius 1 and we know that the area of the triangle is 1/2.
(Area of the triangle is 1/2 b* h => ½*1*1 = ½)
The area of the gray shaded region is
=> π/4-1/2= π-2/4 => It is the half of the intersection area only
The area of entire intersection will be => 2* π-2/4
=> π-2/2
We found the area of intersection in the case the radii for both circles was equal to 1.
In the more general case in which both circles have radius r (and have their centers shifted accordingly), then (π-2/2)r2 , this formula is compute the intersection area
B. Determination Degree of Coverage
1) When two sensors overlap each other then Degree of coverage of A and B is one by the defination of coverage.
Figure 13. Two Intesect Sensors
Equation
(Let A∩B = X)
AUB= |A-B|+ |B-A|+|A∩B| =1-X+1-X+X
=>2-2X+X=|AUB| =>2-X=AUB =>2-AUB= X =>2-AUB=A∩B
2) Suppose If one sensor covered a area then degree of coverage is one then, if two sensor covered a area then degree of coverage is of this area is 2.
Figure 14. Two Intesect Sensors
Then |AUB|=|A|+|B|-|A∩B| =1+1-2
=0 |AUB |= 0
Then put |AUB|=0 In equation 1 then we get |A∩B|=2
So, according to above contradiction method it shows that degree of coverage of intersection area of two sensor sensing range is 2.
3)For degree of Coverage Lemma-1
If two sensors intersect with each other, then degree of coverage of intersection area is two according to the 4(i) equation. Likewise if 3 sensor intersect then, degree of coverage of that intersection area is three. Same way how many sensors intersect with each other is equal to the degree of coverage of that intersects area.
1 1
0.5
1.5 1.5
0
Right angle triangle
A B
A∩BLet A∩B = X
A B
Degree of coverage is 1
Degree of coverage of is 1
Figure 15. Multiple Intesect Sensors
V. PERFERMANCEEVALUATION
The four graphs devloped by MATLAB 7.4.0 after putting the equation used in the algorithms.As shown in figure 16, the result of average degree of coverage with different sensing ranges.As shown in figure 17,energy consumption for different nodes when degree of coverage is different.As shown in figure 18. Coverage Detection Time in millisecond for Different Nodes (100 to 1000) for different Sensing Range. As shown by figure 19, Find out the coverage detection time with different nodes with different sensing ranges. Degree of coverage for different nodes when Sensing Range equal to Communication Range, Communication Range twice of Sensing range and Communication Range greater than double of sensing range.
Figure 16. Average Degree of Coverage with different nodes(100 to 1000) with Various Sensing Ranges(10M,20M,30M).
Figure 17. Energy Consumption for different nodes ( 100 to 1000) for
Figure 18.Coverage Detection Time for Different Nodes (100 to 1000) for different Sensing Range.
Figure 19.Degree of coverage for different Nodes when Communication Range equal to Sensing range, Communication Range equal to Double of sensing range and Communication Range Greater than double of sensing
range.
VI. CONCLUSION AND FUTURE SCOPE
In this paper, we have proposed a solution to find out the degree of coverage in a sensor network with irrespective of same and different sensing range. We consider the intersection area & try to find out in a mathematical way using set theory method. With the proposed techniques, we also discuss some applications like whether a node goes to sleep or active state.
Our proposed model is very simple and efficient. This paper is proposed for easily finding degree of coverage the However, time complexity calculation & simulation are yet to be done in order to prove the efficiency of the protocol.
REFERENCES
[1] G. T. Huang, “Casting the Wireless Sensor Net,” Technology Review, pp 50-56, July/August 2003.
[2] D. Tian and N. D. Georganas, A coverage-preserving Node scheduling scheme for large wireless sensor networks. In ACM Int’l Workshop on Wireless Sensor Networks and Applications (WSNA), 2002. [3] J. O’Rourke,Computational geometry column 15. Int’l Journal of
Computational Geometry and Applications, Pp 215–217, 1992. [4] S. Meguerdichian,F. Koushanfar, M. Potkonjak, and M.B.Srivastava. “
Coverage problems in wireless ad-hoc sensor Networks”. In IEEE
– A∩B∩C=3
A B A∩B = 2
A∩B∩ C∩D=
4 D
A B
[5] S. Meguerdichian, S. Slijepcevic, V. Karayan, and M. Potkonjak.
“Localized algorithms in wireless ad-hoc networks: location discovery and sensor exposure.”In ACM Int’l Symp. on Mobile Ad Hoc Networking and Computing (MobiHOC), pp 106–116, 2001.
[6] S.Slijepcevic and M.Potkonjak. Power efficient organization of wireless
sensor networks. In IEEE Int’l Conf. on Communications (ICC), pp 472–476, 2001.
[7] F. Ye, G. Zhong, S. Lu, and L. Zhang, “PEAS: A robust energy conserving protocol for long-lived sensor networks”. In Int’l Conf. on Distributed Computing Systems (ICDCS), 2003.
[8] D. Tian and N. D. Georganas. “A coverage-preserving node scheduling scheme for large wireless sensor networks”. In ACM Int’l Workshop on Wireless Sensor Networks and Applications (WSNA), 2002.
[9] Chi-Fu Huang and Yu-Chee Tseng . “The coverage problem in a wireless sensor network”. Department of Computer Science and Information Engineering National Chiao-Tung University Hsin-Chu, 30050, Taiwan
AUTHORS PROFILE
Rasmi Ranjan Patra received Master In Computer Application With 1st Class With distinction from O.U.A.T, Odisha, India in 2001, M.Tech in Computer Science and Technology from C.E.T , Bhubaneswar ,India in 2010 and currently pursuing Ph.D Degree in Utkal University, India .He is working as Assistant professor in Department of Computer Science and Application under Orissa University of Agriculture and Technology(O.U.A.T).He has Published many papers at national /international Journals and Conferences in the areas of Sensor Network. Mr.Patra has authorize one book in Computer Science area.