www.biogeosciences.net/10/4937/2013/ doi:10.5194/bg-10-4937-2013
© Author(s) 2013. CC Attribution 3.0 License.
Biogeosciences
Geoscientiic
Geoscientiic
Geoscientiic
Geoscientiic
Hydrologic control of the oxygen isotope ratio of ecosystem
respiration in a semi-arid woodland
J. H. Shim1, H. H. Powers1, C. W. Meyer1, A. Knohl2, T. E. Dawson3, W. J. Riley4, W. T. Pockman5, and N. McDowell1 1Earth and Environmental Sciences Division, Los Alamos National Laboratory, MS-J495, Los Alamos, NM 87545, USA 2Chair of Bioclimatology, Georg-August University of G¨ottingen, G¨ottingen, Germany
3Department of Integrative Biology, University of California, Berkeley, CA, USA 4Earth Sciences Division, Lawrence Berkeley National Laboratory, Berkeley, CA, USA 5Department of Biology, University of New Mexico, Albuquerque, NM 87131-0001, USA Correspondence to:J. H. Shim (jeehshim@gmail.com)
Received: 19 September 2012 – Published in Biogeosciences Discuss.: 2 January 2013 Revised: 8 May 2013 – Accepted: 18 June 2013 – Published: 23 July 2013
Abstract. We conducted high frequency measurements of theδ18O value of atmospheric CO2from a juniper (Juniperus monosperma) woodland in New Mexico, USA, over a four-year period to investigate climatic and physiological regula-tion of theδ18O value of ecosystem respiration (δR). Rain pulses resetδRwith the dominant water source isotope com-position, followed by progressive enrichment ofδR. Transpi-ration (ET)was significantly related to post-pulseδR enrich-ment because the leaf waterδ18O value showed strong en-richment with increasing vapor pressure deficit that occurs following rain. Post-pulseδRenrichment was correlated with bothET and the ratio of ET to soil evaporation (ET/ES). In contrast, the soil water δ18O value was relatively stable andδRenrichment was not correlated with ES. Model sim-ulations captured the large post-pulse δR enrichments only when the offset between xylem and leaf water δ18O value was modeled explicitly and when a gross flux model for CO2 retro-diffusion was included. Drought impactsδRthrough the balance between evaporative demand, which enrichesδR, and low soil moisture availability, which attenuates δR enrich-ment through reducedET. The net result, observed through-out all four years of our study, was a negative correlation of post-precipitationδRenrichment with increasing drought.
1 Introduction
Terrestrial ecosystems play an important role in global car-bon cycling, and atmospheric oxygen isotope composition of CO2 (δa) has emerged as a promising tool to detect
biosphere–atmosphere CO2 fluxes at tissue, ecosystem, re-gional and global scales (Francey and Tans, 1987; Yakir and Wang, 1996; Tans and White, 1998; Farquhar et al., 1993; Buenning et al., 2011; Cuntz et al., 2003a; Welp et al., 2011). δa has been used to distinguish the contributions of pho-tosynthesis and respiration (Tans and White, 1998; Yakir and Wang, 1996) and of nocturnal foliar and soil respiration (Bowling et al., 2003a) to net ecosystem exchange. Theδ18O value of terrestrial CO2 fluxes (δR)may provide a stronger terrestrial signal thanδ13C in some ecosystems (Fung et al., 1997; Og´ee et al., 2004), but prediction ofδRis complex (Still et al., 2009) because it depends on prediction of both ecosys-tem water and C dynamics (Riley et al., 2003, 2005; Lai et al., 2006). The utility of oxygen isotopes in carbon cycle re-search can be improved, however, by a better understanding of plant physiological effects on the gross and net leaf fluxes of C18O16O (Flanagan et al., 1997; Gillon and Yakir, 2000; Cernusak et al., 2004).
δRdepends on the18O composition of the net CO2effluxes from foliage, stem, and soils. These effluxes are strongly in-fluenced by the 18O compositions of their respective water pools through oxygen atom exchange between CO2and H2O after equilibrium and diffusive fractionation (Brenninkmeijer et al., 1983; Tans, 1998; Farquhar et al., 1993). Carbonic an-hydrase (CA) catalyzes this CO2–H2O isotopic equilibration inside foliage (Flanagan et al., 1997) and soil (Riley et al., 2002; Seibt et al., 2006; Wingate et al., 2009).
storm tracks (Rozanski et al., 1982; Wingate et al., 2010). Subsequently, a vertical gradient in δSW is often estab-lished because soil evaporation leads to isotopic enrichment (increasing δ18O value; Sharp, 2005) in the upper layers (Walker et al., 1988; Mathieu and Bariac, 1996). Soil wa-ter that is taken up by plant roots is transported through the xylem unfractionated in most terrestrial ecosystems (Dawson and Ehleringer, 1991). Leaf water becomes enriched relative to xylem water because of fractionation during evapotranspi-ration (Wang and Yakir, 1995; Roden and Ehleringer, 1999; Flanagan et al., 1997). At night, leaf water can become more enriched than that predicted by the Craig–Gordon model, due to the lag in relaxation of the daytime leaf water en-richment toward the nighttime value (Cernusak et al., 2002; Farquhar and Cernusak, 2005). Cuntz et al. (2003b) incor-porated such a lag into a global model ofδ18O value in at-mospheric CO2. They concluded that the leaf-respiredδ18O value becomes further enriched above source water due to CO2 retro-diffusion (the process where CO2enters foliage through stomata, equilibrates with leaf water, and escapes from the leaf without altering the net CO2flux; Cernusak et al., 2004). Lastly, assuming an accelerated soil hydration rate from soil surface CA activity improved agreement between predicted and observed18O composition of atmospheric CO2 (Wingate et al., 2009).
δR is impacted by evaporative enrichment of ecosystem water pools. Evapotranspiration drives greater isotopic en-richment in foliage than in soils due to the much smaller wa-ter pool of foliage. This enrichment results in foliar respira-tion being more18O enriched than soil respiration, and the isotopic disequilibrium between theδ18O values of soil and leaf-respired CO2is enhanced during dry periods (Wingate et al., 2010). For example, theδ18O values of branch and soil respiration increased during a post-precipitation dry pe-riod by 170 ‰ and 18 ‰ (Vienna Pee Dee Belemnite-CO2), respectively, in a Pinus dominated ecosystem in Europe (Wingate et al., 2010). Thus,δa may carry a strong signal of drought impacts on the hydrology of terrestrial systems.
A reasonable hypothesis is thatδR increases during sea-sonal droughts when precipitation (P )minus potential evap-otranspiration (EP; Ellis et al., 2010) is most negative. Test-ing this hypothesis requires long-term datasets to capture a large range of P−EP. A further reasonable hypothesis is that drought imparts aδRenrichment dependent on the ra-tio of canopy transpirara-tion to soil evaporara-tion (ET/ES) be-cause of their differential responses to drought (Wingate et al., 2010).ETandESrepresent the two main fluxes of water from the ecosystem to the atmosphere. TheET/ES ratio is fundamentally important because it is mechanistically linked to vegetation and ecosystem water balance processes and is sensitive to disturbances such as climate extremes and woody encroachment (Huxman et al., 2005). Therefore, the magni-tude ofδRenrichment over the several days after pulse events should be linked toETandES because these fluxes impact
theδ O values of source water pools (i.e., leaves and soil water) with which CO2interacts.
To our knowledge, no study has combined long-termδR, P−EP, andET/ESobservations with an analysis of terres-trial ecosystem drought response.ET/(ES+ET)has been es-timated from observations for a relatively small number of locations in water-limited regions, and those field estimates vary greatly in methodology (Reynolds et al., 2000, Wilson et al., 2001). There have been a few high-resolution, continu-ous monitoring studies ofδR(Griffis et al., 2005; Welp et al., 2006; Wingate et al., 2010), but none from arid ecosystems that would be expected to strongly exhibit drought signals. Semi-arid woodlands in the southwestern USA are domi-nated by pulse-driven precipitation patterns and prolonged and severe drought periods (Seager et al., 2007; Rauscher et al., 2008); thus a logical expectation is that these woodlands exhibit large variation inδR,P −EP, andET/ES.
We measured δR in a juniper (Juniperus monosperma) woodland over a four-year period to investigate precipitation-pulse-driven eco-hydrological responses. Along with direct measurements of ET, we improved and applied ISOLSM (Riley et al., 2002), an isotope-enabled land-surface model, to estimate ES and interpret δR observations. We hypoth-esized that (1) δR would be related to P−EP; however, (2) this relationship would be moderated by rainfall-pulse-driven changes inET orET/ES. Our overarching goal is to move towards better understanding of the mechanisms deter-mining theδ18O compositions of terrestrial CO2fluxes and the atmosphere, allowing for potential use of these signatures for monitoring the impacts of drought on terrestrial ecosys-tems.
2 Methods
2.1 Field site
The field site is a pi˜non pine–one-seed juniper (Pinus edulis– Juniperus monosperma) woodland located in northern New Mexico at Los Alamos National Laboratory (35.85◦N, 106.27◦W, elevation 2140 m). Approximately 97 % of the
400 mm and exhibits a bimodal distribution between win-ter snowfall and summer monsoon showers. This has been the site of extensive research on ecology and hydrology (La-jtha and Barnes, 1991; Breshears et al., 1997; Newman and Robinson, 2005; Rich et al., 2008) and on the isotopic fluxes associated with photosynthesis and respiration at leaf, soil, and ecosystem scales (McDowell et al., 2008b; Bickford et al., 2009, 2010; Powers et al., 2010, Shim et al., 2011). 2.2 Micrometeorology andETcalculation
We collected meteorological measurements at 30 s and recorded averages every 30 min including air temperature, relative humidity (RH), soil water content (SWC) at 2 cm depth, and rainfall (Texas Electronics, Texas, USA). Soil water content was also measured at depths of 20–100 cm twice per month using neutron probes (503DR Hydrophobe Neutron Moisture Probes, Campbell Pacific Nuclear, Inc., Pacheco, CA, USA). Pre-dawn leaf water potential (9pd)was measured once per month using a Scholander-type pressure chamber (PMS Instruments Co., Corvallis, OR, USA) on six mature juniper trees.
Canopy-scale transpiration, ET, was estimated by mea-suring sap flux density with Granier heat dissipation probes (Granier, 1987; Phillips and Oren, 2001). A detailed de-scription of sap flux methodology is described in Shim et al. (2011). Transpiration was scaled to the canopy level as
ET=JsAs/Ag, (1)
whereJsis sap flux (g m−2s−1),Asis sapwood area (m2), andAgis the ground area (m2). Site-specificAs/Agwas from McDowell et al. (2008a) and did not change considerably during the study due to the low growth rate of these trees. 2.3 Incorporation of the Isotope Land-Surface Model
(ISOLSM)
The use of isotope-enabled land models to interpret18O val-ues of ecosystem water and CO2 fluxes at the site level is fraught with potential uncertainties (Og´ee et al., 2004) stemming from challenges in (1) simulating the underly-ing bulk water and CO2fluxes (Schwalm et al., 2010; Tang and Zhuang, 2008); (2) equilibrium and kinetic fractiona-tions (Cappa et al., 2003); (3) above-canopy isotopic forc-ing (Welker, 2000); (4) vertical soil distributions of18O and CO2production (Riley et al., 2002; Riley, 2005); and (5) leaf water18O and interactions with CO2(Cernusak et al., 2003; Farquhar and Cernusak, 2005). The problem becomes even more acute when isotope-enabled land models are integrated into global models (e.g., Buenning et al., 2012; Wingate et al., 2009). Despite these complications, we contend these models can be helpful to investigate relationships between forcing and net isotope exchanges with the atmosphere, as long as an awareness of these uncertainties is maintained.
With that philosophy in mind, we applied ISOLSM (Ri-ley et al., 2002) to investigate land-to-atmosphere C18OO exchanges in the period immediately following precipitation events. ISOLSM has been used in a number of studies to evaluate controls on the 18O composition of ecosystem C and H2O exchanges at site, regional, and global scales (Ri-ley et al., 2002, 2003; Ri(Ri-ley, 2005; Buenning et al., 2011; Henderson-Sellers et al., 2006; Lai et al., 2006; McDowell et al., 2008b; Still et al., 2005, 2009).
Here, we briefly describe the methods used in ISOLSM; details of the model formulation can be found in Riley et al. (2002). In addition to simulating fluxes of CO2, H2O, radiation, sensible heat, and latent heat, ISOLSM pre-dicts separately each component of the ecosystem CO2and H2O isotope effluxes. Site-level climate observations suf-ficient to force ISOLSM continuously for the three years of this study were unavailable. Therefore, the necessary in-puts (wind speed, humidity, temperature, pressure, solar and long-wave radiation) to drive ISOLSM were obtained from the North American Regional Reanalysis product (NARR; http://www.emc.ncep.noaa.gov/mmb/rreanl/). The NARR is a meteorological assimilation framework designed to pro-duce consistent climate data for the North American region. It assimilates, at a 3 h time step, a suite of high-resolution meteorological observations into a coupled atmosphere (Eta) and land (NOAH) model. ISOLSM interpolates the resulting climate forcing to its half-hour internal time step, so no gap filling of climate forcing was required.
As with almost every other long-term C and H2O isotope modeling exercise ever performed, we did not have continu-ously observedδ18O values of precipitation or above-canopy atmospheric humidity. For this study, as in Still et al. (2009), we used the monthly mean precipitationδ18O values aver-aged over 2–5 yr from analyses of archived water samples collected by the EPA National Atmospheric Deposition Pro-gram (NADP) network (Lynch et al., 1995) between 1980 and 1990 and interpolated across the US (Welker, 2000). Many factors affect theδ18O value of vapor (δ18Ov; Lee et al., 2006; Helliker et al., 2002; Lai et al., 2006; White and Gedzelman, 1984). We set δ18Ov to be in a temperature-dependent isotopic equilibrium with the most recent precip-itation event (Still et al., 2009). We note that the sensitivity of ecosystem–atmosphere C18OO exchanges to diurnal vari-ations inδ18Ov is relatively small (Riley et al., 2003). Accel-erated CO2–H2O isotopic exchange (by carbonic anhydrase) in soils and foliage is an important factor impactingδR. We set the CO2–H2O isotopic hydration to 100 % (Wingate et al., 2009; also see Farquhar and Cernusak, 2012) because seasonal and temporal variability in hydration activity is un-known. We set the soil setting point depth to 0–2.5 cm soil depth and applied a 7.2 ‰ diffusive offset reflecting disequi-librium between CO2and water near the surface (Miller et al., 1999).
fluxes (δLR):
δLR=
θ[δCW(1+εw)+εw]+(1−θ ) δC0−CCac(δa−a)−a
(1+a)1−Ca
Cc
, (2)
where θ is the proportion of chloroplast CO2 that is iso-topically equilibrated with chloroplast water (assumed to be 1 for the simulations here);δCW,δc0, and δa are theδ18O values of chloroplast water (‰), of CO2in the chloroplast that has not equilibrated with local water, and the CO2mole fractions in the ambient atmosphere, respectively; Ca and Cc are the CO2 in the ambient air and in the chloroplasts (µmol mol−1), respectively; and ε
w is the equilibrium18O fractionation between CO2 and water that is dependent on temperature (Brenninkmeijer et al., 1983).ais the weighted mean discrimination against C18OO for diffusion from the chloroplast to the atmosphere (Farquhar and Lloyd, 1993): a=(Cc−Ci) aw+(Ci−Cs) a+(Cs−Ca) ab
Cc−Ca
, (3)
whereawis the summed discriminations against C18OO dur-ing liquid phase diffusion and dissolution (0.8 ‰); a and ab are the discriminations against C18OO during diffusion through the stomata and the boundary layer (8.8 and 5.8 ‰, respectively); andCiandCsare CO2in the leaf intercellular spaces and at the leaf surface (µmol mol−1), respectively.
We imposed a two-hour turnover time to the leaf water pool to account for the delayed equilibrium of leaf water with xylem water after transpiration ceases (Cuntz et al., 2003a; Farquhar and Cernusak, 2005; Lai et al., 2006). We used the model default value of minimum nighttime stomatal conduc-tance (Bonan, 1996), which was supported by limited direct measurements (data not shown). We discuss the uncertainty resulting from these assumptions in the Discussion section.
We calculated the fractional contribution of each isoflux, i.e., leaf, soil, and stem, to the total ecosystem isoflux from the specific sources predicted by ISOLSM by multiplying the δ18O values of leaf, soil and stem CO2fluxes by leaf, soil, and stem respiration rates, respectively.
2.4 Drought index
We used the difference between precipitation (P ) and esti-mated potential evapotranspiration (EP)as a hydroclimatic index. We employed the Hamon (1961) method forEP esti-mation.
EP=13.97D2Pt, (4)
whereEP is potential evapotranspiration (mm day−1),Dis the number of daylight hours in units of 12 h for a given day, andPt is the saturated water vapor density term calculated by
Pt=
4.95e0.062Ta
100 , (5)
whereTa is daily mean air temperature ( C). This index is well suited for regions with high interannual variability and extremely warm seasons during which evaporative loss dom-inates the hydrologic budget despite significant precipitation (Ellis et al., 2010).
2.5 Tunable diode laser system
A description of the tunable diode laser absorption spec-trophotometer (TDL, TGA100A, Campbell Scientific Instru-ments, Logan, UT, USA) operation and sampling system is provided in Shim et al. (2011). Briefly, air samples were con-tinuously collected from the canopy airspace of the pi˜non– juniper woodland at 0.05, 1.0, 1.5 and 3.0 m height. The fetch for the sample area is representative of the local veg-etation at our sampling location because the (dead) pi˜non– juniper ecosystem extends for approximately 73 km2around the tower site. The lead salt laser within our TDL system was tuned to absorption lines of 2308.225 cm−1, 2308.171 cm−1, and 2308.416 cm−1for 12CO2,13CO2, and C12O18O16, re-spectively. The TDL sampled two calibration cylinders for 35 s each followed by four sample inlets and one quality con-trol cylinder for 34 s each, resulting in a sample collected for each height every four minutes. The first 20 s of all sam-ples were discarded to omit transients associated with valve switching and to ensure complete purging of the sample cell of the previous sample. To assess the net error associated with CO2 and δ18O measurements, we sampled a quality control cylinder during each sample cycle. This cylinder was sampled with the pi˜non–juniper field inlets and treated as an unknown. Precisions (1σ standard deviation) for the un-known cylinders were 0.18 µmol mol−1for CO
2and 0.16 ‰ forδ18O value (n=6000).
A linear two-point gain and offset correction was ap-plied to the sample data as described by Bowling et al., (2003b). Working calibration cylinders were propagated from World Meteorological Organization traceable gases ob-tained from the National Oceanic and Atmospheric Adminis-tration Earth System Research Lab; [CO2] was from 344.88 to 548.16 µmol mol−1 and the δ18O value from −8.16 to −16.42 ‰. The mole fractions of the isotopologues12CO
2, 13CO
2and12C18O16O within our calibration gases spanned the range observed in the field samples. The secondary standards (Scott-Marin, Inc., USA) were propagated weekly from our two primary standards throughout 2006 and ana-lyzed for drift in CO2 andδ18O value within the cylinders. Cylinder drift was negligible, averaging 0.00001 ‰ day−1, with maximum drift of 0.00005 ‰ day−1(n=12 cylinders). We switched to approximately monthly propagation of sec-ondary cylinders beginning in 2007.
and soils and the atmosphere (Tans, 1998). We used measure-ments of CO2and18O taken between 20:00 and 04:00 h and data from four inlets located at 0.05, 1.0, 1.5 and 3.0 m to-gether to examine nightlyR. Model I regressions were used to avoid negatively skewed intercepts (Zobitz et al., 2006). To assess the stability of isotopic sources for each night, we compared Keeling intercepts to the isotopic mixing line pro-posed by Miller and Tans (2003) (MT2003 hereafter). The MT2003 approach estimatesRas the slope of a linear regres-sion between the product of18O and [CO2] versus [CO2] and offers an advantage when the Keeling approach violates the assumption of a stable background (Miller and Tans, 2003; Lai et al., 2004). DeterminingRfrom a Keeling or a MT2003 regression from model I regressions gave similar results for our 4 yr data record (r2=0.99, see Fig. A5); therefore we re-tained our analysis via the Keeling approach. An independent check on the assumption of stable source values was con-ducted using ISOLSM, which revealed that the sources were relatively stable (mean standard error (‰)=1.5, 0.1, and 0.1 for18O of foliar, soil and stem respiration, respectively; see Fig. A6). We screened the data to include only values with ranges of 10 ppm for CO2and 2 ‰ for18O (Schaeffer et al., 2008). Using this filter, 64 % of the nightly datasets were re-tained between April 2005 and October 2008.
2.6 Analyses of pulse responses
To determine the δR response to precipitation pulses, we compared the δR prior to a rain event to the subsequent days after that event and lasting up to 11 days, but not in-cluding subsequent rain events. The number of days after precipitation pulses was not significantly different by sea-sons (F =0.6,P =0.5, ANOVA). Analysis within individ-ual pulse events avoids confounding multiple precipitation events when analyzing the coupling of δR to meteorologi-cal or physiologimeteorologi-cal parameters. Rain events differed inδ18O value due to varyingδ18O values of source water, tempera-ture, and storm tracks (Rozanski et al., 1982); thus we report δR responses to pulse precipitation events as the maximum δRchange over the week following a rain event (see an inset in Fig. 2). This approach allows comparison of the rate and magnitude ofδRchanges after each pulse event across the four years.
We conducted correlation analyses ofδR withET, vapor pressure deficit (VPD), RH, and SWC for each pulse event to determine the degree and speed of coupling betweenδR and hydrologic drivers (Bowling et al., 2002; Shim et al., 2011). We considered all possible subsets from 1 day after a pulse event up to 11 days, for all four years. We consid-ered correlations ranging from instantaneous (e.g.,δRfrom dayx paired withETfrom dayx) to lagged responses (e.g., δRfrom dayx correlated withETfrom dayx-1,x-2, and so on). Responses of δR lagged up to 11 days behind driving variables were considered. The number of days used in these analyses varied with the length of time between rain events.
All correlations were conducted as linear regression models using the least squares method. We present all relationships with significance (p)<0.1 (Flanagan et al., 1996; McDowell et al., 2004; Shim et al., 2011).
2.7 δ18O of precipitation, foliage, stem, and soils
Samples of precipitation, foliage, stem, and soil water were collected and analyzed for 18O composition in 2006 and 2007. Precipitation was collected from a sealed collection vial at the base of a rain funnel immediately after rain events. Foliage, stem and soil samples at 2, 7, and 10 cm were col-lected on a monthly basis as part of the Moisture Isotopes in the Biosphere and Atmosphere project. δ18O values of the soil water profile were measured at 5 depths: 2, 5, 7, 10 and 15 cm on day of year (DOY) 151 in 2006. Samples were cryogenically extracted on a vacuum line and analyzed with a Thermo Delta Plus XL mass spectrometer at the UC Berkeley stable isotope laboratory where long-term external precision (over more than 5 yr) is±0.24 ‰. All oxygen iso-tope ratios in this paper for water and CO2are referenced to the Vienna Standard Mean Ocean Water (V-SMOW) scale (Coplen, 1996) and are presented in dimensionless units of ‰.
3 Results
3.1 Climate regimes over four years and associated patterns ofP−EP,ES,ET/ESandδR
Fig. 1. (a)Time series of precipitation (bars), daily SWC at 2 cm (lines), and biweekly SWC at 20 cm (circles).(b)Time series of the drought indexP−EP (grayed area) and its percentiles (gray line).(c)Time series of modeled soil evaporation (ES)from ISOLSM (solid line), canopy transpiration (ET)(dashed line), and theET/ESratio. We include winter time periods because winter precipitation and soil water content could affect the water cycle during pre-monsoon periods (∼April to June). Typical post-pulse patterns ofES,ET,andET/ESare displayed as an inset in(c).
negative values in August, and rebounded in early September (Fig. 1a;p <0.001,r2=0.3). SWC at 20 cm depth followed seasonal variation inP−EP(Fig. 1b;p <0.001,r2=0.3).
Mean daily ET (mm d−1) from days 100 to 304 were 0.7±0.1, 0.5±0.1, and 0.3±0.1 in 2006, 2007, and 2008, respectively. ET increased after rainfall events throughout the three years of sapflow measurements (Fig. 1c). Aver-age maximum changes in ET (mm d−1)after pulses were 0.6±0.2, 0.4±0.1 and 0.4±0.2 during pre-monsoon, mon-soon, and post-monsoon periods, respectively.ETdid not ex-ceed 0.3 mm day−1 when 9
pd was ≤ −1 MPa in monsoon and post-monsoon seasons, but did reach higher values for the same9pdduring the pre-monsoon seasons (Fig. A1); this is consistent with the relatively anisohydric behavior of ju-niper trees (McDowell et al., 2008a). Similarly,ETresponses to VPD were only strong when SWC≥15 %, with relatively shallow responses when soil moisture was low (i.e.,<15 %; Fig. 3a).
Modeled ES generally showed rapid spikes and subse-quent gradual decreases after rainfall events (inset in Fig. 1c). AsES declined,ET consistently increased, resulting in
in-creasingET/ES (Fig. 1c, 59 % of rain events) because soil evaporation responds rapidly to pulses, while the vegetation response was more gradual and long-lived because it takes longer for water to infiltrate, reach the rooting zone, transport through xylem, and transpire through the leaves (Reynolds et al., 2004). Strong positive responses ofETto VPD became evident when SWC >15 % (Fig. 3a). Average maximum changes inET/ESafter pulses were 4.3±1.3, 1.4±0.4 and 5.5±2.5 during pre-monsoon, monsoon, and post-monsoon periods, respectively.ET/ESpeaks were associated with ele-vated soil moisture after snowmelt and during relatively wet monsoon periods due to high values of ET (Fig. 1a and c, Table A1.).
42
Fig. 2.Annual and seasonal variation inδRover four years. Precipitation is also shown to facilitate visualization.δ18O of precipitation (open circle) for year 2006 is included. Filled boxes represent monsoon periods. An approach to calculate maximumδRchange is visualized as an inset.
Table 1.δ18O values of leaf water, stem water and soil water in 2005 and 2006. Alphabetic superscripts (a, b, and c) within columns indicate differences among the three groups using Tukey’s test (F=225.1,p <0.001). Different soil depths are denoted asd2 cm,e5 cm,f7 cm,g 10 cm, andh15 cm.
DOY/Year Day(s) after rain 18O (SMOW,‰)
Juniper foliagea Juniper stemb Soilsc
111/2005 6 21.3 −11.4 −10.5d
137/2005 2 18.2 −12.2 −8.9f
152/2005 18 15.2 −12.8 −3.2d,−11.3f
180/2005 3 25.3 −10.7 −1.1g
184/2005 7 20.8 −10.1
207/2005 8 16.4 −8.1 −5.6g
208/2005 0 9.6 −9.2 1.4g
223/2005 5 16.9 −6.7
151/2006 9 −1.5d, 3.7e, 2.6f, 2.5g, 0.6h
167/2006 7 23.3 −6.9
181/2006 1 17.6 −6.6 −1.8g
195/2006 4 26.7 −4 −1.4g
214/2006 1 13.9 −7.2 −2.2f
223/2006 1 14.6 −7.5 −8.4g
240/2006 2 16.5 −7.6
271/2006 6 15.1 −8.4 −4.3g
292/2006 4 10.5 −10.2 −2.4f
Mean±SE 4.9±1.1 17.6±1.2 −8.7±0.6 −2.2±1.0
δRenrichment after pulses was 28.7, 18.9, and 25.6 ‰ during pre-monsoon, monsoon and post-monsoon periods, respec-tively.
3.2 Patterns of water poolδ18O and relationships ofδR and hydrologic drivers after pulses
Juniper foliage water consistently had the highestδ18O val-ues (mean 17.6±0.2 ‰), followed by soil water (mean −2.2±1.0 ‰) and juniper stem water (−8.7±0.6 ‰) (Tukey’s test,F=225.1, p <0.001, Table 1). Foliar water
δ18O value was positively correlated with VPD (r2=0.7, p <0.001), but there was no correlation of mean 0–15 cm soil waterδ18O value with VPD (Fig. 2b).
Fig. 3. (a)The interannual and seasonalET–VPD relationships for three sets of SWC, 0–15 %, 15–25 %, and 25–35 %.(b)Correlations of foliar and soil waterδ18O values at 10 cm depth with VPD for year 2005 and 2006. The foliar regression equation isδ18O=7.7
+7.7 VPD,r2=0.7. Soil waterδ18O value was not significantly correlated with VPD.
during wetter periods and a limited range during drought. Thus,P−EPby itself was not a good predictor ofδR, per-haps due to the variable δ18O of rainfall events.δRon the day of rain events followed annualδ18O precipitation trends (r2=0.4, p=0.001). Indeed, pulse events induced an im-mediate decrease inδR (Fig. 4b). Following these immedi-ate depletions,δR subsequently became enriched following nearly all pulse events (Fig. 4c). Similarly,ETincreased fol-lowing rain events (Fig. 4a). The post-pulseδR enrichment typically reached a plateau within five days after the rain event (Fig. 5a–c). The largest and smallest enrichments oc-curred in pre-monsoon and monsoon seasons, respectively (Fig. 5a–c). The normalized δR enrichment was correlated withET(Fig. 5d–f).
The model accurately captured the temporal δR dynam-ics of the post-pulseδRenrichment (r2=0.7; Fig. 6). Sim-ulated depletion in δR immediately following precipitation events was often underestimated (mean underestimate of
Fig. 4. (a)The differences inETbetween the day of a rain event and the maximum value over the subsequent five days. Positive val-ues indicateETwas higher after the rain event than before. All rain events were included from DOY 60 to 300.(b)The difference in
δR between 1 day before a rain event andδR on the rainy day, shown for 2005–2008. Positive values indicateδRvalues become more depleted by the rain event.(c)The difference in normalized
δRbetween the night of a rain event and the maximum value over the subsequent five nights.δRvalues were normalized by the day zeroδRafter a rain event to make all starting values zero over the four years, thereby allowing examination of the response to the rain event. The maximum normalizedδRvalues within 5 days after pulse events typically captured the maximum enrichment (Fig. 5a–c).
45
Fig. 5. (a–c)Seasonal patterns of normalizedδRenrichment after rain pulses (the pulses are on day zero).δRvalues were normalized byδR on the day of the rain event to make all starting values zero over the four years.(d–f)The seasonal relationships between post-rain-pulse normalizedδRandET. MaximumET/ES values andr2values for the same period are added in each legend. MaximumET/ES>2 is expressed as bold.
one-way flux model, respectively; Fig. A4). The higher ac-curacy of the one-way flux model is consistent with large enrichment of chloroplast CO2. ISOLSM predicted that fo-liar C18OO flux was the dominant contributor to post-pulse δR enrichment during pre- and post-monsoon periods over the three years, whereas soil C18OO flux was the dominant contributor during monsoon periods (Fig. 7).
Consistent with our expectations,δRenrichment was cor-related with ET/ES (Fig. 8a). A stronger relationship be-tween δR and P −EP emerged after accounting for pre-cipitation effects on ecosystem water pools by calculat-ing the maximum δR change between the day of the rain event and the subsequent dry period (see methods,r2=0.4, p=0.001, Fig. 8b). This also highlights that increasing pre-cipitation and decreasing potential evapotranspiration both lead to larger enrichment ofδRafter rain events.
4 Discussion
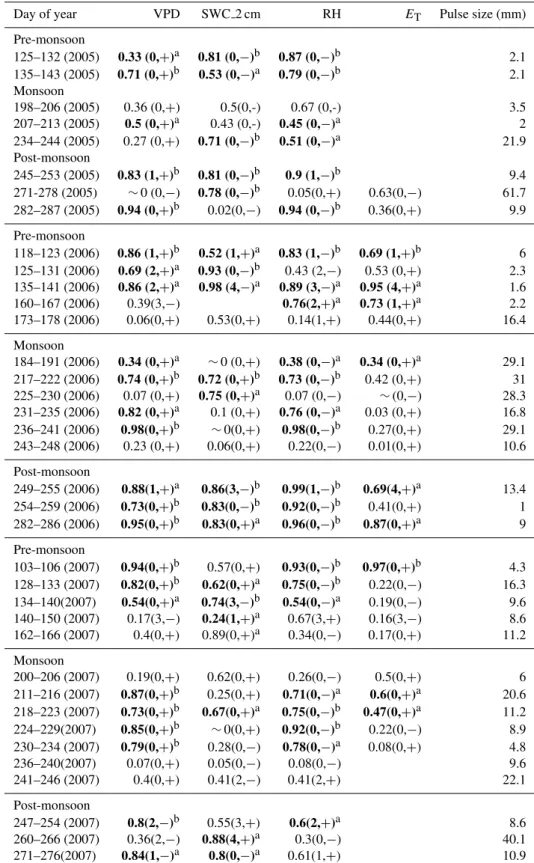
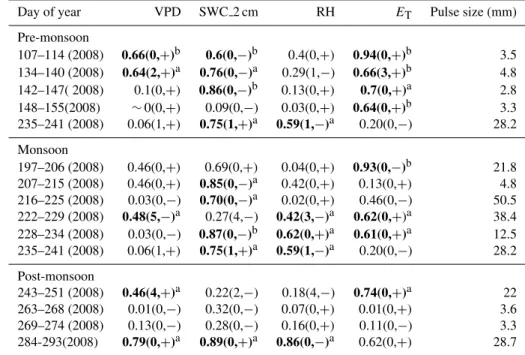
Table 2.Correlation coefficients (r2)ofδRwith VPD, SWC, RH, andETfor each pulse event. The number of days lagged is presented along with the sign of relationship in parentheses.aRegression significance:p≤0.1.bRegression significance:p≤0.05. Blanks: data not available. Horizontal dashed lines indicate season shifts between pre-monsoon, monsoon, and post-monsoon.
Day of year VPD SWC 2 cm RH ET Pulse size (mm)
Pre-monsoon
125–132 (2005) 0.33 (0,+)a 0.81 (0,−)b 0.87 (0,−)b 2.1 135–143 (2005) 0.71 (0,+)b 0.53 (0,−)a 0.79 (0,−)b 2.1 Monsoon
198–206 (2005) 0.36 (0,+) 0.5(0,-) 0.67 (0,-) 3.5 207–213 (2005) 0.5 (0,+)a 0.43 (0,-) 0.45 (0,−)a 2 234–244 (2005) 0.27 (0,+) 0.71 (0,−)b 0.51 (0,−)a 21.9 Post-monsoon
245–253 (2005) 0.83 (1,+)b 0.81 (0,−)b 0.9 (1,−)b 9.4 271-278 (2005) ∼0 (0,−) 0.78 (0,−)b 0.05(0,+) 0.63(0,−) 61.7 282–287 (2005) 0.94 (0,+)b 0.02(0,−) 0.94 (0,−)b 0.36(0,+) 9.9
Pre-monsoon
118–123 (2006) 0.86 (1,+)b 0.52 (1,+)a 0.83 (1,−)b 0.69 (1,+)b 6 125–131 (2006) 0.69 (2,+)a 0.93 (0,−)b 0.43 (2,−) 0.53 (0,+) 2.3 135–141 (2006) 0.86 (2,+)a 0.98 (4,−)a 0.89 (3,−)a 0.95 (4,+)a 1.6 160–167 (2006) 0.39(3,−) 0.76(2,+)a 0.73 (1,+)a 2.2 173–178 (2006) 0.06(0,+) 0.53(0,+) 0.14(1,+) 0.44(0,+) 16.4
Monsoon
184–191 (2006) 0.34 (0,+)a ∼0 (0,+) 0.38 (0,−)a 0.34 (0,+)a 29.1 217–222 (2006) 0.74 (0,+)b 0.72 (0,+)b 0.73 (0,−)b 0.42 (0,+) 31 225–230 (2006) 0.07 (0,+) 0.75 (0,+)a 0.07 (0,−) ∼(0,−) 28.3 231–235 (2006) 0.82 (0,+)a 0.1 (0,+) 0.76 (0,−)a 0.03 (0,+) 16.8 236–241 (2006) 0.98(0,+)b ∼0(0,+) 0.98(0,−)b 0.27(0,+) 29.1 243–248 (2006) 0.23 (0,+) 0.06(0,+) 0.22(0,−) 0.01(0,+) 10.6
Post-monsoon
249–255 (2006) 0.88(1,+)a 0.86(3,−)b 0.99(1,−)b 0.69(4,+)a 13.4 254–259 (2006) 0.73(0,+)b 0.83(0,−)b 0.92(0,−)b 0.41(0,+) 1 282–286 (2006) 0.95(0,+)b 0.83(0,+)a 0.96(0,−)b 0.87(0,+)a 9
Pre-monsoon
103–106 (2007) 0.94(0,+)b 0.57(0,+) 0.93(0,−)b 0.97(0,+)b 4.3 128–133 (2007) 0.82(0,+)b 0.62(0,+)a 0.75(0,−)b 0.22(0,−) 16.3 134–140(2007) 0.54(0,+)a 0.74(3,−)b 0.54(0,−)a 0.19(0,−) 9.6 140–150 (2007) 0.17(3,−) 0.24(1,+)a 0.67(3,+) 0.16(3,−) 8.6 162–166 (2007) 0.4(0,+) 0.89(0,+)a 0.34(0,−) 0.17(0,+) 11.2
Monsoon
200–206 (2007) 0.19(0,+) 0.62(0,+) 0.26(0,−) 0.5(0,+) 6 211–216 (2007) 0.87(0,+)b 0.25(0,+) 0.71(0,−)a 0.6(0,+)a 20.6 218–223 (2007) 0.73(0,+)b 0.67(0,+)a 0.75(0,−)b 0.47(0,+)a 11.2 224–229(2007) 0.85(0,+)b ∼0(0,+) 0.92(0,−)b 0.22(0,−) 8.9 230–234 (2007) 0.79(0,+)b 0.28(0,−) 0.78(0,−)a 0.08(0,+) 4.8 236–240(2007) 0.07(0,+) 0.05(0,−) 0.08(0,−) 9.6 241–246 (2007) 0.4(0,+) 0.41(2,−) 0.41(2,+) 22.1
Post-monsoon
Table 2.Continued.
Day of year VPD SWC 2 cm RH ET Pulse size (mm)
Pre-monsoon
107–114 (2008) 0.66(0,+)b 0.6(0,−)b 0.4(0,+) 0.94(0,+)b 3.5 134–140 (2008) 0.64(2,+)a 0.76(0,−)a 0.29(1,−) 0.66(3,+)b 4.8 142–147( 2008) 0.1(0,+) 0.86(0,−)b 0.13(0,+) 0.7(0,+)a 2.8 148–155(2008) ∼0(0,+) 0.09(0,−) 0.03(0,+) 0.64(0,+)b 3.3 235–241 (2008) 0.06(1,+) 0.75(1,+)a 0.59(1,−)a 0.20(0,−) 28.2
Monsoon
197–206 (2008) 0.46(0,+) 0.69(0,+) 0.04(0,+) 0.93(0,−)b 21.8 207–215 (2008) 0.46(0,+) 0.85(0,−)a 0.42(0,+) 0.13(0,+) 4.8 216–225 (2008) 0.03(0,−) 0.70(0,−)a 0.02(0,+) 0.46(0,−) 50.5 222–229 (2008) 0.48(5,−)a 0.27(4,−) 0.42(3,−)a 0.62(0,+)a 38.4 228–234 (2008) 0.03(0,−) 0.87(0,−)b 0.62(0,+)a 0.61(0,+)a 12.5 235–241 (2008) 0.06(1,+) 0.75(1,+)a 0.59(1,−)a 0.20(0,−) 28.2
Post-monsoon
243–251 (2008) 0.46(4,+)a 0.22(2,−) 0.18(4,−) 0.74(0,+)a 22 263–268 (2008) 0.01(0,−) 0.32(0,−) 0.07(0,+) 0.01(0,+) 3.6 269–274 (2008) 0.13(0,−) 0.28(0,−) 0.16(0,+) 0.11(0,−) 3.3 284-293(2008) 0.79(0,+)a 0.89(0,+)a 0.86(0,−)a 0.62(0,+) 28.7
Fig. 6. Comparison between measured and modeled maximumδR changes within 7 days of precipitation.
in part to constraints on the ET response (Figs. 1, 2, 4, 8 and Fig. A1) and changes inET/ES(Fig. 8a). These patterns support the contention of strong hydrological regulation of ecosystem function in semi-arid regions (Weltzin and Tis-sue, 2003) and suggest that long-term monitoring ofδRhas promise for understanding drought responses and detecting drought induced eco-physiological changes. Below, we ex-plore the potential mechanisms driving the drought signal of δR.
Rain reset near-surface soil and source (i.e., xylem water) δ18O values, causing immediateδRdepletions followed by subsequent enrichment as the ecosystem dried (Figs. 1, 4, 5),
47 Fig. 7.Time series of foliar, soil, and stem contributions to total ecosystem isoflux derived from ISOLSM. Filled boxes represent monsoon periods.
turnover of the leaf water pool (Cuntz et al., 2003a; Lai et al., 2006) and (2) incorporated a one-way flux model proposed by Cernusak et al. (2004).
Comparison of modeled and observedδR at this site in 2006 demonstrated that nocturnal isotopic equilibration of CO2with leaf waterδ18O value and subsequent atmospheric retro-flux may drive large enrichment inδR (McDowell et al., 2008b). The higher accuracy of the one-way flux model is consistent with large enrichment of chloroplast CO2 (Cer-nusak et al., 2004). This one-way flux model is similar to CO2 invasion and retro-flux in soils (Tans, 1998; Riley et al., 2005; Seibt et al., 2006). Stomata are assumed to be closed at night in many isotope land models; however, ac-cumulated evidence has shown that stomata are leaky at night in many species (Barbour et al., 2005; Dawson et al., 2007). Limited nocturnal, leaf-level measurements of stom-atal conductance (gc)confirmed that junipers do maintain some degree of stomatal conductance after sundown (up to 0.11 mol m−2s−1, SE=0.003, unpublished data). Markedly improvedδRprediction by ISOLSM suggests nocturnal gc leads to high CO2retro-diffusion and a faster exchange of leaf water with atmospheric water vapor at night, and the δ18O composition of leaf water may not be in equilibrium with xylem water at night (Cernusak et al., 2004; Seibt et al., 2006; Lai et al., 2006; Cuntz et al., 2007).
The δR values over four years of study showed δR en-richment following pulse events in 95 % of the observations (Fig. 2). Correlations ofδRwith VPD and RH over the subse-quent days after pulse events and lasting up to 11 days were stronger than for SWC (Table 2). These relationships suggest that declines in atmospheric vapor content following precip-itation pulses were a stronger driver ofδRpatterns than the availability of soil moisture per se (i.e., water content), con-sistent with observations from more mesic sites (Bowling et al., 2003a, b; Wingate et al., 2010).
The underlying drivers of the correlations of VPD and RH withδRare likely driven by both soil evaporation and canopy transpiration. The post-pulse normalizedδRenrichment cor-related strongly withET/ES over the three years from DOY 100 to 273 (Fig. 8a). Post-pulse δR enrichment was rela-tively small whenET/ES<2, due in part toET constraints and a higher contribution of soil C18OO flux to total isoflux (Figs.1, 5 – see legend). Post-pulseδRenrichment was sig-nificantly larger when ET and its relative contribution to ecosystem-scale evapotranspiration were large (Figs. 5, 8a) consistent with leaf-level observations in droughted plants. ThisδRenrichment was likely a result of the enrichment of foliar water as well as retro-diffusion with atmospheric CO2. With active transpiration, water transpired by foliage is more enriched than soil water (Table 1, Wingate et al., 2010) be-cause evaporation results in more efficient accumulation of heavier water molecules in leaf water than soil water (Ta-ble 1, Wang and Yakir, 1995; Barbour et al., 2005; Wingate et al., 2010). In our system, this enrichment resulted in a strong relationship between VPD and foliar waterδ18O val-ues, but no relationship between VPD and soil waterδ18O values (Fig. 3b). This more enriched foliar water is likely to persist several hours at night after transpiration ceases, as suggested by ISOLSM.
Fig. 8. (a)The relationship between maximumδRchange within 7–11 days after each pulse and meanET/ESchange for the same pe-riods. The regression equation isδR=15.4+6.0ET/ES,r2=0.4.
(b)Relationships between maximum δRchange and the drought indexP−EP. Each data point represents the combination of maxi-mumδRchange and meanP−EPover the same period, with each subset starting on the day of the rain pulse and extending to the day before the next rain pulse.
from ISOLSM provides evidence of higher foliar contribu-tion to total ecosystem isoflux relative to soil and stem com-ponents during pre-monsoon periods (Fig. 7). BothET and ESresponded strongly to spring rains despite their small size, yet ET/ES frequently exceeded 2 because of transient ES spikes and more sustained increases inET(Fig. 1c in inset, Fig. 5 in legend).
Soil isoflux contributed relatively more than leaf isoflux to the ecosystem signal during the monsoon periods (Fig. 7). The monsoon periods typically had more negative9pd, lower soil water content deep in the soil profile (Fig. 1), and higher temperatures, thus only particularly large rain events or many rainy days in a row triggered significant δR responses. ET increased within a few days after monsoon rains, but the ETamplitudes were small and post-pulseET/ESusually
re-mained below 1.5 (particularly for the dry 2007 and 2008 monsoon seasons, Figs. 1c, 5). The leastδR enrichment af-ter rain events was observed during seasons when the post-rainfallETresponse was small and the drought indexP−EP was highly negative (Fig. 8b). WhileδRwas strongly related to atmospheric vapor pressure deficit, the degree of enrich-ment appears constrained by the trees’ capacity to increase ET(Figs. 1, 5e, Fig. A1, Ferrio et al., 2009). However, fur-ther manipulative studies that alter VPD andET separately are needed to test models ofδ18O exchange.
Coupling of δR with VPD, RH, and ET occurred more rapidly, and more frequently, than observed for the δ13C value of ecosystem respiration (δ13CR)at this ecosystem for the same years (Table 2, Fig. A2, Shim et al., 2011). This more rapid coupling is likely due to the immediate exchange of oxygen atoms between respiring CO2 and water pools, leading to fast incorporation of the water isotopic signature into ecosystem respiration (Wingate et al., 2010). In con-trast, δ13CR is derived from the relatively slower transport of carbon from foliage to the mean location of respiration (foliage, stems, roots, and heterotrophic biomass), includ-ing additional lags due to autotrophic and heterotrophic stor-age (Bowling et al., 2008). These storstor-age effects, in partic-ular, make deciphering the information derived fromδ13CR measurements more difficult becauseδ13CRis frequently un-coupled from climate, at least in this semi-arid woodland (Shim et al., 2011). Thus, the relative value ofδRis enhanced not only by its unique representation of terrestrial hydrology, but also because its dependence on climate and physiology is more easily detected.
5 Conclusions
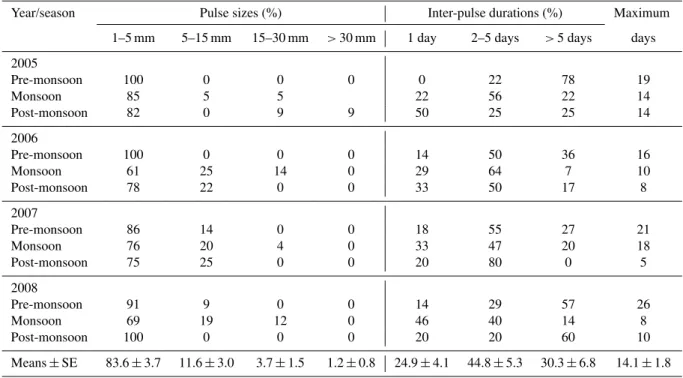
Table A1.Seasonal rain pulse sizes and inter-pulse duration shown as the percentage of events and durations, respectively. The numbers within parentheses are the number of rain events. The maximum days column shows the maximum number of days between pulse events.
Year/season Pulse sizes (%) Inter-pulse durations (%) Maximum
1–5 mm 5–15 mm 15–30 mm >30 mm 1 day 2–5 days >5 days days
2005
Pre-monsoon 100 0 0 0 0 22 78 19
Monsoon 85 5 5 22 56 22 14
Post-monsoon 82 0 9 9 50 25 25 14
2006
Pre-monsoon 100 0 0 0 14 50 36 16
Monsoon 61 25 14 0 29 64 7 10
Post-monsoon 78 22 0 0 33 50 17 8
2007
Pre-monsoon 86 14 0 0 18 55 27 21
Monsoon 76 20 4 0 33 47 20 18
Post-monsoon 75 25 0 0 20 80 0 5
2008
Pre-monsoon 91 9 0 0 14 29 57 26
Monsoon 69 19 12 0 46 40 14 8
Post-monsoon 100 0 0 0 20 20 60 10
Means±SE 83.6±3.7 11.6±3.0 3.7±1.5 1.2±0.8 24.9±4.1 44.8±5.3 30.3±6.8 14.1±1.8
H.
Shim
et
al.:
Hydr
ologic
c
ontr
ol
of
the
oxygen
isotope
ratio
of
ecosystem
respirati
on
4951
Fig. A2.Correlations ofδRwith VPD, RH, SWC, andET. Correlations were displayed individually for each rain event from day zero to dayNjust before the next rain event. We
present only significant best fits of regressions from lag analysis. Numbers after DOY in the figure legends represent slopes for each subset.
.biogeosciences.net/10/49
37/2013/
Biogeosciences,
10,
4937–
4956
,
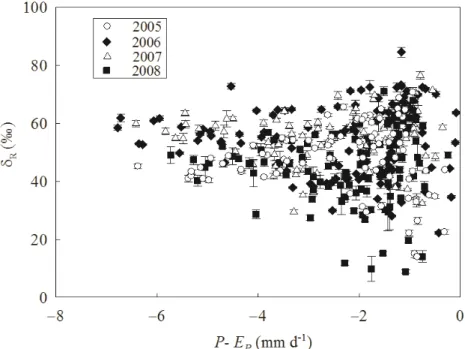
Fig. A3.Relationships betweenδRandP−EP. All nocturnal Keeling plot intercepts that passed QC criteria from DOY 100 to 273 were included.
Fig. A4.The relationships between modeledδRand observedδR. Dark and open circles represent model output after and before the one-way flux model (Cernusak et al., 2004) was incorporated, re-spectively. Data are included from DOY 100 to 273.
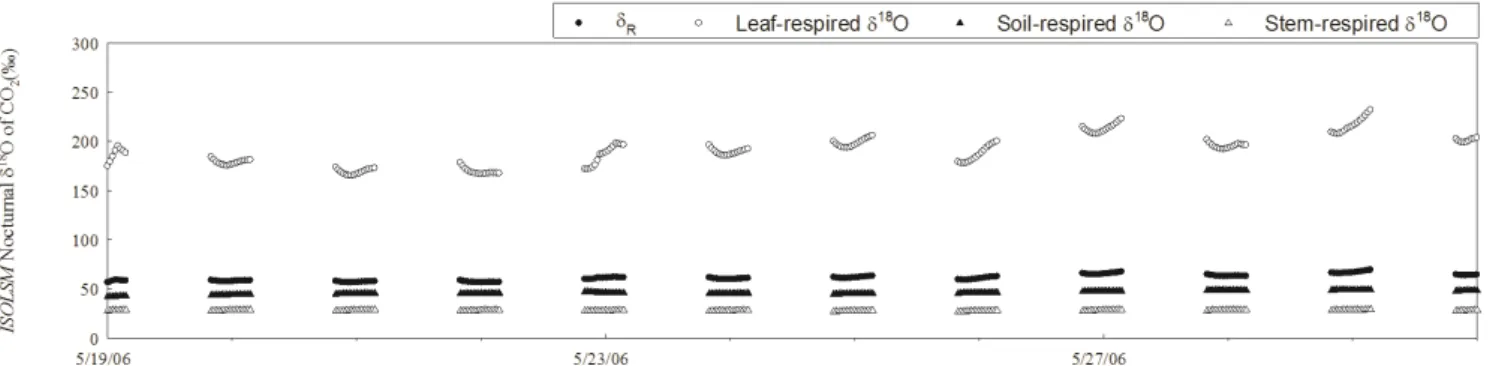
55 Fig. A6.ISOLSM simulation for nocturnalδR(filled circle),δ18O of foliar-respired CO2(open circle),δ18O of soil-respired CO2(filled triangle) andδ18O of stem-respired CO2(open triangle).
Fig. A7.Pulse precipitation events and associatedδ18O of precipitation in 2006 for the time periods presented in this manuscript.
Acknowledgements. We appreciate the technical and field support provided by Steve Sargent, Karen Brown, and numerous under-graduate interns during the four years of this study. Funding for this project was derived from LANL-Laboratory Directed Research and Development (LDRD), the Institute for Geophysical and Planetary Research (IGPP), and the Department of Energy, Office of Science, Office of Biological and Environmental Research (DOE-BER).
Edited by: C.-K. Kang
References
Barbour, M. M., Cernusak, L. A., Whitehead, D., Griffin, K. L., Turnbull, M. H., Tissue, and D. T., and Farquhar, G. D.: Noctur-nal stomatal conductance and implications for modelingδ18O of leaf-respired CO2in temperate tree species, Funct. Plant Biol., 32, 1107–1121, 2005.
Bickford, C. P., McDowell, N. M., Erhardt, E. B., and Hanson, D. T.: High frequency field measurements of diurnal carbon isotope discrimination and internal conductance in a semi-arid species, Juniperus monosperma, Plant Cell Environ., 32, 796–810, 2009. Bickford, C. P., Hanson, D. T., and McDowell, N. G.: Influence of diurnal variation in mesophyll conductance on modelled13C
discrimination: results from a field study, J. Exp. Bot., 61, 3223– 3233, 2010.
Birch, H. F.: Mineralization of plant nitrogen following alternative wet and dry conditions, Plant Soil, 20, 43–49,1964.
Bonan, G. B.: A land surface model (LSM version 1.0) for ecologi-cal, hydrologiecologi-cal, and atmospheric studies: Technical description and user’s guide, 150 pp., NCAR, Boulder, CO., 1996.
Bowling, D. R., McDowell, N. G., Bond B. J., Law, B. E., and Ehleringer, J. R.:13C content of ecosystem respiration is linked to precipitation and vapor pressure deficit, Oecologia, 131, 113– 124, 2002.
Bowling, D. R., McDowell, N. G., Welker, J. M., Bond, B. J., Law, B. E., and Ehleringer, J. R.: Oxygen isotope content of CO2in nocturnal ecosystem respiration: 1. Observations in forests along a precipitation transect in Oregon, USA, Global Biogeochem. Cy., 17, 1120, doi:10.1029/2003GB002081, 2003a.
Bowling, D. R., Sargent, S. D., Tanner, B. D., and Ehleringer, J. R.: Tunable diode laser absorption spectroscopy for stable iso-tope studies of ecosystem-atmosphere CO2exchange, Agr. For-est Meteorol., 118, 1–19, 2003b.
tope fractionation between CO2and H2O, Isotope Geosciences, 1, 181–190, 1983.
Breshears, D. D., Myers, O. B., Johnson, S. R., Meyer, C. W., and Martens, S. N.: Differential use of spatially heterogeneous soil moisture by two semiarid woody species:Pinus edulisand Ju-niperus monosperma, J. Ecol., 85, 289–299, 1997.
Breshears, D. D., Cobb, N. S., Rich, P. M., Price, K. P., Allen, C. D., Balice, R. G., Romme, W. H., Kastens, J. H., Floyd, M. L., Bel-nap, J., Anderson, J. J., Myers, O. B., and Meyer, C. W.: Regional vegetation die-off in response to global-change-type drought, P. Natl. Acad. Sci. USA, 102, 15144–15148, 2005.
Buenning, N., Noone, D. C., Riley, W. J., Still, C. J., and White, J. W. C.: Influences of the hydrological cycle on observed in-terannual variations in atmospheric CO18O, J. Geophys. Res.-Biogeo., 116, G04001, doi:10.1029/2010JG001576, 2011. Buenning, N., Noone, D. C., Randerson, J. T., Riley, W. J., and Still,
C. J.: The response of the18O content of atmospheric CO2to changes in environmental conditions, J. Geophys. Res.-Biogeo., in press, 2012.
Cappa, C. D., Hendricks, M. B., DePaolo, D. J., and Cohen, R. C.: Isotopic fractionation of water during evaporation, J. Geophys. Res.-Atmos., 108, 4525, doi:10.1029/2003JD003597, 2003. Cernusak, L. A., Pate, J. S., and Farquhar, G. D.: Diurnal
varia-tion in the stable isotope composivaria-tion of water and dry matter in fruitingLupinus angustifoliusunder field conditions, Plant Cell Environ., 25, 893–907, 2002.
Cernusak, L. A., Wong, S. C., and Farquhar, G. D.: Oxygen isotope composition of phloem sap in relation to leaf water inRicinus communis, Funct. Plant Biol., 30, 1059–1070, 2003.
Cernusak, L. A., Farquhar, G. D., Wong, S. C., and Stuart-Williams, H.: Measurement and interpretation of the oxygen isotope com-position of carbon dioxide respired by leaves in the dark, Plant Physiol., 136, 3350–3363, 2004.
Coplen, T. B.: New guidelines for reporting stable hydrogen, car-bon, and oxygen isotope-ratio data, Geochim. Cosmochim. Ac., 60, 3359–3360, 1996.
Cuntz, M., Ciais, P., Hoffmann, G., and Knorr, W.: A comprehen-sive global three- dimensional model ofδ18O in atmospheric CO21.Evaluation of surface fluxes, J. Geophys. Res., 108, 4527, doi:10.1029/2002JD003153, 2003a.
Cuntz, M., Ciais, P., Hoffmann, G., Allison, C.E., Francey, R.J., Knorr, W., Tans, P. P., White, J. W. C., and Levin, I.: A com-prehensive global three-dimensional model of delta O18 in at-mospheric CO2: 2. Mapping the atmospheric signal, J. Geophys. Res., 108, 4528, doi:10.1029/2002JD003154, 2003b.
Cuntz, M., Og´ee, J., Farquhar, G. D., Peylin, P., and Cernusak, L. A.: Modelling advection and diffusion of water isotopologues in leaves, Plant Cell Environ., 30, 892–909, 2007.
Dawson, T. E. and Ehleringer J. R.: Streamside trees that do not use stream water, Nature, 350, 335–337, 1991.
Dawson, T. E., Burgess, S. S. O., Tu, K. P., Oliveira, R. S., Santiago, L. S., Fisher, J. B., Simonin, K. A., and Ambrose, A. R.: Night-time transpiration in woody plants from contrasting ecosystems, Tree Physiol., 27, 561–575, 2007.
Ellis, A. W., Goodrich, G. B., and Garfin, G. M.: A hydroclimatic index for examining patterns of drought in the Colorado River Basin, Int. J. Climatol., 30, 236–255, 2010.
of leaf water in the non-steady state, Funct. Plant Biol., 32, 293– 303, 2005.
Farquhar, G. D. and Lloyd J.: Carbon and oxygen isotope effects in the exchange of carbon dioxide between plants and the atmo-sphere, in: Stable Isotopes and Plant Carbon – Water Relations, edited by: Ehleringer, J. R., Hall, A. E. and Farquhar, G. D., 47– 70, Academic Press, New York, USA, 1993.
Farquhar, G. D., Lloyd, J., Taylor, J. A., Flanagan, L. B., Syvertsen, J. P, and Ehleringer, J. R.: Vegetation effects on the isotope com-position of oxygen in atmospheric CO2, Nature, 363, 493–443, 1993.
Ferrio, J. P., Cuntz, M., Offermann, C., Siegwolf, R., Saurer, M., and Gessler, A.: Effect of water availability on leaf water iso-topic enrichment in beech seedlings shows limitations of current fractionation models, Plant Cell Environ., 32, 1285–1296, 2009. Flanagan, L. B., Brooks, J. R., Varney, G. T., Berry, S. C., and Ehleringer, J. R.: Carbon isotope discrimination during photo-synthesis and the isotope ratio of respired CO2in boreal forest ecosystems, Global Biogeochem. Cy., 10, 629–640, 1996. Flanagan, L. B., Brooks, J. R., Varney, G. T., and Ehleringer, J. R.:
Discrimination against C18O16O during photosynthesis and the oxygen isotope ratio of respired CO2in boreal forest ecosystems, Global Biogeochem. Cy., 11, 83–98, 1997.
Francey, R. J. and Tans, P. P.: Latitudinal variation in oxygen-18 of atmospheric CO2, Nature, 327, 495–497, 1987.
Fung, I., Field, C. B., Berry, J. A., Thompson, M. V., Randerson, J. T., Malmstr¨om, C. M., Vitousek, P. M., Collatz, G. J., Sellers, P. J., Randall, D. A., Denning, A. S., Badeck, F., and John, J. : Carbon 13 exchanges between the atmosphere and biosphere, Global Biogeochem. Cy., 11, 5070–533, 1997.
Gillon, J. S. and Yakir, D.: Naturally low carbonic anhydrase ac-tivity in C4and C3plants limits discrimination against C18OO during photosynthesis, Plant Cell Environ., 23, 903–915, 2000. Granier, A.: Evaluation of transpiration in a Douglas-fir stand by
means of sap flow measurements, Tree Physiol., 3, 309–319, 1987.
Griffis, T. J., Lee, X., Baker, J. M., Sargent, S. D., and King, J. Y.: Feasibility of quantifying ecosystem-atmosphere C18O16O exchange using laser spectroscopy and the flux-gradient method, Agr. Forest Meteorol., 135, 44–60, 2005.
Hamon, W. R.: Estimating potential evapotranspiration, Proceed-ings of the American Society of Civil Engineering, 871, 107– 120, 1961.
Helliker, B. R., Roden, J. R., Cook, C., and Ehleringer, J. R.: A rapid and precise method for sampling and determining the oxy-gen isotope ratio of atmospheric water vapor, Rapid Commun. Mass Sp., 16, 929–932, 2002
Henderson-Sellers, A., Fischer, M., Aleinov, I., McGuffie, K., Ri-ley, W. J., Schmidt, G. A., Sturm, K., Yoshimura, K., and Iran-nejad, P.: Stable water isotope simulation by current land-surface schemes: Results of iPILPS Phase 1, Global Planet. Change, 51, 34–58, 2006.
Huxman, T. E., Wilcox, B. P., Breshears, D. D., Scott, R. L., Snyder, K. A., Small, E. E., Hultine, K., Pockman, W. T., and Jackson, R.B .: Ecohydrological implications of woody plant encroach-ment, Ecology, 86, 308–319, 2005.
Ac., 13, 322–334, 1958.
Lai, C.-T., Ehleringer, J. R., Tans, P. P., Wofsy, S., Urbanski, S., and Hollinger, D.: Estimating photosynthetic 13C discrimination in terrestrial CO2exchange from canopy to regional scales, Global Biogeochem. Cy., 18, GB1041, doi:10.1029/2003GB002148, 2004.
Lai, C.-T., Riley, W., Owensby, C., Ham, J., Schauer, A., and Ehleringer, J. R.: Seasonal and interannual variations of car-bon and oxygen isotopes of respired CO2in a tallgrass prairie: Measurements and modeling results from 3 years with contrast-ing water availability, J. Geophys. Res.-Atmos., 111, D08S06, doi:10.1029/2005JD006436, 2006.
Lajtha, K. and Barnes, F. J.: Carbon gain and water-use in pinyon pine–juniper woodlands of northern New Mexico – field versus phytotron chamber measurements, Tree Physiol., 9, 59–67, 1991. Lee, X.,Smith, R., and Williams J.: Water vapor18O/16O isotope ratio in surface air in New England, USA, Tellus, 58B, 293–304, 2006.
Lynch, J. A., Grimm, J. W., and Bowersox, V. C.: Trends in pre-cipitation chemistry in the United States: A national perspective, 1980–1992, Atmos. Environ., 29, 1231–1246, doi:10.1016/1352-2310(94)00371-Q, 1995.
Mathieu, R. and Bariac, T.: An isotopic study (2H and18O) of wa-ter movements in clayey soils under a semi-arid climate, Wawa-ter Resour. Res., 32, 779–789, 1996.
McDowell, N. G., White, S., and Pockman, W. T.: Transpiration and stomatal conductance across a steep climate gradient in the southern Rocky Mountains, Ecohydrology, 1, 193–204, 2008a. McDowell, N. G., Baldocchi, D., Barbour, M., Bickford, C., Cuntz,
M., Hanson, D., Knohl, A., Powers, H., Rahn, T., Randerson, J., Riley, W. J., Still, C., Tu, K., and Walcroft, A.: Understanding the Stable Isotope Composition of Biosphere-Atmosphere CO2 Exchange, Eos, 89, 94–95, 2008b.
McDowell, N. G., Bowling, D. R., Schauer, A., Irvine, J., Bond, B. J., Law, B. E., and Ehleringer, J. R.: Associations between carbon isotope ratios of ecosystem respiration, water availability and canopy conductance, Glob. Change Biol., 10, 1767–1784, 2004.
Miller, J. B. and Tans, P. P.: Calculating isotopic fractionation from atmospheric measurements at various scales, Tellus B, 55, 207– 214, 2003.
Miller, J. B., Yakir, D., White, J. W. C., and Tans, P. P.: Measure-ment of18O/16O in the soil-atmosphere CO2flux, Global Bio-geochem. Cy., 13, 761–774, 1999.
Newman, B. D. and Robinson, B. A.: The hydrogeology of Los Alamos National Laboratory: site history and overview of va-dose zone and groundwater issues, Vava-dose Zone J., 4, 614–619, 2005.
Og´ee, J., Peylin, P., Cuntz, M., Bariac, T., Brunet, Y., Berbigier, P., Richard, P., and Ciais, P.: Partitioning net ecosystem car-bon exchange into net assimilation and respiration with canopy-scale isotopic measurements: An error propagation analysis with (CO2)-C13 and (COO)-O18 data, Global Biogeochem. Cy., 18, GB2019, doi:10.1029/2003GB002166, 2004.
Phillips, N. and Oren, R.: Intra- and inter-annual variation in tran-spiration of a pine forest in relation to environmental variability and canopy development, Ecol. Appl., 11, 385–396, 2001. Powers, H. H., Hunt, J. E., Hanson, D. T., and McDowell, N. G.: A
dynamic soil chamber system coupled with a tunable diode laser
for online measurements ofδ13C andδ18O of soil respired CO2, Rapid Commun. Mass Sp., 24, 243–253, 2010.
Rauscher, S. A., Giorgi, F., Diffenbaugh, N. S., and Seth, A.: Ex-tension and Intensification of the Meso-American mid-summer drought in the twenty-first century, Clim. Dynam., 31, 551–571, 2008.
Reynolds, J. F., Kemp, P. R., and Tenhunen, J. D.: Effects of long-term rainfall variability on evapotranspiration and soil water dis-tribution in the Chihuahuan Desert: A modeling analysis, Plant Ecol., 150, 145–159, 2000.
Reynolds, J. F., Kemp, P. R., Ogle, K., and Fernandez, R. J.: Modi-fying the ‘pulse-reserve’ paradigm for deserts of North America: precipitation pulses, soil water, and plant responses, Oecologia, 141, 194–210, 2004.
Rich, P. M., Breshears, D. D., and White, A. B.: Phenology of mixed woody-herbaceous ecosystems following extreme events: net and differential responses, Ecology, 89, 342–352, 2008. Riley, W. J.: A modeling study of the impact of theδ18O value of
near-surface soil water on theδ18O value of the soil-surface CO2 flux, Geochim. Cosmochim. Ac., 69, 1939–1946. 2005. Riley, W. J. and Still, C. J.: Constraints on the use of18O in CO2
as a tracer to partition gross carbon fluxes, paper presented at American Geophysical Union, 10–14 December, San Francisco, CA, 2003.
Riley, W. J., Still, C. J., Torn, M. S., and Berry, J. A.: A mechanistic model of H182 O and C18OO fluxes between ecosystems and the atmosphere: Model description and sensitivity analyses, Global Biogeochem. Cy., 16, 1095–1109, 2002.
Roden, J. S. and Ehleringer, J. R.: Observations of hydrogen and oxygen isotopes in leaf water confirm the Craig-Gordon model under wide-ranging environmental conditions, Plant Physiol., 120, 1165–1173, 1999.
Rozanski, K. C., Sonntag, C., and Munnich, K. O.: Factors control-ling stable isotope composition of European precipitation, Tellus, 34, 142–150, 1982.
Schaeffer, S. M., Miller, J. B., Vaughn, B. H., White, J. W. C., and Bowling, D. R.: Long-term field performance of a tunable diode laser absorption spectrometer for analysis of carbon iso-topes of CO2in forest air, Atmos. Chem. Phys., 8, 5263–5277, doi:10.5194/acp-8-5263-2008, 2008.
Schwalm, C. R., Williams, C. A., Schaefer, K., Anderson, R., Arain, M. A., Baker, I., Barr, A., Black, T. A., Chen, G., Chen, J.M., Ciais, P., Davis, K. J., Desai, A., Dietze, M., Dragoni, D., Fis-cher, M.L., Flanagan, L.B., Grant, R., Gu, L.H., Hollinger, D., Izaurralde, R. C., Kucharik, C., Lafleur, P., Law, B.E., Li, L.H., Li, Z.P., Liu, S. G., Lokupitiya, E., Luo, Y. Q., Ma, S. Y., Margo-lis, H., Matamala, R., McCaughey, H., Monson, R. K., Oechel, W.C., Peng, C. H., Poulter, B., Price, D.T., Riciutto, D. M., Ri-ley, W., Sahoo, A. K., Sprintsin, M., Sun, J. F., Tian, H. Q., Tonitto, C., Verbeeck, H., and Verma, S. B.: A model-data in-tercomparison of CO2exchange across North America: Results from the North American Carbon Program site synthesis, J. Geo-phys. Res.-Biogeo., 115, G00H05, doi:10.1029/2009JG001229, 2010.
ableδ18O signatures of soil CO2fluxes indicate carbonic anhy-drase activity in a forest soil, J. Geophys. Res., 111, G04005, doi:10.1029/2006JG000177, 2006.
Sharp, Z. D.: Principles of Stable Isotope Geochemistry, Prentice Hall, 344 pp., 2005.
Shim, J. H., Powers, H. H., Meyer, C. W., Pockman, W. T., and McDowell, N. G.: The role of inter-annual, seasonal, and synop-tic climate on the carbon isotope ratio of ecosystem respiration at a semi-arid woodland, Glob. Change Biol., 17, 2584–2600, doi:10.1111/j.1365-2486.2011.02454.x, 2011.
Still, C. J., Riley, W. J., Helliker, B. A., and Berry, J. A.: Simula-tion of ecosystem oxygen-18 CO2 isotope fluxes in a tallgrass prairie: Biological and physical controls, in: Stable Isotopes and Biosphere-Atmosphere Interactions, edited by: Flanagan, L. B., Ehleringer, J. R., and Pataki, D. E., Elsevier-Academic Press, 2005.
Still, C. J., Riley, W. J., Biraud, S. C., Noone, D. C., Buenning, N. H., Randerson, J. T., Torn, M. S., Welker, J., White, J. W. C., Vachon, R., Farquhar, G. D., and Berry, J. A.: Influence of clouds and diffuse radiation on ecosystem-atmosphere CO2 and CO18O exchanges, J. Geophys. Res.-Biogeo., 114, G01018, doi:10.1029/2007JG000675, 2009.
Tang, J. Y. and Zhuang, Q. L: Equifinality in parameter-ization of process-based biogeochemistry models: A sig-nificant uncertainty source to the estimation of regional carbon dynamics, J. Geophys. Res.-Biogeo., 113, G04010, doi:10.1029/2008jg000757, 2008.
Tans, P. P.: Oxygen isotopic equilibrium between carbon dioxide and water in soils, Tellus B, 50, 163–178, 1998.
Tans, P. P. and White, J. W. C.: In balance, with a little help from the plants, Science, 281, 183–184, 1998.
Walker, G. R., Hughes, M. W., Allison, G. B., and Barnes, C. J.: The movement of isotopes of water during evaporation from a bare soil surface, J. Hydrol., 97, 181–197, 1988.
Wang, X.-F. and Yakir, D.: Temporal and spatial variations in the oxygen-18 content of leaf water in different plant species, Plant Cell Environ., 18, 1377–1385, 1995
Welker, J. M.: Isotopic (delta O18) characteristics of weekly precip-itation collected across the USA: an initial analysis with appli-cation to water source studies, Hydrol. Process., 14, 1449–1464, 2000.
chang of CO2 and δ18O-CO2 vaires with postfire succesion in boreal forest ecosystems, J. Geophys. Res., 111, G03007, doi:10.1029/2005JG000126, 2006.
Welp, L. R., Keeling, R. F., Meijer, H. A. J., Bollenbacher, A. F., Piper, S. C., Yoshimura, K., Francey, R. J., Allison, C. E., and Wahlen, M.: Interannual variability in the oxygen isotopes of at-mospheric CO2driven by El Nino, Nature, 477, 579–582, 2011. Weltzin, J. F. and Tissue, D. T.: Resource pulses in arid environ-ments – patterns of rain, patterns of life, New Phytol., 157, 171– 173, 2003.
White, J. W. C. and Gedzelman, S. D.: The isotope compo-sition of atmospheric water vapor and the concurrent me-teorological conditions, J. Geophys. Res., 89, 4937–4939, doi:10.1029/JD089iD03p04937, 1984.
Wilson, K. B., Hanson, P. J., Mulholland, P. J., Baldocchi, D. D., and Wullschleger, S. D.: A comparison of methods for determin-ing forest evapotranspiration and its components: sap-flow, soil water budget, eddy covariance and catchment water balance, Agr. Forest Meteorol., 106, 153–168, 2001.
Wingate, L., Og´ee, J., Cuntz, M., Genty, B., Reiter, I., Seibt, U., Yakir, D., Peylin, P., Miller, J., Burlett, R., Maseyk, K., Mencuc-cini, M., Pendall, E., Shim, J. H., Barbour, M., Hunt, J., Mor-tazavi, B., and Grace, J.: The impact of soil microorganisms on the global budget of delta O18in atmospheric CO2, P. Natl. Acad. Sci. USA, 106, 22411–22415, doi:10.1073/pnas.0905210106, 2009.
Wingate, L., Og´ee, J., Burlett, R., and Bosc, A.: Strong seasonal18O disequilibrium between leaf and soil CO2fluxes, Glob. Change Biol., 16, 3048–3064, doi:10.1111/j.1365-2486.2010.02186.x, 2010.
Yakir, D. and Wang, X.-F.: Fluxes of CO2and water between terres-trial vegetation and the atmosphere estimated from isotope mea-surements, Nature, 380, 515–517, 1996.