Spatial and Temporal Changes in Salinity of Arable Lands in Shah Bandar
Tehsil, Thatta District, Sindh
Shella Bano*
1, Viqar Husain
1, Ghulam Murtaza
2, Salman Zubair
3,Syed Waseem Haider
41
Department of Geology, University of Karachi, Pakistan.
2Pakistan Council of Research in Water Resources (PCRWR) Karachi, Pakistan.
3Department of Geography, University of Karachi, Pakistan.
4National Institute of Oceanography, Clifton, Karachi, Pakistan.
*Email:
[email protected]
Received: 18 October, 2016 Revised: 22 December 2016
Abstract: The cultivable lands are reducing significantly in hot and dry arid regions of the world due to soil salinity and sodicity resulting in yield losses. Similarly, the coastal Shah Bandar Tehsil of Thatta district is also severely affected by different levels of soil salinity and sodicity. The topography of the area is uneven, so ill drained depressions and saline creeks are common. This area was worst affected by floods of 2010 and 2011. The flood water kept standing for several months causing water logging in the area. Irrigation is done with perennial and non perennial canals, as groundwater is highly saline due to saltwater flooding and seawater intrusion. In order to identify spatial and temporal variations in soil salinity and sodicity, 48 soil samples were collected from six sites of Shah Bandar Tehsil during Post and Pre monsoon seasons of 2011-2013. Physicochemical data indicate that average pHe of soil ranges between 7.4 and 7.8 during Post and Pre monsoon seasons of 2011-2013. While soil salinity (ECe) and sodicity (SAR) ranged from 1.09 to 47.10 dS/m and 2.43 to 43.79 during Post monsoon seasons of 2011 and 2013 respectively. Whereas, during Pre-monsoon seasons of 2012 and 2013, EC and SAR ranged from 2.30 to 65.8 dS/m and 3.12 to 50.51 respectively. Thus, soil salinity and sodicity vary from site to site and season to season due to arid climate, high evapotranspiration and fallow lands because of reduced flow of freshwater and seawater intrusion. Data show that the soil quality improved significantly as indicated by reduced soil salinity and sodicity due to floods of 2010 and 2011.
Keywords: Soil salinity, temporal and spatial variation, coastal area, seawater intrusion, flood effects.
Introduction
Soils of arid and semi arid regions of the world are frequently saline and sodic causing low agricultural productivity (Shrivastava and Kumar, 2015). The whole world is suffering from coastal soil salinity (Velmarugan et al., 2016) due to submergence by saline water, tidal flooding and upward or lateral movement of saline groundwater during dry seasons (Haque, 2006; Rasel et al., 2013). Such zones are also subjected to severe shortage of water due to lack of precipitation and relatively high evapotranspiration rates (Tweed et al., 2011). These problems impose stress on agricultural crops, reducing yields when critical thresholds are surpassed (Shaw, 1988; Sadras and Milory, 1996; Aslam et al., 2006). Similarly, in Pakistan out of the total cultivated area, 6.30 million hectares of land is degraded due to soil salinity and sodicity. It results in slow water movement, dispersion of finer soil particles, soil deterioration and hampered crop yields to a considerable extent (Yaseen and Ishtiaque, 2002).
Present study is aimed to evaluate soil salinity and its geochemistry spatially in Shah Bandar Tehsil during Post and Pre-monsoon seasons of 2011-2013. To understand and quantify extents and patterns of soil
salinity (ECe) and sodicity (SAR), samples of top soil layers of Shah Bandar Tehsil were collected. Another objective was to assess the effects of 2010 and 2011 floods on soil salinity and crops in the study area. The main crops are rice, sugarcane and sunflower, which are mostly cultivated during Post monsoon season due to availability of canal water. While during Pre-monsoon seasons, downstream ecosystem received insufficient flow of water due to abstraction of large amount of water from river (IUCN, 2003). During this period, canals mostly remain dry which badly affect the agriculture. However, few crops of pulses and vegetables were cultivated in the area during Pre-monsoon seasons of 2012 and 2013.
Geology of the Study Area
The study area lies between latitude 24º 12´ to 24º 24´ N and longitude 67º 35´ to 67º 59´ E, covering the coastal parts of Shah Bandar tehsil of Thatta district Sindh (Fig. 1). It is surrounded by Hyderabad and Dadu districts in north, Arabian Sea in south, Indus River in the east and Karachi district in the west. According to Khan and Akbar (2011), Thatta is predominantly agricultural district in Sindh province, where almost a third of land has been affected by salt water intrusion.
ISSN: 2223-957X www.econ-environ-geol.org
The climate of the area is arid and tropical marine (RSS, 1979). Temperature ranges from about 25 ºC to 40 ºC and average rainfall does not exceed 200 mm (8 inches) per annum (DDMA, 2008). Canals are passing through the study area, which receives water for few months during a year. Groundwater is highly saline because of tidal flooding and seawater intrusion. The water table depth ranges from 2 to 25 feet from general ground surface depending upon topography. Hence, cultivation is based on monsoon rains and canal water. The flooding with monsoon rains and water logging is also seen in some parts of the study area. Flood water keeps standing for 3-4 months in depressions due to uneven topography and losts through evaptranspira-tion.Two types of landforms are recognized in the area, the river plain and coastal belt. The river plain lies
between Indus River and flood protection embankment (SSP, 1979). The coastal belt is under regular tidal flooding by sea water which is causing increased soil salinity and sodicity, thus badly affecting the soil fertility. As a result, the cultivable land is reducing fast in the study area.
Materials and Methods
Soil Sampling and Analysis: Total offorty eight soil samples were taken at the depths of 0-12" and 12-24" during Post and Pre-monsoon seasons of 2011-2013 from six sites in Daulatpur, Jungo, Goongani and Chohar Jamali Union Councils in Shah Bandar Tehsil. These sites included Siddique Punnalo (site-1), M. Ismail Babro (site-2), Haji Jam Chandio (site-3), Syed
Jalal Shah (site-4), Ghar Moon (site-5) and Wadero Chutto Ratlo (site-6) villages (Table 1). Extract of soil samples was analyzed for determining pHe, ECe, cations and anions. Sodium adsorption ratios (SAR) of these samples were also calculated. Spatial maps along with the sample locations were plotted to indicate temporal variation in the soil salinity (ECe) and sodicity (SAR) during Post and Pre-monsoon seasons of 2011-2013.
Results and Discussion
The texture, available crops and variation in physicochemical characteristics of the soil in the six sites of Shah Bandar Tehsil are discussed below.
1. Siddique Punnalo (Daulatpur Union Council): Siddique Pnnalo site of Daulatpur Union Council is low lying area with uneven topography and very close to the sea. As a result, the soil of this site remained highly saline and sodic than other sites throughout Post and Pre-monsoon seasons of 2011-2013 (Figs. 3a-d, 4a-d). Soil pHe of this site ranged between 6.6 to 7.5 during Post and Pre-monsoon seasons of 2012-2013. Data indicate that contents of all cations and anions remained higher at the depth of 0-12" (top soil) than 12-24" (sub soil) due to scarcity of rainfall, dry arid climate and high evapotranspiration (Mondal et al., 2001).
Further, spatial maps (Figs. 3b, c, 4b, c) show that soil salinity and sodicity reached maximum level during Pre-monsoon seasons of 2012 and 2013 (Mean, ECe=53.475dS/m and SAR=46.78) as compared to Post monsoon seasons of 2011 and 2013 (Mean, ECe=28.19dS/m and SAR=33.42) and remained Saline Sodic (WAPDA, 2001) throughout 2011-2013 (Table 2). In Pre-monsoon period, thick white salt layer (Fig. 2) was observed on top soil surface due to continuous evapotranspiration and capillarity (IPCC, 2007b; Shimojima et al.,1996; Fujimaki et al.,2006; Acosta et al., 2011; Pisinaras et al.,2009; USDA,1954). These accumulated salts negatively affect soil fertility (ESP, 2012) hence, no crop was cultivated throughout 2011-2013 seasons in this area (Fig. 2). High ECe and
SAR deteriorate silt loam texture soil in the area (Table 1, 2). It results in low infiltration rate, specific ion effects and deficiencies of several nutrients in soil such as Fe, Cu, K, Mn, and Zn (Sumner, 1993; Naidue and Rengasmy 1993; Qadir and Schubert 2002). The physical and chemical properties of this site can be effectively improved by growing halophytes (Marcar et al., 1995; Garg, 1998; Ravindran et al., 2007; Wu et al., 2009). Moreover, this area was not affected by floods of 2010 and 2011.
2. M. Ismail Babro (Daulatpur Union Council): In M. Ismail Babro village of Dulatpur Union Council, silt loam and silt clay loam textures were found at the depths of 0-12" and 12-24" respectively (Table 1). At this site pHe of soil extract ranged from 7.4 to 7.9 during Post-monsoon seasons of 2011 and 2013 (Table 2). While during Pre-monsoon seasons of 2012 and 2013 it ranged between 8.0 - 8.2 due to high temperature and low moisture content in soil (USDA, 1998). ECe of top soil layer remained slightly higher (4.74 dS/m) than permissible limit (4 dS/m) during both Post- monsoon seasons of 2011 and 2013 (Figs. 3a, d) but sodicity (SAR) decreased from 18.09 to 13.0 during Post monsoon seasons of 2011 and 2013 respectively (Table 2, Figs. 4a, d). It may be due to flood of 2010 and cultivation of sunflower crop during Post 2011, 2013 and Pre-2012 seasons in the area. Higher soil salinity (ECe=6.17 dS/m) and sodicity (SAR=20.35) were found during Pre-monsoon 2012. It may be due to capillarity of saline groundwater from deeper aquifers to soil surface and in root zones of agriculture crop and pasture (LSWS, 1987). Moreover, the area suffered from low rainfall during 2012, which also caused insufficient leaching to move salts out of soil profile (Duchaufour, 1982).
This site was saline sodic during Post-2011 and Pre-2012. As this area remained cultivated with sunflower crop which resulted in reduced soil salinity and sodicity during Pre-2013 and the soil quality improved from Saline Sodic to Non Saline Non Sodic. Further, this site remained uncultivated during Pre-2013 season due to increased salinity and sodictiy resulting in
Saline Non Sodic and Non Saline Sodic soils at the depths of 0-12" and 12-24" respectively (Table 2).
3. Jam Chandio Village (Jungo Union Council): The physicochemical analysis indicates that pHe of soil
ranged between slightly (7.5) to moderately alkaline (8.3) during Post-2011 to Post-2013 seasons (Table 2).
Topography of this area is even and it remained unaffected by floods of 2010 and 2011.Textural
Table 1 Location and texture of soil samples from Shah Bandar (2011- 2013).
Grid Site Village U.Council Depth GPS Textural
Class
Mechanical Analysis
Inch N S Sand% Silt% Clay%
58 1 Siddique Punlano Daulatpur 0-12 24 12 27 67 53 23 Silt loam 20.4 60.8 18.8 12-24 24 12 27 67 53 23 Silt loam 17.2 54.0 28.0
57 2 M.Ismail Babro Daulatpur 0-12 24 14 23 67 54 01 Silt loam 17.2 70.0 12.8 12-24 24 14 23 67 54 01 Silt clay loam 17.2 52.0 30.8
56 3 H. Jam Chandio Jungo
0-12 24 17 44 67 55 36 Silt clay loam 17.2 48.0 36.8 12-24 24 17 44 67 55 36 Silt clay loam 17.2 47.6 34.8 24-36 24 17 44 67 55 36 Silt loam 16.8 60.4 22.8 36-48 24 17 44 67 55 36 Silt clay loam 16.8 48.4 34.8
55 4 Syed Jalal Goongani 0-12 24 17 44 67 55 35 Silt loam 20.8 68.4 10.8 12-24 24 17 44 67 55 35 Silt loam 30.8 58.4 10.8
54 5 Ghar Moon Chohar Jamali 0-12 24 23 29 67 58 26 Silt loam 16.8 74.4 8.8 12-24 24 23 29 67 58 26 Silt loam 16.8 64.4 18.8
classification shows silt clay loam texture at the depths 0-12", 12-24" and 36-48" respectively. While silt loam texture is noted at 24-36" depth (Table 1).
Spatial maps (Figs. 3a, 4a) show high salinity and sodicity of soil during Post-2011, while during remaining seasons, ECe and SAR concentrations reduced and the area of good soil condition increased during last Post monsoon season of 2013 (Figs. 3b, c, d, 4b, c, d). Data revealed that Na and Cl ions along with other cations and anions were higher in top to deeper soil layers during Post monsoon-2011 season than in the remaining seasons of 2012 and 2013 (Table 2). As a result, no crop was cultivated in the area during Post monsoon 2011 season. While during Pre-2012, cultivation of sunflower crop reduced soil salinity in top soil layer from 13.90 to 6.51 dS/m and sodicity from 26.41 to 15.23 respectively. Further during Pre-monsoon, 2013 fallow land resulted in increased high sodicity (SAR) from 15.23 to 19.03, which is mainly due to appreciable upward movement of shallow saline groundwater and high evapotranspiration (Abrol, 1986). However, during last
Post season of 2013, soil type changes to Non Saline Non Sodic due to <4dS/m (ECe) and <14 (SAR). It is because of cultivated rice crop in the field.
4. Syed Jalal Shah (Goongani Union Council):Soil texture of this site is silt loam with 68.4 % silt at the depth of 0-12" while, textural class remains same (silt loam) at the depth of 12-24" with 58.4 % silt (Table 1). Soil pHe of Syed Jalal Shah area remained alkaline and ranged between 7.6 to 8.2 and 7.9 to 8.1 during Post (2011, 2013) and Pre-monsoon seasons (2012, 2013) respectively. Temporal maps indicates that ECe and SAR concentrations did not exceed the permissible limits of 4dS/m and 14 throughout Post and Pre monsoon seasons of 2011-2013 (Figs. 3a-d, 4a-d). Moreover, soil remained Non Saline Non Sodic throughout 2011-2013 seasons, which was mainly due to flood of 2011, that caused lateral and vertical movement of salts from soil profile (McLeod, 2010). Further, this site has no topographic depressions resulting in flushing of salts of all flood water 2011.
quality was good. But during Pre-monsoon 2012 and 2013, sugarcane and sunflower crops were cultivated in the field. However, during Post-2013, sugarcane was cultivated (Figs. 5, 6). Good quality of soil and agricultural practices in the area may also be the result of minor branch canal from Kanto Wah non perennial canal which is passing through this area.
5. Ghar Moor (Chohar Jamali Union Council): Texture of Ghar Moor soil is silt loam at the depths of 0-12" (sand 16.8 %, silt 64.4%, clay 18.8%) and 12-24" (sand 16.8 %, silt 74.4%, clay 8.8%) respectively. Topography of the area is even and the site experienced no floods during 2010 and 2011. Maps (Figs. 3a-d, 4a-d) indicate that this site remained within safe limit of soil salinity and sodicity. It may due to impact of seepage of canal water, as this area is at the distance of 50 km from Ghar Moori branch canal.
Data revealed pHe of soil ranged between 7.4 to 8.1 during Post and Pre monsoon 2011 to 2013 seasons (Table 2). ECe and SAR concentrations along with other salinity parameters were found higher in top soil
layer than sub soil (Table 2, 3). The soil was slightly sodic during Post-2011 but changed to Non Saline Non Sodic type during remaining seasons of 2012 -2013. However, the soil quality was good, but no crop was seen cultivated during throughout the period of 2011-2013. It is due to the shortage of irrigation water, as no minor water course is passing through this area. It is suggested that small water course may be constructed from main canal to irrigate the area.
6. Wadero Chutto Ratlo (Chohar Jamali): Texture of top soil sample constitutes clay (>40% clay, >32% silt, > 26% sand) and silt loam (>60% silt, 18% clay, 20% sand) in subsoil (Table 1). The area remained unaffected with floods of 2010 and 2011. Data show that pHe of soil ranged between 7.4 - 8.1 during Post and Pre-monsoon seasons of 2011 to 2013 (Table 2). Spatial maps (Figs. 3a, 4a) show that soil salinity and sodicity were within the safe limits of 4dS/m and 14
respectively during Post-2011. But during Pre-2012 severe aridity caused significant increase in soil salinity (7.29 dS/m) and sodicity (22.3) (Figs. 3a, 4b). Moreover, sodium concentration remained high in top
Fig. 5Sunflower crop cultivated during Pre-2013 in Syed Jalal Shah village.
soil layer throughout 2011-2012 due to clay texture which holds sodium and reduces infiltration and hydraulic properties of soil (Pearson et al., 2003).
Data revealed that good quality (Non Saline Non Sodic) soil is changed to Saline Sodic type because of absence of cultivation in the area throughout 2011-2013 seasons (Table 2). Further, shortage of irrigation water due to lack of even minor water course is also badly hampering the agriculture in the area.
Conclusion
Soil salinity was found higher during Pre monsoon seasons due to severe arid climatic conditions, low rainfall, shortage of canal irrigation water and capillarity of saline groundwater from shallow depth. While, it was low during Post monsoon seasons, which may be due to leaching of salts because of downward movement of rainwater into deeper soil layers. During monsoon and flood period, soil gets enough water which decreases its soil salinity as rain/flood water dilutes the concentration of salts in the soil.
It is concluded that the soil quality improved and the area under cultivation increased due to significant decrease in soil salinity after the floods of 2010 and
2011 and heavy monsoon rains. However, in some parts of the study area due to ill drained depressions and absence of artificial drainage, flood water kept
standing for several months in the fields. It resulted in waterlogged soil due to clay dominated texture and appearance of salt encrustations on the surface after evaporation of flood water. In order to improve the soil quality further, it is recommended that the crops of pulses and vegetables should be grown during dry seasons. While, in Post monsoon season all types of crops can be grown provided irrigation water is available. There is a need to create awareness among farmers to cultivate crops in both seasons, as fallow lands result in increased soil salinity in the study area.
Acknowledgement
Authors are thankful to Pakistan Science Foundation for providing financial support under the Project PSF/NSLP/S-KU (140) to carry out present work. Thanks are also due to Mr. Yar Muhammad, Soil and Water Testing Laboratory (DRIP) PCRWR, Tandojam for doing soil testing analysis.
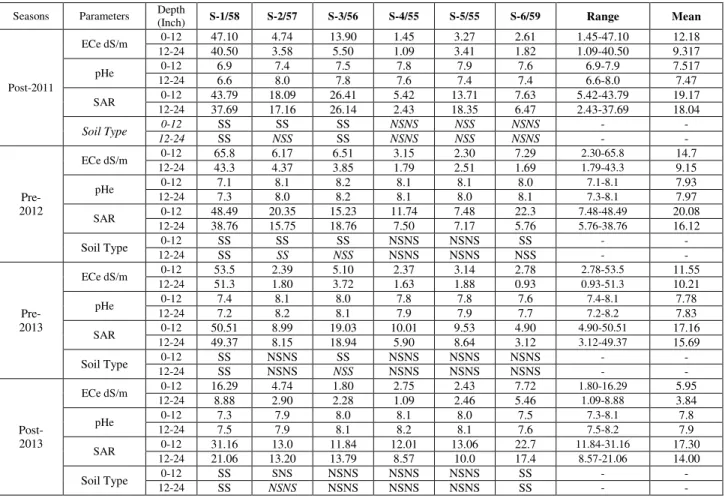
Table 2 Physico-chemical analysis of soil during Post and Pre- seasons of 2011-2013.
Seasons Parameters Depth
(Inch) S-1/58 S-2/57 S-3/56 S-4/55 S-5/55 S-6/59 Range Mean
Post-2011
ECe dS/m 0-12 47.10 4.74 13.90 1.45 3.27 2.61 1.45-47.10 12.18
12-24 40.50 3.58 5.50 1.09 3.41 1.82 1.09-40.50 9.317
pHe 0-12 6.9 7.4 7.5 7.8 7.9 7.6 6.9-7.9 7.517
12-24 6.6 8.0 7.8 7.6 7.4 7.4 6.6-8.0 7.47
SAR 0-12 43.79 18.09 26.41 5.42 13.71 7.63 5.42-43.79 19.17
12-24 37.69 17.16 26.14 2.43 18.35 6.47 2.43-37.69 18.04
Soil Type 0-12 SS SS SS NSNS NSS NSNS - -
12-24 SS NSS SS NSNS NSS NSNS - -
Pre- 2012
ECe dS/m 0-12 65.8 6.17 6.51 3.15 2.30 7.29 2.30-65.8 14.7
12-24 43.3 4.37 3.85 1.79 2.51 1.69 1.79-43.3 9.15
pHe 0-12 7.1 8.1 8.2 8.1 8.1 8.0 7.1-8.1 7.93
12-24 7.3 8.0 8.2 8.1 8.0 8.1 7.3-8.1 7.97
SAR 0-12 48.49 20.35 15.23 11.74 7.48 22.3 7.48-48.49 20.08
12-24 38.76 15.75 18.76 7.50 7.17 5.76 5.76-38.76 16.12
Soil Type 0-12 SS SS SS NSNS NSNS SS - -
12-24 SS SS NSS NSNS NSNS NSS - -
Pre- 2013
ECe dS/m 0-12 53.5 2.39 5.10 2.37 3.14 2.78 2.78-53.5 11.55
12-24 51.3 1.80 3.72 1.63 1.88 0.93 0.93-51.3 10.21
pHe 0-12 7.4 8.1 8.0 7.8 7.8 7.6 7.4-8.1 7.78
12-24 7.2 8.2 8.1 7.9 7.9 7.7 7.2-8.2 7.83
SAR 0-12 50.51 8.99 19.03 10.01 9.53 4.90 4.90-50.51 17.16
12-24 49.37 8.15 18.94 5.90 8.64 3.12 3.12-49.37 15.69
Soil Type 0-12 SS NSNS SS NSNS NSNS NSNS - -
12-24 SS NSNS NSS NSNS NSNS NSNS - -
Post- 2013
ECe dS/m 0-12 16.29 4.74 1.80 2.75 2.43 7.72 1.80-16.29 5.95
12-24 8.88 2.90 2.28 1.09 2.46 5.46 1.09-8.88 3.84
pHe 0-12 7.3 7.9 8.0 8.1 8.0 7.5 7.3-8.1 7.8
12-24 7.5 7.9 8.1 8.2 8.1 7.6 7.5-8.2 7.9
SAR 0-12 31.16 13.0 11.84 12.01 13.06 22.7 11.84-31.16 17.30
12-24 21.06 13.20 13.79 8.57 10.0 17.4 8.57-21.06 14.00
Soil Type 0-12 SS SNS NSNS NSNS NSNS SS - -
12-24 SS NSNS NSNS NSNS NSNS SS - -
Non Saline Non Sodic (EC < 4 dS∙m−1 , SAR < 14%), Saline Non Sodic (EC ≥ 4 dS∙m−1 , SAR < 14),
References
Abrol, I. P. (1986). A study of the effect of added nutrients on plant growth on a sodic substrate. In: Trans. 9th Int. Congr. Soil Sci., 2, 585- 595.
Acosta, A., Faz, A., Jansen, B., Kalbitz, K., Martinez, S. (2011). Assessment of salinity status in intensively cultivated soils under semi arid climate, Murcia, SE Spain. Arid Environment, 75, 1056–1066.
Aslam, M., Khan, M. I. A., Saleem, M., Ali, Z. (2006). Assessment of water stress tolerance in different maize accessions at germination and early growth stage. Pakistan Journal of Botany, 38, 1571-1579.
District Disaster Management Authority (DDMA) (2008). Disaster Risk Management Plan, District Thatta Government of Sindh, 60p.
Duchaufour, P. (1982). Pedology. George Allen and Unwin, 448p.
European Soil Portal (2012). European Soil Portal – Soil Data and Information Systems. Visualized in 26 April
2013http://eusoils.jrc.ec.europa.Eu/library/themes/ salinization
Fujimaki, H., Shimano, T., Inoue, M., Nakane, K. (2006). Effect of a salt crust on evaporation from a bare saline soil. Vadose Zone, 5, 1246–1256.
Garg, V.K., (1998). Interaction of tree crops with a sodic soil environment: potential for rehabilitation of degraded environments. Land Degrad. Dev., 9, 81–93.
Haque, S. A. J. (2006). Salinity problems and crop production in coastal regions of Bangladesh. Pakistan J. Bot., 38, 1359-1365.
IPCC (2007b). Climate Change: Impacts, Adaptation and Vulnerability. Contribution of Working Group II to the Fourth Assessment Report of the Intergovernmental Panel on Climate Change In: M.L. Parry, O.F. Canziani, J. P. Palutikof, P. J. van der Linden and C. E. Hanson, (eds.), Cambridge University Press, Cambridge, UK, 976p.
IUCN, (2003). Case studies in wetland valuation No-5: Indus delta, Pakistan: Economic costs of reduction in freshwater flows, 6p.
Khan, M. Z., Akbar, G. (2012). In the Indus Delta, it is No More the Mighty Indus. In: River Conservation and Management. In: Philip J. Boon and Paul J. Raven (eds.), John Wiley & Sons. Ltd, Singapore.
Landscape, Soil and Water Salinity-LSWS (1987). Journal of Irrigation and Drainage Division, Proceedings of Workshop of American Society of
Civil Engineers, 103, 115–130.
Marcar, N. E., Crawford, D. F., Leppert, P. M., Jovanovic, T., Floyed, R. Farrow, R. (1995). Trees for salt land: a guide to selecting native species for Australia. CSIRO, Australia, 72p.
McLeod, M. K., Slavich, P.G., Irhas, Y., Moore, Rachman, A., Ali, N., Iskandar, T., Hunt, C., Caniago, C. (2010). Soil salinity in Aceh after the December 2004 Indian Ocean tsunami. Agriculture Water Management, 97, 605-613.
Naidu, R., Rengasamy, P. (1993). Ion interactions and constraints to plant nutrition in Australian sodic soils. AustralianJournal of Soil Research, 31, 801-819.
Pearson, K. E., Nikos, J. W., Pearson, K. E., Bauder, J. W. (2003). The basic of salinity and sodicity effects on soil physical properties. Land Resources and Environ-mental Sciences Department, Mont-ana State University.
Pisinaras, V., Tsihrintzis, VA., Petalas, C.,Ouzounis, K. (2009). Soil salinization in the agricultural lands of Rhodope District, northeastern Greece. Environ Monit Assess., 166, 79–94.
Qadir, M., Schubert, S. (2002). Degradation processes and nutrient constraints in sodic soils. Land Degrad. Develop., 13, 275-294.
Rasel, H. M., Hasan, M. R., Ahmed, B., Miah, M. S. U. (2013). Investigation of soil and water salinity, its effect on crop production and adaptation strategy. Int. J. of Water Resources and Env. Engineering, 5, 475-481.
Ravindran, K., Venkatesan, K., Balakrishnan, V., Chellappan, K., Balasubramanian, T. (2007). Restoration of saline land by halophytes for Indian soils. Soil Biology and Biochemistry, 39, 2661– 2664.
Reconnaissance Soil Survey (RSS) of Thatta West (1979). Govt. of Pakistan Ministry of Food and Agriculture. Soil Survey of Pakistan, 197p.
Sadras V. O., Milroy, S. P. (1996). Soil water thresholds for the responses of leaf expansion and gas exchange: A review. Field Crops Res., 47, 253- 266.
Shaw R. H. (1988). Climate requirement. In: Sprague, G. F. and J. W. Dudley (eds). Corn Improvement (3rd ed.). Agronomy Series, 18, 609- 633.
Hydrol, 178, 109–136.
Shrivastava, P., Rajesh, K. (2015). Soil salinity: A serious environmental issue and plant growth promoting bacteria as one of the tools for its alleviation. Saudi J Biol Sci., 22, 123–131.
Sumner, M. E. (1993). Sodic Soils: New perspectives, AUST. J. Soil Res., 31, 683-750.
Tweed, S., Leblanc, M., Cartwright, I., Favreau, G., Leduc, C. (2011). Arid zone groundwater recharge and salinization processes: an example from the lake eure basin. Australia. J. Hydol., 408, 257-275.
USDA (1954). Diagnosis and improvement of saline and slkali soil. US Government Printing Office, Washington DC, 159 p.
WAPDA, (2001). Monitoring and Evaluation, FDP Publication No. SM-285, Final Report, M & E Directorate, SMO, Lahore, 201 p.
Wu, Y., Liu, R., Zhao, Y., Li, P., Liu, C. (2009). Spatial and seasonal variation of salt ions under the influence of halophytes, in a coastal flat in eastern China. Environmental Geology, 57, 1501–1508.