i
CENTRO DE CIÊNCIAS DA SAÚDE
PROGRAMA DE PÓS-GRADUAÇÃO EM CIÊNCIAS DA SAÚDE
PREVALÊNCIA E FATORES ASSOCIADOS À SÍNDROME DA FRAGILIDADE EM IDOSOS: INQUÉRITO POPULACIONAL EM CAMPINA GRANDE-PB
ANNA FERLA MONTEIRO SILVA PASSOS
ANNA FERLA MONTEIRO SILVA PASSOS
PREVALÊNCIA E FATORES ASSOCIADOS À SÍNDROME DA FRAGILIDADE EM IDOSOS: INQUÉRITO POPULACIONAL EM CAMPINA GRANDE-PB
Tese apresentada ao programa de Pós-Graduação em Ciências da Saúde da Universidade Federal do Rio Grande do Norte como requisito para a obtenção do título de Doutor em Ciências da Saúde.
Orientadora: Prof.ª Dra. Iris do Céu Clara Costa
MINISTÉRIO DA EDUCAÇÃO
UNIVERSIDADE FEDERAL DO RIO GRANDE DO NORTE CENTRO DE CIÊNCIAS DA SAÚDE
PROGRAMA DE PÓS-GRADUAÇÃO EM CIÊNCIAS DA SAÚDE
Coordenador do Programa de Pós-Graduação em Ciências da Saúde:
ANNA FERLA MONTEIRO SILVA PASSOS
PREVALÊNCIA E FATORES ASSOCIADOS À SÍNDROME DA FRAGILIDADE EM IDOSOS: INQUÉRITO POPULACIONAL EM CAMPINA GRANDE-PB
Aprovação em __/___/____
Banca Examinadora
Presidente da Banca: Prof.ª Dra. Iris do Céu Clara Costa
Membros da Banca:
Prof.a Dra. Walda Viana Brígido de Moura - UFC Membro externo a Instituição
Prof.a Dra. Ana Alayde Werba Saldanha Pichelli - UFPB Membro externo a Instituição
Prof.o Dr. Dyego Leandro Bezerra de Souza - UFRN Membro interno ao Programa
Prof.a Dra. Tatyana Maria Silva de Souza Rosendo - UFRN Membro interno ao Programa
DEDICATÓRIA
À Arthur, fruto do amor mais puro e verdadeiro,
AGRADECIMENTOS
À Deus, que sempre se fez presente em todos os momentos, firmes e trêmulos desta caminhada. Porque me ensinou a escalar as montanhas quando percebi que não podia transformá-las. Porque iluminou meu caminho através do conhecimento, afastando dos meus olhos a escuridão da falta de informação. E desde os primeiros passos, me ensinou a subir cada degrau da escada da vida e mais, me conscientizou que ela não acabou e que poderei subir mais. Porque quando as impossibilidades me assustam, Ele fala ao meu coração: EU SOU O DEUS DO IMPOSSÍVEL, NÃO TEMAIS.
À minha orientadora Profa. Dra. Iris do Céu Clara Costa, pelo incentivo e pelo exemplo de competência e perseverança não apenas no campo científico como frente às adversidades da vida. Obrigada por oportunizar e lapidar o meu crescimento profissional.
À querida Profa. Dra. Maria do Carmo Eulálio, por sua delicadeza e sua disposição em ajudar, por sua competência teórica e seus ricos ensinamentos durante o mestrado e o doutorado.
À Arthur, meu filho amado, que com, seus cinco anos cheios de vida e de graça, ensina-me a ser mãe e constitui-se no maior responsável pelo meu aprendizado sobre a infância e na nutriz do meu sonho de um mundo melhor para todas as pessoas. Filho, perdão pelos momentos de ausência exigidos para minha formação no doutorado. Agora a tese chegou ao fim. Prometo ser muito mais sua.
Aos amigos e irmãos Aderson, Marcella, Tereza Helena, Múcio, Vanildo Filho, George e Iamara, por me incentivarem a seguir a trilha do conhecimento e por festejarem comigo o ingresso no doutorado.
Às minhas amigas do doutorado e companheiras de viagens: Cláudia Martiniano, Ardigleusa e Adrianna Ribeiro, pelas ricas trocas de experiências durante o percurso de todas as nossas viagens. Amigas sinceras, prestativas e de todas as horas!
Aos professores do Programa de Pós-Graduação em Ciências da Saúde da UFRN, por partilharem seus conhecimentos. A todos os funcionários do programa que, com seus trabalhos cotidianos, tornaram possível a produção do presente trabalho.
Aos professores da banca de qualificação e de defesa, agradeço as suas preciosas considerações ao presente trabalho e generosas sugestões de aprimoramento.
RESUMO
A Síndrome da Fragilidade é um estado clínico geriátrico de vulnerabilidade que resulta no declínio das reservas fisiológicas, caracterizada por consequências de alto risco como: quedas, incapacidade funcional, hospitalização, institucionalização e morte. Embora a presença de comorbidades associadas não seja sempre acompanhada da fragilidade, essa presença poderia também indicar um aumento do risco de eventos adversos à saúde, levando o idoso a uma maior probabilidade de tornar-se frágil, devido às limitações físicas que podem ocorrer com o surgimento das doenças, as quais são fortemente preditoras da Síndrome da Fragilidade. Esse estudo teve como objetivo geral avaliar a prevalência da Síndrome da Fragilidade em idosos e os fatores associados. Os objetivos específicos foram: identificar a prevalência da Síndrome da Fragilidade em idosos e suas associações com variáveis demográficas, econômicas, de saúde, funcionais e psicológicas; identificar as razões de prevalência da Síndrome da Fragilidade com o perfil demográfico, problemas de saúde, uso de drogas lícitas e problemas com o sono dos idosos. O estudo foi transversal e composto por 385 idosos com 65 anos ou mais. Foram utilizados modelos de regressão de Poisson multivariada, para verificar condições associadas à fragilidade e determinar a razão de prevalência (α = 0,05). A prevalência de fragilidade foi de 8,7% e pré-fragilidade de 50,4%. Os idosos frágeis e pré-frágeis apresentaram, maiores e crescentes razão de prevalência para estado civil, dificuldade para realizar as atividades instrumentais da vida diária, idade avançada, perda involuntária de fezes, depressão e afetos negativos. Os idosos que não trabalham tem maior prevalência de fragilidade, assim como aqueles que relataram já ter tido derrame/acidente vascular cerebral/isquemia, os que sofreram quedas nos últimos 12 meses e aqueles que apresentaram problemas de sono. Considera-se que os resultados, juntamente a outros disponibilizados na literatura, possam contribuir para o entendimento da epidemiologia da fragilidade e também na implementação de programas específicos que visem reduzir a prevalência da fragilidade, otimizando a qualidade de vida. Sugere-se que futuros programas tenham especial atenção aos perfis de idosos que ainda não tenham desenvolvidos fragilidade, ou seja, os pré-frágeis. Isso poderia evitar que os idosos se tornassem frágeis.
ABSTRACT
The frailty syndrome is a geriatric medical condition of vulnerability resulting in the decline of physiological reserves, characterized by high-risk consequences as falls, disability, hospitalization, institutionalization and death. Although the presence of comorbidities is not always accompanied by fragility, this presence could also indicate an increased risk of adverse health events, taking the elderly to a greater likelihood of becoming brittle due to the physical limitations that may occur with emergence of diseases, which are strongly predictive of Fragility Syndrome. This study aimed to assess the prevalence of frailty syndrome in the elderly and associated factors. The specific objectives were to identify the prevalence of frailty syndrome in the elderly and their associations with demographic, economic, health, functional and psychological; identify the reasons for the prevalence of frailty syndrome with the demographic profile, health problems, use of legal drugs and problems with sleep of older people. The study was cross-sectional and composed of 385 elderly aged 65 or more. Multivariate Poisson regression models were used to check conditions associated with fragility and determine the prevalence ratio (α = 0.05). The prevalence of fragility was 8.7% and pre-fragility of 50.4%. Fragile and pre-frail elderly presented, bigger and increasing prevalence ratio for marital status, difficulty in performing instrumental activities of daily living, old age, involuntary loss of stool, depression and negative affect. Elderly people who do not work have a higher prevalence of fragility, as well as those who reported having had a stroke / stroke / ischemia, those who suffered falls in the last 12 months and those with sleep problems. It is considered that the results, together with other available in the literature, can contribute to the understanding of the fragility epidemiology and also in the implementation of specific programs aimed at reducing the prevalence of frailty, optimizing the quality of life. It is suggested that future programs have special attention to the profiles of elderly people who have not yet developed fragility, i.e., pre-fragile. This could prevent the elderly from becoming frail.
LISTA DE TABELAS
Tabela 1 – Artigo 1
Parameters of adjustment of the measurement of the affection and geriatric depression scales.
26
Tabela 2 – Artigo 1
Association of the phenotype of frailty with demographic variables.
26
Tabela 3 – Artigo 1
Association of the phenotype of frailty with health, functional and psychological variables.
27
Tabela 4 – Artigo 1
Multivariate model for the non frail/pre-frail outcomes. 28
Tabela 5 – Artigo 1
Multivariate model for the non frail/frail outcomes. 28
Quadro 1 – Artigo 2
Description of independent variables of the study. 55
Tabela 1 – Artigo 2
Association of demographic variables between the profile of frail elderly.
56
Tabela 2 – Artigo 2
Association of health problems with the profile of frail elderly.
57
Tabela 3 – Artigo 2
Association of tobacco use, alcohol and problems with sleep between the frail elderly profile.
58
Tabela 4 – Artigo 2
Models of the reasons for adjusted prevalence (RP) among the factors associated with the phenotype of frailty among the elderly.
LISTA DE ABREVIATURAS E SIGLAS
OMS Organização Mundial de Saúde SF Síndrome da Fragilidade
TCLE Termo de Consentimento Livre e Esclarecido MEEM Mini Exame do Estado Mental
ABVD Atividades Básicas de Vida Diária AIVD Atividades Instrumentais de Vida Diária AAVD Atividades Avançadas de Vida Diária GDS Escala de Depressão Geriátrica AVC Acidente Vascular Cerebral IMC Índice de Massa Corporal
SPSS Statistical Package for the Social Sciences
² Qui-quadrado de Pearson
RP Razão de Prevalência
PPGCSA Programa de Pós-Graduação em Ciências da Saúde
SUMÁRIO
Dedicatória v
Agradecimentos vi
Resumo viii
Abstract Ix
Lista de Tabelas X
Lista de Siglas e Abreviaturas Xi
1 INTRODUÇÃO 13
2 JUSTIFICATIVA 16
3 OBJETIVOS 17
4 MÉTODOS 18
5 ARTIGOS PRODUZIDOS 24
5.1 Artigo 1 - Prevalence of Frailty Syndrome in the elderly and associated factors in Brazil.
24
5.2 Artigo 2 - Prevalence and factors associated with Frailty Syndrome in the elderly: A population survey in a Brazilian city.
35
6 COMENTÁRIOS, CRÍTICAS E SUGESTÕES 60
7 REFERÊNCIAS 62
8 APÊNDICES 67
1 INTRODUÇÃO
Estudos demográficos e epidemiológicos têm comprovado o crescente aumento da população idosa em todo o mundo, colocando órgãos governamentais e a sociedade diante de desafios médicos e socioeconômicos próprios do envelhecimento populacional.1
O Brasil apresenta desde a década de 1940 um aumento no número de idosos, porém esse processo se intensificou, principalmente, na década de 1960. Dados da Organização Mundial de Saúde (OMS) indicam que em 2025 o Brasil será o sexto país em número de idosos no mundo, alcançando cerca de 32 milhões de indivíduos. Isso acarretará num aumento de gastos, principalmente com a seguridade social e com a saúde.2,3
Grande parte da população envelhecida expõe um quadro de maior vulnerabilidade às condições de saúde que os tornam vulneráveis a um grande número de eventos adversos. Este quadro é caracterizado como Síndrome da Fragilidade (SF) e tem ganhado cada vez mais interesse dos pesquisadores, principalmente porque pode oferecer medidas de alerta para o controle do aumento da gravidade de diversos problemas de saúde.
Muitos autores têm definido a SF, no entanto, possivelmente o conceito mais utilizado no mundo seja o de Fried4 et al, que a define como uma síndrome de caráter multissistêmico e que reduz a capacidade do organismo de responder adequadamente a eventos estressantes. São cinco os indicadores da fragilidade: perda involuntária de peso, redução do nível de atividade física, redução da força de preensão palmar, sensação de fadiga e redução da velocidade da marcha. Aqueles que possuírem três ou mais desses sintomas são classificados como frágeis e aqueles que possuem entre um e três, como pré-frágeis.
doenças crônicas e agudas, hospitalização, lenta ou ausente recuperação de um quadro clínico e morte.5-8
Os indivíduos frágeis respondem menos à intervenção terapêutica. O sistema imunológico é menos ativo, e possui menos independência funcional e qualidade de vida. Essas características aumentam as chances para desfechos como mortalidade elevada, quedas e fraturas, aumento na taxa de hospitalização e de reinternação hospitalar e incapacidade.9-11
O envelhecimento é uma aspiração natural de qualquer sociedade, porém, o envelhecimento por si só não é o bastante. É importante se almejar uma melhoria da qualidade de vida daqueles que já envelheceram ou estão no processo de envelhecimento.12
Viver mais é importante desde que se consiga agregar qualidade aos anos adicionais de vida. Dessa maneira, surgem desafios para a Saúde Pública, os quais são reconhecidos pela OMS, como manter a independência e a vida ativa com o envelhecimento; fortalecer políticas de prevenção e promoção da saúde, especialmente aquelas voltadas para os idosos, bem como manter e/ou melhorar a qualidade de vida durante o processo de envelhecimento.13
Rebok e Gallo14 afirmam ser um erro considerar o envelhecimento bem-sucedido somente em termos da capacidade de levar adiante as atividades de vida diária. Segundo eles, o envelhecimento bem-sucedido está muito mais relacionado com a oportunidade de realizar as tarefas desenvolvidas da idade avançada.
A presença de comorbidades associadas a perdas relacionadas com o envelhecimento não deve ser entendido como envelhecimento mal-sucedido. Para que se promova um envelhecimento saudável se faz necessário o envolvimento de ações de políticas públicas como forma de evitar o surgimento de doenças e consequentemente perda da qualidade de vida, promovendo assim, modos de viver mais salutares em todas as etapas da vida. Através dessas medidas obtêm-se uma base para o envelhecimento saudável com ganho substancial em qualidade de vida e saúde.15,16
saudável e a qualidade de vida para todas as pessoas que estão envelhecendo, inclusive as que são frágeis, fisicamente incapacitadas e que requerem cuidados.17
Com o aumento da população idosa, os estudos na área da saúde intensificaram, em especial, aqueles relacionados à fragilidade, de forma que a identificação dos instrumentos usados para caracterizar o estado frágil possibilitará indicar marcadores clínicos relevantes.8 Assim, a identificação precoce das características associadas a SF pode desencadear medidas que visem melhorar a qualidade de vida de idosos e prevenir eventos adversos.
É necessário que profissionais de saúde possam, em sua prática clínica, quer seja no contexto ambulatorial ou em programas de saúde, identificar tais sintomas, com o intuito de intervir antes da manifestação da fragilidade, bem como pensar em estratégias que possam minimizar os efeitos sobre a saúde do idoso, quando a fragilidade se faz presente.18
No Brasil, os estudos que buscam identificar a prevalência e quais as características que se associam a Fragilidade ainda são recentes. Em 2009, a rede FIBRA, acrônimo de Fragilidade de Idosos Brasileiros, realizou um estudo populacional em sete cidades brasileiras de quatro regiões geopolíticas do Brasil selecionadas por critério de conveniência: Campinas (SP), Belém (PA), Parnaíba (PI), Campina Grande (PB), Poços de Caldas (MG), Ivoti (RS) e o distrito de Ermelino Matarazzo (SP).
Na região Nordeste, especificamente, são poucos os estudos que trazem dados sobre a prevalência da SF. Eles poderiam orientar as políticas públicas de saúde para identificar precocemente perfis da população com maior vulnerabilidade as doenças.
2 JUSTIFICATIVA
O envelhecimento provoca alterações e desgastes em vários sistemas funcionais, que ocorrem de forma progressiva e irreversível. O momento em que estas transformações ocorrem, quando passam a ser percebidas e como evoluem, diferencia-se de um indivíduo para outro. Entretanto, em idades mais avançadas as limitações visuais, auditivas, motoras e intelectuais, bem como o surgimento de doenças crônico-degenerativas intensificam-se, ocasionando dependências nas atividades cotidianas.19
De acordo com a American Medical Association, estima-se que 10 a 25% das pessoas com mais de 65 anos sejam frágeis, e esta prevalência aumenta proporcionalmente com a idade, chegando a mais de 40% naqueles com mais de 80 anos. Nesse contexto, uma parcela substancial da população idosa é portadora de condições de saúde que as tornam vulneráveis a um grande número de eventos adversos à saúde, tais como: agravamento de doenças, comorbidades, quedas, institucionalização, incapacidade e morte. Estes indivíduos estão prestes a transpor, a barreira da preservação cognitiva e funcional, desenvolvendo quadros variados de dependência, sendo classificados como portadores da SF, que leva a deterioração da qualidade de vida, aumento da sobrecarga dos cuidadores e altos custos com cuidados à saúde do idoso.20-23
3 OBJETIVOS
3.1 Objetivo geral:
-Avaliar a prevalência da Síndrome da Fragilidade em idosos e os fatores associados em Campina Grande-PB.
3.2 Objetivos específicos:
-Identificar a prevalência da Síndrome da Fragilidade em idosos e suas associações com variáveis demográficas, de saúde, funcionais e psicológicas.
4 MÉTODOS
Nesta investigação foi realizado um estudo transversal, extraído da Rede FIBRA, acrônimo de “Fragilidade em Idosos Brasileiros”, em 2009, que designa uma rede multicêntrica de pesquisa dedicada a identificar condições de fragilidade em idosos urbanos comunitários, com 65 anos e mais, composta por 7 mil idosos residentes em 17 cidades de cinco regiões brasileiras, para determinar a relação dos indicadores de fragilidade com variáveis demográficas e socioeconômicas e com aspectos relacionados à saúde física e cognição, o desempenho de atividades de vida diária e a expectativa de cuidado, sintomas depressivos e satisfação com a vida.
Essa rede organizou-se em quatro polos, cada um dos quais nucleou os trabalhos de um grupo de instituições parceiras - do polo Unicamp participaram grupos de pesquisa de universidades sediadas em sete localidades, entre elas, Campina Grande, um município brasileiro do estado da Paraíba. Considerado um dos principais polos industriais da Região Nordeste bem como um dos maiores polos tecnológicos da América Latina. De acordo com estimativas de 2014, sua população é de 402 912 habitantes, sendo a segunda cidade mais populosa da Paraíba, contando com 5,39% da sua população composta por idosos.
4.1 Plano amostral
A amostra foi probabilística por conglomerados, tendo como unidade de amostragem os setores censitários urbanos selecionados aleatoriamente. O número de setores censitários sorteados correspondeu à razão entre o número de idosos pretendidos e o número de setores censitários urbanos existentes. Foi estimado o tamanho amostral necessário para se ter uma proporção de 50% de ocorrência de uma determinada característica da população idosa (valor em que o tamanho amostral obtido é o máximo possível para p=0.50 e q=0.50). A fórmula utilizada foi: n= {z2 [p q / (d)2]}.24 O cálculo indicou uma população de 385 idosos.
mapa de cada setor censitário a ser visitado, no caso, 60 setores censitários em Campina Grande/PB.
4.2 Procedimentos de coleta de dados
A coleta de dados foi realizada em local combinado durante o recrutamento, com duração de 40 a 80 minutos. A equipe que atuou na coleta de dados compreendeu estudantes de graduação. Todos receberam treinamento sobre os procedimentos padronizados. Antes de iniciar a entrevista, os idosos foram informados sobre os objetivos da pesquisa, o caráter voluntário de sua participação, o direito de abandonar a pesquisa a qualquer momento, o sigilo dos dados individuais e a ausência de riscos à saúde física e mental. Posteriormente foram convidados a assinar um Termo de Consentimento Livre e Esclarecido (TCLE).
Por meio de um questionário estruturado (Apêndice 1), foram coletados dados demográficos, problemas de saúde autorrelatados, variáveis de funcionalidade e mal estar psicológico. Para as medidas psicológicas foi utilizado um teste de rastreamento cognitivo – Mini Exame do Estado Mental (MEEM),25 com a finalidade de identificar idosos que apresentassem déficits cognitivos, o que poderia prejudicar a confiabilidade das respostas.
4.3 Técnicas e instrumentos de mensuração das variáveis
Para associar ao fenótipo de fragilidade foram considerados no primeiro artigo quatro grupos de variáveis. O primeiro de características demográficas e socioeconômicas, com as seguintes variáveis: sexo, idade, alfabetizado, trabalha atualmente. O segundo foi composto de problemas de saúde autorrelatados, sendo perguntado se um médico já o havia diagnosticado como tendo Hipertensão e/ou Diabetes Mellitus, ou se acontece de ter perda involuntária de urina ou de fezes frequentemente. O terceiro grupo foi com variáveis de funcionalidade, avaliando as Atividades Básicas de Vida Diária (ABVD),28,29 Atividades Instrumentais de Vida Diária (AIVD)30 e Atividades Avançadas de Vida Diária (AAVD).31 Por fim, um último grupo de variáveis de mal estar psicológico composto pela escala de Depressão Geriátrica32 e uma medida de Afetos.33 Esses instrumentos estão descritos a seguir.
O desempenho nas ABVD foi avaliado utilizando-se a Escala de Independência em Atividades de Vida Diária desenvolvido por Sidney Katz,28,29 que consta de uma lista de 6 itens hierarquicamente relacionados, em que se perguntava aos idosos se eles eram totalmente independentes, se necessitavam de ajuda ou se precisavam de ajuda total para fazer atividades ligadas a sobrevivência. Para as AIVD foi usado a Escala de Atividades Instrumentais de Vida Diária criada por Lawton e Brody, relativas à manutenção de uma vida independente nos contextos domésticos e de vizinhança, contendo 7 atividades onde o idoso foi avaliado de acordo com o seu desempenho e/ou participação.30 Já na avaliação das AAVD foi utilizado um inventário feito com base na literatura sobre Atividades Avançadas da Vida Diária, que continha 12 questões de autorrelato sobre a participação dos idosos em papéis sociais e com a vida social mais ampla.31
A Escala de Depressão Geriátrica (GDS) é um instrumento recomendado pela Organização Mundial de Saúde/CID-10 que faz um levantamento de transtorno depressivo. Sua forma reduzida34 é composta por 15 itens que averiguam o humor e o sentimento do sujeito nas ultimas 2 semanas. Escore acima de 5 pontos sugere provável depressão.32
Para o segundo artigo foram considerados quatro grupos de variáveis autorrelatadas. Sendo o primeiro de perfil demográfico: Sexo (Masculino ou Feminino); Trabalha atualmente (Sim ou Não); Se o idoso (a) tinha algum tipo de trabalho, que estabeleceria rotina de horários e responsabilidades; Alfabetizado (Sim ou Não); Se conseguiria escrever e ler uma frase; Renda familiar em salários mínimos; Faixa etária em anos. O segundo de problemas de saúde: Doenças autorrelatadas: Já teve derrame, AVC (Acidente Vascular Cerebral), isquemia (Sim ou Não); Já teve tumor, câncer (Sim ou Não); Já teve artrite, reumatismo (Sim ou Não); Para estas questões o idoso respondia sim ou não para a presença ou ausência do problema: Perda de apetite; Sofreu alguma fratura; Esteve acamado no seu lar por motivo de doença no último ano; percebeu mais dificuldades de memória (se as dificuldades de memória tem aumentado se comparado aos últimos anos); Ouve bem (problemas com a audição no último ano); Enxerga bem (problema com a visão no último ano); Precisou ser internado em hospital por pelo menos 1 noite no último ano.
No terceiro grupo de variáveis observou-se o uso de drogas lícitas: Fumou e largou (Sim ou Não), tempo do uso que largou não foi considerado; Frequência com que consome bebidas (nunca consome; consome mensalmente, consome semanalmente); E o quarto, problemas com o sono: Para estas questões o idoso respondia sim ou não para a presença ou ausência de dificuldade com o sono: Problemas de sono (se o idoso relatava algum problema não especificado com o sono); Tomou remédios para dormir; Acorda de madrugada e não pega mais no sono; Fica acordado a maior parte da noite; Leva muito tempo para pegar no sono; Dorme mal à noite.
.
4.4 Técnicas para mensurar o fenótipo de fragilidade
preensão medida com dinamômetro hidráulico portátil na mão dominante, ajustada por sexo e por Índice de Massa Corporal (IMC);37 4) baixo nível de dispêndio de energia medido em quilocalorias e ajustado ao sexo, avaliado a partir de autorrelato de exercícios físicos e trabalhos domésticos desempenhados nos últimos sete dias;38,39 5) baixa velocidade da marcha indicada pelo tempo médio gasto para percorrer três vezes a distância de 4,6 m, com ajustes segundo sexo e altura.40,41 Para os três últimos critérios, pontuam para fragilidade os indivíduos que obtém resultados localizados entre os 20% mais baixos da amostra.
4.5 Análise dos dados
Os dados foram analisados no Statistical Package for the Social Sciences (SPSS) versão 21. Inicialmente, foram realizados testes de associações bivariadas de Qui-quadrado de Pearson (²), teste exato de Fisher e Correção de Yates entre as variáveis independentes e a divisão do fenótipo de fragilidade em perfis dicotomizados (i.e. modelo Não-frágil/Pré-frágil; modelo Não-frágil/Frágil e modelo Pré-fragil/Frágil) para facilitar as comparações e a decisão de quais variáveis iriam para o teste dos modelos de regressão. As associações que exibiram probabilidade menor ou igual a 5% (p ≤ 0,05) de não excluir a hipótese nula, foram tidos em conta em um modelo multivariado, que foi desenvolvido por meio de três regressões bivariadas de Poisson, uma tendo com variável dependente Não-frágil/Pré-fragil (1º modelo), outra como Não-frágil/Frágil (2º modelo) e a terceira Pré-frágil/Frágil (3º modelo). Para a permanência das variáveis no modelo multivariado, adotou-se o método Backward. Nas regressões foi utilizado o estimador robusto na matriz de covariância para obter erros padrões mais robustos. A magnitude dos efeitos dos testes foi interpretado como razão de prevalência (RP), com intervalos de confiança de 95%. Permaneceram no modelo multivariado as variáveis com significância menor ou igual a 0,05 (α = 0,05).
4.6 Aspectos Éticos
normas aplicadas a pesquisas que envolvem, diretamente ou indiretamente, seres humanos.
5 ARTIGOS PRODUZIDOS
5. 1 Artigo 1
5.2 Artigo 2
PREVALENCE AND FACTORS ASSOCIATED WITH FRAILTY SYNDROME IN
THE ELDERLY: A POPULATION SURVEY IN A BRAZILIAN CITY
Anna Ferla Monteiro Silva Passos, MSc,1,2Iris do Céu Clara Costa, PhD,1 Maria do Carmo
Eulálio, PhD,3Fábia Barbosa de Andrade, PhD,4 Adrianna Ribeiro Lacerda, MSc,5 Rômulo
Lustosa Pimenteira Melo, MSc,3 and Anita Liberalesso Neri, PhD6
1
Universidade Federal do Rio Grande do Norte, Natal, Brasil; 2Universidade Federal da
Paraíba, João Pessoa, Brasil; 3Universidade Estadual da Paraíba, Campina Grande, Brasil;
4
Universidade Federal do Rio Grande do Norte, Santa Cruz, Brasil; 5Faculdade de Ciências
Médicas de Campina Grande, Campina Grande, Brasil. 6Universidade Estadual de Campinas,
Campinas, Brasil.
Each author's contribution to the paper: 1-6They contributed substantially to the conception
and the design of scientific research, the acquisition, interpretation and data analysis;
1,2
Participated in the drafting and critical review of the work, with real intellectual
contribution to its contents; 1-6Final approval of content to be published.
Corresponding Author: Anna Ferla Monteiro Silva Passos, R. Tertuliano de Brito, 383, Jardim
13 de Maio, CEP: 58025-000, João Pessoa, Paraíba, Brasil. Phone: 5583988632322, Email
address: annaferla@ig.com.br. Alternate Corresponding Author: Email address:
iris_odontoufrn@yahoo.com.br
Financial support from the National Research Council - CNPq, the Coordination
Development of Higher Education Personnel - CDHEP, the Foundation for Research Support
of the State of São Paulo - FRSSSP and the Foundation for Research Support of the State of
Rio Grande do Sul – FRSSRGS.
ABSTRACT
AIM: This study aimed to identify the reasons for the prevalence of frailty syndrome in the
demographic profile, health problems, use of legal drugs and problems with sleep among
elderly people in a city in the Northeast of Brazil.
METHODS: The study was cross-sectional and composed of 385 elderly aged 65 or over,
with an age average of 73.92 years. Three multivariate Poisson regression models were used
to check conditions associated with frailty and determine the prevalence ratio (α = 0.05).
RESULTS: The prevalence of frailty was 8.7% and pre-frailty of 50.4%. It was found that
compared to non-frail the elderly people who do not work have a higher prevalence of frailty,
as well as those who reported having had a stroke/cerebralvascular accident/ischemia, those
who suffered falls in the last 12 months and those with sleep problems.
CONCLUSION: These results can guide the establishment of preventive measures and the
development of intervention strategies aimed at minimizing the adverse effects of frailty in
elderly people.
INTRODUCTION
Brazil has had since the 1940s an increasing number of elderly, but this process has
intensified, especially in the 1960s Data from the World Health Organization (WHO) that
indicate that in 2025 Brazil will be the sixth country in number of elderly in the world,
reaching about 32 million people. This will result in increased costs, mainly social security
and health.
Much of the aging population exposes a greater vulnerability to health conditions that
render them susceptible to a large number of adverse events. This framework is characterized
as Frailty Syndrome and has gained increasing interest from researchers, mainly because it
can provide warning measures to control the increasing severity of various health problems.
Many authors have defined Frailty Syndrome, however, perhaps the most widely used
concept in the world is that of Fried1 et al, which defines it as a multisystemic syndrome and
reduces the body's ability to respond appropriately to stressful events. There are five frailty
indicators: unintentional weight loss, reduced physical activity, reduced grip strength, sense of
fatigue and reduced gait velocity. Those having three or more of these symptoms are
classified as frail and those having between one and three, as pre-frail.
Less frail individuals respond to therapeutic intervention. The immune system is less
active and has less functional independence and quality of life. These characteristics increase
the chances for outcomes such as high mortality, falls and fractures, increased rate of
hospitalization and hospital readmission, incapacity.2-4
In Brazil, studies that seek to identify the prevalence and what characteristics are
associated with frailty are still fresh. In 2009, the network FIBRA, acronym of Frailty in
Elderly Brazilians, conducted a population-based study in many Brazilian cities in four
that bring data on the prevalence of Frailty Syndrome. They could guide public health policies
for the early identification of people with highest risk disease profiles. Thus, this work aimed
at identifying reasons for the prevalence of frailty syndrome with the demographic profile,
health problems, use of legal drugs and problems with sleep among the elderly in a town in
METHODS
This study was conducted by FIBRA Network, acronym of "frailty in elderly
Brazilians." The sample was a probabilistic conglomerate type, with the sampling unit being
urban census tracts that were randomly selected. The elderly were recruited at their homes.
Sample
The sample size required to have a proportion of 50% of the occurrence of a particular
characteristic of the elderly population has been estimated (value where the sample size is
obtained as much as possible to p=0.50 e q=0.50). The formula used was: n= {z2 [p
q/(d)2]}.5 The calculation indicated a population of 385 elderly.
Data collection procedures
The elderly were visited in their homes by pairs of undergraduate students from the
health area. In each sector 20 elderly were selected and the data collection was carried out in a
place chosen based on the accessibility of the elderly. At the start of the data collection
session, followed by the signing of the Term of Consent.
The elderly that was included were those who could understand the instructions, were
aged 65 years or more, and agreed to participate and be a permanent resident in the
household. Eligible seniors who had cognitive impairment were not considered and also those
which were temporarily or permanently bedridden and people with disabling side effects. The
inclusion and exclusion criteria were the same used in the Cardiovascular Health Study and
Techniques and instruments for measurement of variables
They were divided into four groups of self-related variables. The first was a
demographical profile; the second of health problems; the third, use of legal drugs and the
fourth, problems with sleep. The following Table 1 shows the description of each variable
used.
To measure the frailty phenotype, we used the criteria of the Cardiovascular Health
Study and the Women's Health and Aging Studies3. There are five operational elements of the
definition of the syndrome or frailty phenotype:1,6 1) unintentional weight loss: ≥ 4.5 kg or
5% of body weight in the previous year; 2) fatigue assessed by self-report evoked by two
questions of a scale for screening depression7, considered fatigue manifestation of the
statement that in three or more days of the week the elderly felt they needed to make too
much effort to account for the tasks; 3) Low grip strength measured with a portable hydraulic
dynamometer in the dominant hand, adjusted by gender and body mass index (BMI)8; 4) low
level of energy expenditure measured in kilocalories and adjusted to sex, assessed from
self-reports of physical exercise and housework performed over the past seven days9; 5) low speed
of travel indicated by the average time to go three times the distance of 4.6 m with
adjustments by sex and height.10 For the last three criteria a score for frailty of individuals that
gets results located among the lowest 20% of the sample.
Data analysis
Data was analyzed using the Statistical Package for Social Sciences (SPSS) version
21. Initially, tests were carried out for bivariate associations of Chi-square test (x²), Fisher's
exact test and Yates correction between the independent variables and the division of the
frailty phenotype in dichotomized profiles (Non-frail model/Pre-frail, Non-frail model/Frail
test the models regression. Associations exhibited that were less likely than or equal to 5%
(p≤0.05) of not excluding the null hypothesis, were taken into account in a multivariate
model, which was developed through three bivariate Poisson regressions, having a variable
Non-dependent frail/pre-frail (1st model), another as a non-frail/frail (2nd model) and the
third pre-frail/frail (3rd model). For the permanence of the variables in the multivariate model,
the backward method was adopted. In the regressions we used the robust estimator in the
covariance matrix for errors in more robust standards. The magnitude of the effects of the
tests was interpreted as a prevalence ratio (PR) with 95% confidence intervals. They remained
RESULTS
Description and reasons for the prevalence of the frailty phenotype
The sample consisted of 395 elderly, and the prevalence of pre-frailty was 50.4%
[95% CI (45.63 – 55.36)] and frail elderly of 8.7% [95% CI (6.33 – 11.87)]. Figure 1 shows
the association of demographic variables with dichotomous models of the frailty phenotype.
It was found that sex was a statistically significant association (p≤0,05) with the model
(1-3), i.e. between the non-frail and frail phenotypes, in this association, the elderly women,
proportionately, are more frail than the elderly men. Also in this model, a statistically
significant association is found with the following demographic variables: currently work,
literacy, family income, age groups. In Figure 2, with health variables: stroke/cerebralvascular
accident/ischemia, arthritis/rheumatism, loss of appetite, falls suffered; and the use of
variables of legal drugs and sleep problems (Figure 3) with: sleep problems and take a long
time to fall asleep.
For the model that considers the non-frail and pre-frail dichotomy (1-2) demographic
variables those were associated statistically and significantly were: currently working, literate,
family income and age range (Figure 1). Between the health variables (Figure 2), the loss of
appetite, suffered falls, good hearing and had to be hospitalized for at least one (01) night
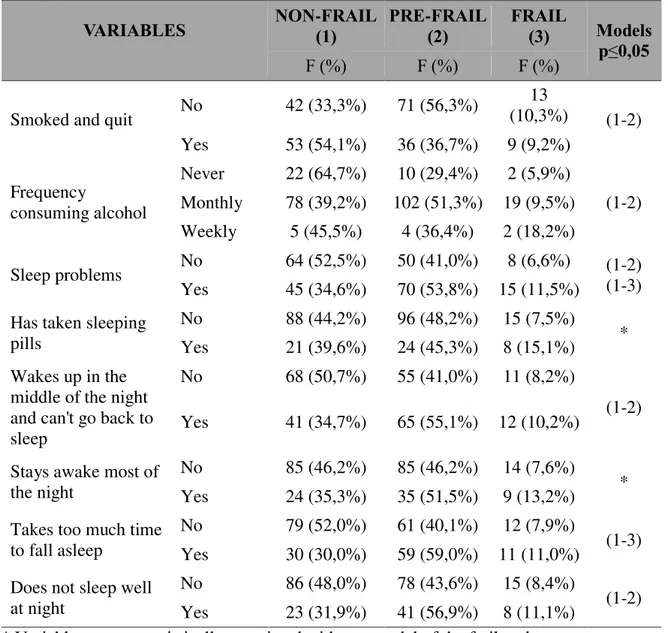
were statistically significant. Figure 3 shows that the variable smoked and quit, frequency
with which consumes alcohol, sleep problems, wake up early in the morning and does not get
enough sleep and sleeps badly at night showed statistically significant association with (1-2).
The last model (2-3) that considers the pre-frail and frail dichotomy, the variables that
were significantly associated were: Had a stroke/cerebralvascular accident/ischemia, had a
tumor/cancer and memory difficulties both in Figure 2.
Considering the variables that have a statistically significant association between each
the dyads. These regression models have been proposed to facilitate the understanding of the
variables that are involved in non-frail passages for pre-frail and frail. Figure 4 shows the
final three regression models and the bottom of the table, the variables out of the models do
not present statistical significance. For example, for the third regression model, which began
with the three variables that were significantly associated, had a stroke/cerebralvascular
accident/ischemia, had a tumor/cancer and memory difficulties (Figure 2), the variable
tumor/cancer came out in the first step by not presenting statistical significance, followed by
I've had a stroke/cerebralvascular accident/ischemia in the second step. This multivariate
technique allows only the variables with the greatest effect remain in the regression models.
The first regression (among non-frail and pre-frail) showed the largest number of
variables. When compared to non-frail elderly, those who were literate had significantly
higher prevalence of pre-frailty. Compared with the aged 65-69 years, with those who were
older also have more pre-frailty, especially those aged 75-79 years. Those who do not see
well, those who reported that they had to be hospitalized for at least one night last year, those
who consume alcohol monthly or weekly also had a higher prevalence of pre-frailty. Finally,
seniors who reported smoking, but quit, had lower prevalence of pre-frailty compared to those
who did not stop smoking (Figure 4).
For the 2nd regression model, it was found that if compared to non-frail elderly who
do not work have a higher prevalence of frailty, as well as those who reported
stroke/cerebralvascular accident/ischemia, who suffered decrease in the last 12 months, and
sleep problems (Figure 4).
The third model showed that when compared to the pre-frail, elderly people who
DISCUSSION
In national and international studies the prevalence of frailty has presented itself quite
variably. The frailty profile is not very distanced from those observed in the literature. A
study in the United States of America1, that used the same method as this study, found a
prevalence of pre-frailty 47% and frailty of 7%, remaining within the trust interval of the
elderly of this research.
However, other international surveys found a higher prevalence. In Spain, a study of
993 elderly people over 70 years showed much higher results in frailty (16.9%). However, it
is necessary to consider that this difference may have occurred due to the higher age sample.11
In a literature review12, with studies published in the United States and countries in
Europe, researchers estimated that the prevalence of frailty in these countries varies from 5%
to 58%, and that it increases proportionately with age.
Studies in Brazil are still recent and scarce, but have shown little variation across
regions. Belo Horizonte13, found a prevalence of 8.7% for frail elderly individuals aged 65 or
more. A study by the FIBRA Network, in a sample from Rio de Janeiro-RJ, 737 elderly
between 65 and 101 years were investigated, with an average age of 76.7 years. There was a
prevalence of 9.2% frail and 46.5% pre-frail. So, proportionally, there were more frail elderly
in the sample from Rio de Janeiro than in this study, but this difference was still within the
95% confidence interval, so it is not possible to say that there was a significant difference in
prevalence between these studies from different regions of the country.
Among the conditions significantly associated with a higher prevalence of frailty we
have the occurrence of stroke/cerebralvascular accident/ischemia. The relationship between
frailty and comorbidities can be determined by immunological dysfunction, neuroendocrine
dysregulation and chronic inflammatory processes as well as by structural organic alterations
failure, osteoarthritis, and depression.14,15 Chronic morbidities, particularly those associated
with pain and/or loss of function is often increased in the elderly and are more commonly
involved with the occurrence of frailty.16
Elderly people who do not work have higher prevalence of frailty. Frailty features a
loss of muscle mass, leading to more difficult work involving more physical effort. In this
regard, national17,18 and internacionl1,4,19 studies have focused their objectives on the
relationship between functional capacity and frailty.
In a research conducted in the United States, the researchers suggest that the onset of
the frailty syndrome, affects more complex activities and to a lesser extent the simplest and
routine.1 The authors found that 59.7% of frail elderly had difficulties in carrying out the
Basic Activities of Daily Living. In a survey conducted in Brazil, with 240 elderly, when
checking the frailty levels and Instrumental Activities of Daily Living /Basic Activities of
Daily Living, 81.9% of frail elderly had partial dependence; and 64.4% of those who did not
show frailty, were considered independent.20
Functional losses from the frailty also affects the advanced activities of daily living,
related to the social, cultural, religious, political and labor areas prone to isolation.4,21
Seniors who report having fallen in the last 12 months also had a higher prevalence of
frailty. Reasearchers22 found that seniors over age 65 are 30-40% more likely to suffer falls
than adults under that age, reaching 50% in the elderly over 80 years. According to the
authors, in the European Union, close to 40,000 deaths in the elderly occur per year due to
falls. In Brazil, there is an estimated prevalence between 30 and 60%.
Perhaps the reason for the higher prevalence of frailty in those who suffered a fall in
the last 12 months is the loss of muscle mass that elderly people suffering falls have, making
them more vulnerable.23 In addition, researchers24 add that another reason that leads to falls
Seniors who reported having sleep problems; also have a higher prevalence of frailty
compared to non-frail. The elderly tend to have changes in sleep patterns such as: quantitative
reduction of deep sleep stage, the threshold of the allowance for waking up related to
quantitative increase of a small amount of deep sleep, increased latency to fall sleep, reducing
the total duration of nocturnal sleep, a greater number of transitions from one stage to another
and for the vigil.25
Although recent, there seems to be much evidence of the relationship between sleep
quality and health. Difficulties with sleep can lead to drowsiness, physical fatigue, malaise,
irritability and decreased cognitive abilities, such as psychomotor performance, lapses of
attention and concentration difficulties, reduced memory for recent events, prolonged reaction
times.26
Other authors27 have found that the poor quality of sleep leads to loss of balance of the
central nervous system, reducing systolic blood pressure, decrease of temperature and body
metabolic rate; muscle relaxation; small decline in neuronal oxygenation; and processing of
various memories, which is extremely important for the preservation of homeostasis of the
human organism.
Not all these changes in metabolism and muscle mass caused by sleep increase the
chances of the elderly presenting frailty, since they can interfere in the five frailty indicators.
However, we found no specific study for this purpose. It is important to research more to
confirm this relationship.
It is considered that the objective of identifying the reasons for prevalence of frailty
syndrome with the demographic profile, health problems, use of legal drugs and problems
with sleep of the elderly has been reached and that the variables are not currently working, as
fall in the last 12 months and those with sleep problems were associated with higher
prevalence of frailty.
It is noteworthy that these results, together with others available in the literature, can
contribute to the understanding of the frailty epidemiology and also in the implementation of
specific programs aimed at reducing the prevalence of frailty, optimizing the quality of life. It
is suggested that future programs give special attention to the profiles of elderly people who
have not yet developed frailty, i.e., pre-frail. This could prevent the elderly from becoming
frail.
Finally, it is noted that perhaps one of the main limitations of this study are due to no
possibility of causal inferences due to the cross-sectional sample. It is hoped that future
ACKNOWLEDGEMENTS
The manuscript received financial support from the National Research Council - CNPq, the
Coordination Development of Higher Education Personnel - CDHEP, the Foundation for
Research Support of the State of São Paulo - FRSSSP and the Foundation for Research
Support of the State of Rio Grande do Sul - FRSSRGS. All authors contributed to the
completion of the study and participated in the analysis, interpretation of data, drafting and
DISCLOSURE STATEMENT
Conflict of Interest: I declare that neither I nor the other authors or any first degree relative,
possess financial and personal interests in the subject matter discussed in the manuscript. No
REFERENCES
1. Fried LP, Tangen CM, Walston J et al. Frailty in older adults: evidence for a phenotype. J
Gerontol A Biol Sci Med Sci. 2001; 56(3):146-156.
2. Oliveira DR, Bettinelli LA, Pasqualotti A, Corso D, Brock F, Erdmann AL. Prevalence of
frailty syndrome in old people in a hospital institution. Rev Lat Am Enfermagem. 2013;
21(4): 891-8.
3. Fried LP, Ferrucci L, Darer J, Williamson JD, Anderson G. Untangling the concepts of
disability, frailty, and comorbidity: implications for improved targeting and care. J Gerontol
A Biol Sci Med Sci 2004; 59(3): 255-63.
4. Tribess S, Oliveira RJ. Biological fragility syndrome in the elderly: systematic review. Rev.
Salud Publica (Bogota). 2011; 13(5): 853-64.
5. Silva NN. Amostragem probabilística: Um curso introdutório. 2ª ed. São Paulo: EdUSP,
2001.
6. Fried LP, Walston JM. Frailty and failure to thrive. In: Hazzard WR, Blass JP, Ettinger WH
Jr, Halter JB, Ouslander J. Principles of geriatric medicine and gerontology. 5ed. Nova York:
MacGraw-Hill, 2003.
7. Batistoni SST, Neri AL, Cupertino APFB. Validade da escala de depressão do Center for
Epidemiological Studies (CES-D) entre idosos brasileiros. Revista Saúde Pública. 2007;
41(4): 598-605.
8. Rauen MS, Moreira EAM, Calvo MC, Lobo AS. Avaliação do estado nutricional de idosos
9. Ainsworth BE, Haskell WL, Whitt MC et al. Compendium of physical activities: an update
of activity codes and MET intensities. Medicine and Sciences in Sports and Exercise. 2000;
32 (9): 498-516.
10. Nakano MM. Versão Brasileira da Short Physical Performace Battery-SPPB: adaptação
cultural e estudo de confiabilidade. Dissertação de Mestrado, Faculdade de Educação,
Universidade Estadual de Campinas, Campinas, 2007.
11. Abizanda P, Romero L, Sánchez-Jurado PM, Martínez-Reig M, Gómez-Arnedo
L, Alfonso SA. Frailty and mortality, disability and mobility loss in a Spanish cohort of older
adults: the FRADEA study. Maturitas. 2013; 74(1):54-60. doi:
10.1016/j.maturitas.2012.09.018. Epub 2012 Oct 26.
12. Sternberg SA, Wershof SA, Karunananthan S, Bergman H, Mark CA. J Am Geriatric Soc.
2011; 59(11): 2129-38.
13. Vieira RA, Guerra RO, Giacomin KC et al. Prevalência de fragilidade e fatores associados
em idosos comunitários de Belo Horizonte, Minas Gerais, Brasil: dados do estudo FIBRA.
Cad. Saúde Pública. 2013; 29(8): 1631-1643.
14. Oliveira DR, Bettinelli LA, Pasqualotti A et al. Prevalence of frailty syndrome in old
people in a hospital institution. Rev Lat Am Enfermagem. 2013; 21(4):891-898.
15. Amaral FLJ dos S, Guerra RO, Nascimento AFF et al. Apoio social e síndrome da
fragilidade em idosos residentes na comunidade. Ciências e Saúde Coletiva. 2013; 18(6):
1835-1846.
16. Lang PO, Michel JP, Zekry D. Frailty syndrome: a transitional state in a dynamic process.
17. Bez JPO, Neri AL. Velocidade da marcha, força de preensão e saúde percebida em idosos:
dados da rede FIBRA Campinas, São Paulo, Brasil. Ciência e Saúde Coletiva. 2014; 19(8):
3343-3353.
18. Carmo LV, Drummond LP, Arantes PMM. Avaliação do nível de fragilidade em idosos
participantes de um grupo de convivência. Fisioterapia e Pesquisa. 2011; 18(1): 17-22.
19. Neri AL, Yassuda MS, Araújo LF et al. Metodologia e perfil sociodemográfico, cognitivo
e de fragilidade de idosos comunitários de sete cidades brasileiras: Estudo FIBRA. Cad.
Saúde Pública. 2013; 29(4): 778-792.
20. Lenardt MH, Carneiro NHK, Betiolli SE, Ribeiro DK de MN, Wachholz PA. Prevalence
of pre-frailty for the component of gait speed in older adults. Rev. Latino Am Enfermagem.
2013; 21(3): 734-741.
21. Sousa AC, Dias RC, Maciel AC, Guerra RO. Frailty syndrome and associated factors in
community-dwelling elderly in Northeast Brazil. Arch Gerontol Geriatr. 2012; (54): 95-101.
22. Cunha AA, Lourenço RA. Quedas em idosos: prevalência e fatores associados. Revista
HUPE. 2014; 13(2): 21-29.
23. Willgoss TG, Yohannes AM, Mitchell D. Review of risk factors and preventive strategies
for fall-related injuries in people with intellectual disabilities. J Clin Nurs. 2010; 19(15-16):
2100-9.
24. Muir SW, Berg K, Chesworth B, Klar N, Speechley M. Quantifying the magnitude of risk
for balance impairment on falls in community-dwelling older adults: a systematic review and
25. Geib LTC, Cataldo Neto A, Wainberg R, Nunes ML. Sono e envelhecimento. R Psiquiatr
RS. 2003; 25(3): 453-65.
26. Paiva T. Bom Sono, Boa Vida. Faculdade de Medicina de Lisboa: Oficina do Livro, 2008.
27. Gaultney JF. The prevalence of sleep disorders in college students: Impact on academic
TABLES
Table 1. Description of independent variables of the study.
Tipology of variable Description and explanation
Demographic profile
Sex (Male or Female); Currently works (Yes or No); If the individual had some type of work that would establish routine schedules and responsibilities; Literate (Yes or No); If the individual could write and read a sentence; Family income in minimum wages; Age in years.
Indicators of health problems
Self-reported diseases: Have you had a stroke, cerebrovascular accident, ischemia (Yes or No); Ever had a tumor, cancer (Yes or No); Has had arthritis, rheumatism (Yes or No).
To these questions the elderly respond yes or no to the presence or absence of the problem:
Loss of appetite; Suffered any fracture; Were they bedridden at their home due to illness in the last year; realized more memory difficulties (if memory difficulties has increased compared to last year); Listens well (problems with hearing in the last year); See well (problem with vision in the last year); had to be admitted to hospital for at least one night in the last year.
Use of legal drugs
Smoked and quit (Yes or No), use time unitl they quit was not considered; Frequency which consumes alcoholic drinks (never consumes, consumes monthly consumes weekly).
Problems with sleep
Figure 1. Association of demographic variables between the profile of frail elderly.
VARIABLES NON-(1)FRAIL PRE-(2)FRAIL FRAIL (3) Models
p≤0,05
F (%) F (%) F (%)
Sex Male 55 (46,6%) 53 (44,9%) 10 (8,5%) (1-3) Female 102 (36,8%) 150 (54,2%) 25 (9,0%)
Currently working
Yes 31 (53,4%) 25 (43,1%) 2 (3,4%) (1-2) (1-3) No 126 (37,4%) 178 (52,8%) 33 (9,8%)
Literate Yes 111 (45,5%) 118 (48,4%) 15 (6,1%) (1-2) (1-3) No 46 (30,5%) 85 (56,3%) 20 (13,2%)
Family income
0.0-1.0 S.M. 22 (29,7%) 44 (59,5%) 8 (10,8%)
(1-2) (1-3) 1.1-3.0 S.M. 75 (36,9%) 111 (54,7%) 17 (8,4%)
3.1-5.0 S.M. 51 (52,6%) 37 (38,1%) 9 (9,3%)
Age range
65-69 63 (52,5%) 48 (40,0%) 9 (7,5%)
(1-2) (1-3) 70-74 50 (41,0%) 64 (52,5%) 8 (6,6%)
75-79 24 (33,8%) 40 (56,3%) 7 (9,9%) ≥80 20 (24,4%) 51 (62,2%) 11 (13,4%)
Figure 2. Association of health problems with the profile of frail elderly.
VARIABLES NON-(1)FRAIL PRE-(2)FRAIL FRAIL (3) Models
p≤0,05
F (%) F (%) F (%)
Has had a stroke, cerebralvascular accident, ischemia
No 102 (43,6%) 113 (48,3%) 19 (8,1%)
(1-3) (2-3) Yes 6 (35,3%) 7 (41,2%) 4 (23,5%)
Has had a tumor, cancer
No 102 (42,9%) 116 (48,7%) 20 (8,4%)
(2-3) Yes 6 (46,2%) 4 (30,8%) 3 (23,1%)
Has had arthritis, rheumatism
No 66 (46,8%) 66 (46,8%) 9 96,4%)
(1-3) Yes 42 (38,2%) 54 (49,1%) 14 (12,7%)
Loss of apetite No 20 (27,8%) 43 (59,7%) 9 (12,5%) (1-2) (1-3) Yes 85 (49,1%) 74 (42,8%) 14 (98,1%)
Has had a fall No 78 (49,1%) 71 (44,7%) 10 (6,3%) (1-2) (1-3) Yes 27 (32,1%) 45 (53,6%) 12 (14,3%)
Has suffered a fracture
No 20 (32,3%) 30 (48,4%) 12 (19,4%)
* Yes 6 (35,3%) 10 (58,8%) 1 (5,9%)
Has been bed ridden because of a disease
No 89 (46,4%) 88 (45,8%) 15 (7,8%)
* Yes 20 (33,9%) 31 (52,5%) 8 (13,6%)
Memory Difficulties No 61 (40,9%) 79 (53,0%) 9 (6,0%) (2-3) Yes 45 (46,4%) 39 (40,2%) 13 (13,4%)
Hears well Yes 89 (47,6%) 82 (43,9%) 16 (8,6%) (1-2) No 20 (30,8%) 38 (58,5%) 7 (10,8%)
Sees well Yes 70 (48,6%) 64 (44,4%) 10 (6,9%) * No 38 (35,5%) 56 (52,3%) 13 (12,1%)
Needed to spend at least one night at the hospital
No 91 (46,4%) 87 (44,4%) 18 (9,2%)
(1-2) Yes 18 (31,6%) 34 (59,6%) 5 (8,8%)
Figure 3. Association of tobacco use, alcohol and problems with sleep between the frail elderly profile.
VARIABLES NON-(1)FRAIL PRE-(2)FRAIL FRAIL(3) Models
p≤0,05
F (%) F (%) F (%)
Smoked and quit No 42 (33,3%) 71 (56,3%)
13
(10,3%) (1-2)
Yes 53 (54,1%) 36 (36,7%) 9 (9,2%)
Frequency
consuming alcohol
Never 22 (64,7%) 10 (29,4%) 2 (5,9%)
(1-2) Monthly 78 (39,2%) 102 (51,3%) 19 (9,5%)
Weekly 5 (45,5%) 4 (36,4%) 2 (18,2%)
Sleep problems No 64 (52,5%) 50 (41,0%) 8 (6,6%) (1-2) (1-3) Yes 45 (34,6%) 70 (53,8%) 15 (11,5%)
Has taken sleeping pills
No 88 (44,2%) 96 (48,2%) 15 (7,5%)
* Yes 21 (39,6%) 24 (45,3%) 8 (15,1%)
Wakes up in the middle of the night and can't go back to sleep
No 68 (50,7%) 55 (41,0%) 11 (8,2%)
(1-2) Yes 41 (34,7%) 65 (55,1%) 12 (10,2%)
Stays awake most of the night
No 85 (46,2%) 85 (46,2%) 14 (7,6%)
* Yes 24 (35,3%) 35 (51,5%) 9 (13,2%)
Takes too much time to fall asleep
No 79 (52,0%) 61 (40,1%) 12 (7,9%)
(1-3) Yes 30 (30,0%) 59 (59,0%) 11 (11,0%)
Does not sleep well at night
No 86 (48,0%) 78 (43,6%) 15 (8,4%)
(1-2) Yes 23 (31,9%) 41 (56,9%) 8 (11,1%)
Figure 4. Models of the reasons for adjusted prevalence (RP) among the factors associated with the phenotype of frailty among the elderly.
Sig. Adjusted RP
Trust interval of 95% of RP
Inferior Superior
1º - MODEL BETWEEN NON-FRAIL AND PRE-FRAIL
Literate Yes <0,01 1,12 1,03 1,21
Age range
65-69
70-74 0,16 1,08 0,96 1,21
75-79 <0,01 1,23 1,10 1,37
≥80 0,01 1,16 1,03 1,30
Sees well No 0,05 1,08 1,00 1,17
Needed to spend at least one
night at the hospital Yes <0,01 1,14 1,03 1,25
Frequency consuming alcohol
Never
Monthly 0,03 1,16 1,01 1,32 Weekly 0,05 1,28 0,99 1,64
Smoked and quit Yes 0,01 0,89 0,81 0,97
Wakes up in the middle of the night and can't go back to sleep
Yes <0,01 1,12 1,03 1,23
2º - MODEL BETWEEN NON-FRAIL AND FRAIL
Currently working No 0,05 1,26 1,00 1,58
Has had a stroke,
cerebralvascular accident, ischemia
Yes
0,02 1,36 1,05 1,77
Has had a fall in the last 12 months
Yes
0,04 1,24 1,00 1,53
Has sleep problems Yes 0,03 1,22 1,01 1,47
3º - MODEL BETWEEN PRE-FRAIL AND FRAIL
Memory Difficuties Yes 0,02 1,07 1,01 1,14
Variables that came out in the steps of the 1st regression model
Step 1 - Family income; Step 2 - Wakes up early in the morning and does not get more sleep; Step 3 - Sleep problems; Step 4 - Loss of appetite; Step 5 - hears well; Step 6 - currently working; Step 7 - sleeps badly at night; Step 8 - suffered falls in past 12 months
Variables that came out in the steps of the 2nd regression model
Step 1 - It takes a long time to fall asleep; Step 2 - Age range; Step 3 - literate; Step 4 - Have you had arthritis, rheumatism; Step 5 - Loss of appetite.
Variables that came out in the steps of the 3rd regression model
6 COMENTÁRIOS, CRÍTICAS E SUGESTÕES
O doutorado foi um grande desafio e ao mesmo tempo uma grande oportunidade para lapidar o meu crescimento pessoal e profissional, aperfeiçoando-me na pesquisa científica.
O nosso objeto de estudo foi o idoso frágil, promovendo um (re)encontro com a problemática do envelhecimento populacional e suas implicações sociais e econômicas, abordado no mestrado. Embora a temática seja internacionalmente discutida com publicações abordando diferentes aspectos da Fragilidade no idoso, no Brasil os estudos são recentes, especialmente na região nordeste a discussão sobre o tema ainda é escasso.
Ao participar de um estudo populacional em Campina Grande/PB, intitulado Rede Fibra, acrônimo de Fragilidade em Idosos brasileiros, vislumbrei a possibilidade de discutir esse objeto de estudo com maior aprofundamento e rigor científico no doutorado. Nesse movimento de interlocução, tivemos a colaboração da Profa. Dra, Maria do Carmo Eulálio da Universidade Estadual da Paraíba e coordenadora da pesquisa em Campina Grande.
A inserção no doutorado no Programa de Pós-Graduação em Ciências da Saúde (PPGCSA), orientada pela Profa. Dra. Iris do Céu Clara Costa, possibilitou relevantes ganhos intelectual. Como discente, tive a oportunidade de fortalecer os meus conhecimentos ao cursar as disciplinas obrigatórias e algumas complementares e ao participar do grupo de Pesquisa em Saúde Coletiva. Nesse sentido, destaca-se a criação da comunidade “Seminários Avançados em Saúde Coletiva” no SIGAA, que permitiu a troca de ideias e materiais entre os doutorandos do PPGCSA e do Programa de Pós-Graduação em Saúde Coletiva.
Gostaríamos de ressaltar a iniciativa do PPGCSA em incluir a disciplina Seminários de Tese que potencializou as orientações presenciais e contribuiu para nos manter ativos e motivados na condução da tese.
A trajetória de aprendizagem como pesquisadora foi etapa marcante desse processo. A construção de nossa tese de doutorado prosseguiu e teve como primeiro produto, um artigo sobre a Prevalência da Síndrome da Fragilidade e os fatores associados. O segundo produto, o artigo intitulado “Razão de prevalência da Síndrome da Fragilidade de idosos em função dos estilos e hábitos de vida” foi enviado e aguarda publicação. Nesse sentido, observa-se que a meta de comprovar capacidade de produzir e publicar ao menos um artigo científico exigida no regimento do programa foi alcançada, com esforço e muita expectativa frente às exigências das revistas internacionais.
7 REFERÊNCIAS
1. Veras R. Envelhecimento populacional contemporâneo: demandas, desafios e inovações. Rev. Saúde Pública 2009; 43(3): 548-54.
2. Ota A, Yasuda N, Horikawa S, Fujimura T, Ohara H. Differential effects of power rehabilitation on physical performance and higher-level functional capacity among community-dwelling older adults with a slight degree of frailty. J Epidemiol 2007; 17(2): 61-7.
3. Frisoli A Jr., Chaves PH, Ingham SJ, Fried LP. Severe osteopenia and osteoporosis, sarcopenia, and frailty status in community-dwelling older women: results from the Women's Health and Aging Study (WHAS) II. Bone 2011; 48(4):952 -7.
4. Fried LP, Tangen CM, Walston J et al. Frailty in older adults: evidence for a phenotype. J Gerontol A Biol Sci Med Sci. 2001; 56(3):146-156.
5. Sternberg SA, Wershof SA, Karunananthan S et al. The identification of frailty: a systematic literature review. J Am Geriatric Soc. 2011 Nov; 59(11):2129-38.
6. Oliveira DR, Bettinelli LA, Pasqualotti A et al. Prevalence of frailty syndrome in old people in a hospital institution. Rev Lat Am Enfermagem. 2013 Jul-Aug; 21(4):891-8.
7. Fried PL, Ferrucci L, Darer J et al. Untangling the concepts of disability, frailty, and comorbidity: implications for improved targeting and care. J Gerontol A Biol Sci Med Sci 2004; 59(3):255-63.