T
EST
S
CORE
D
ISCLOSURE AND
S
CHOOL
P
ERFORMANCE
BRAZ MINISTÉRIO DE CAMARGO
SERGIO FIRPO
VLADIMIR PONCZEK
Junho
de 2011
T
Te
ex
x
to
t
os
s
p
pa
ar
r
a
a
D
Di
is
sc
c
us
u
ss
s
ão
ã
o
289
C
C
-M
-
Mi
ic
c
ro
r
o
W
Wo
or
rk
k
in
i
ng
g
P
Pa
ap
pe
er
r
S
Se
e
ri
r
ie
es
s
Os artigos dos Textos para Discussão da Escola de Economia de São Paulo da Fundação Getulio
Vargas são de inteira responsabilidade dos autores e não refletem necessariamente a opinião da
FGV-EESP. É permitida a reprodução total ou parcial dos artigos, desde que creditada a fonte.
Test Score Disclosure and School Performance
Braz Camargo, Rafael Camelo, Sergio Firpo and Vladimir Ponczek∗
S˜ao Paulo School of Economics - FGV
May 22, 2011
Preliminary and Incomplete
Abstract
In this paper we test whether the disclosure of test scores has direct impacts on student performance, school composition and school inputs. We take advantage of the discontinuity on the disclosure rules of The National Secondary Education Examination (ENEM) run in Brazil by the Ministry of Education: In 2006 it was established that the 2005 mean score results would be disclosed for schools with ten or more students who took the exam in the previous year. We use a regression discontinuity design to estimate the effects of test disclosure. Our results indicate that private schools that had their average scores released in 2005 outperformed those that did not by 0.2-0.6σin 2007. We did not find same results for public schools. Moreover, we did not find evidence that treated schools adjusted their inputs or that there was major changes in the students composition of treated schools. These findings allow us to interpret that the main mechanism driving the differences in performance was the increased levels of students’, teachers’ and principals’ effort exerted by those in schools that had scores publicized.
1
Introduction
School quality is hard to be acutely observed. In absence of accountability systems, individuals rely on school observed characteristics to infer school quality. However, school observable inputs are noisy signals of school quality since school production function is generally unknown and students’, teachers’ and principals’ effort are not observed. In this sense, one should expect that providing information on the quality of schools would affect the behavior of schools, parents and students.
The literature has evidence that parents take into consideration test scores in the school choice decision. For instance, Black [1999], Figlio and Lucas [2004] and Fack and Grenet [2010] have shown that school score reports do affect housing prices. Hastings and Weinstein [2008]
explore an experiment on Charlotte-Mecklenburg Public School district in the US to examine whether providing information on schools test scores impact parental school choices. They find that the fraction of parents choosing higher-performing schools increases after receiving information on school test scores. Koning and van der Wiel [2010] find a positive correlation between drops in a publicly available school quality ranking and demand decreases for the entrance year in the Netherlands. Unlike those studies, Mizala and Urquiola [2009] find no consistent effect of identifying outstanding Chilean schools to the public on the awarded schools’ enrollment, tuition and socioeconomic composition of students.
There is also evidence that schools react to the introduction of accountability systems. Most of the literature explore state-level variation after the implementation of the No Child
Left Behind Act - NCLB. Carnoy and Loeb [2003], Hanushek and Raymond [2005] ,Dee and
Jacob [2009], Bacolod et al. [2009]and Chiang [2009]show effects of the NCLB act on the usage of inputs. Craig et al. [2009], Jacob [2005] and Figlio and Rouse [2006] show how student proficiency levels are affected by the introduction of the NCLB act.
If test score is a cleaner signal of school quality1
, one can conjecture that the disclosure of schools’ average test scores could impact students’ performance. It is possible that after receiving the information on the school test scores, parents and students change their behav-ior. Moreover, schools (teachers and principals) that have a low score released are held more accountable for student performance and start to exert more effort. In this sense, Pop-Eleches and Urquiola [2011] show that parents dedicate less time to help children in their homework after being accepted in a better school and Figlio and Rouse [2006] claim that the introduction of accountability system in Florida induced gains in proficiency in low-performing schools that were largely due to the stigma of receiving a low grade.
In this paper, we take advantage of the discontinuity on the disclosure rules of The National Secondary Education Examination (ENEM) in Brazil to test whether the disclosure of test scores impacts student performance, school composition and school inputs. It was established in 2006 (after the 2005 exam) by Ministry of Education that only schools with ten or more students who took the exam would have their mean score released. We use a regression discontinuity (RD) design to estimate the effects of the test disclosure. To the best of our knowledge, there is no study in the literature that investigate the pure effects of the disclosure of school mean test scores as a measured of school quality on student proficiency and schools’ responses.
In short, our RD results indicate that private schools that had their average scores released in 2005 outperformed those that did not by 0.2-0.6 standard deviation of test score distribution (σ) in 2007. We did not find the same result for public schools. Moreover, we did not find evidence that treated schools adjusted their inputs or that there were major changes in the students composition of treated schools.
1It is not consensual that simple schools’ mean test scores provide a clean signal of school quality. For
The channels through such difference may act are differential effort levels between treated and control groups. Students now have a better predictor of their school quality and will react to it. In that relative sense, and because ENEM is an entrance exam for higher education, students that receive this less noisy signal of the quality of their school will exert positive levels of effort if the disclosed score is not satisfactory. This should be particularly true for schools around the discontinuity, as they tend to do worse than schools with larger number of exam takers. Because school administrators in private schools face market incentives to keep a certain level of reputation, some of them will also react to scores publication. Also, because public school administrators do not face the same incentive constraints, they will not respond to publication in the same way that private school administrators.
This paper proceeds as follows. The next section describes the ENEM. Section 3 explains the data sources. The theoretical predictions and identification strategy are presented in section 4. Results are discussed in section 5. Section 6 concludes.
2
Institutional Background: ENEM
ENEM was created in 1998 to assess the profile of students who have finished High School in Brazil. It is organized by the National Institute for Educational Studies and Research (INEP) of the Ministry of Education (MEC). The individual student score is used for admission to several public and private Universities. It is also in the selection of the beneficiaries of the Federal College Voucher Program (ProUni). Until 2008, it was a non-mandatory one-day exam and consisted of 63 multiple-choice questions on different subjects (Portuguese language, History, Geography, Math, Physics, Chemistry and Biology) and an essay. From 2009 on, the ENEM is a two-day exam composed of 180 multiple-choice questions and an essay. It remains non-mandatory.
The fact that the exam is non-mandatory may raise questions about the selectivity of the sample. However, the great majority of graduating students take the exam, especially those stu-dents in private schools. In our sample, which we describe below, more than 90% of graduating students in private schools took the exam in 2007.
Starting in 2006, INEP began to release the schools’ average scores of the previous year. Schools with 10 or more ENEM takers have their average score released to the public in the following year. The school score is the average of all students who finished high school in that year (3rd graders).
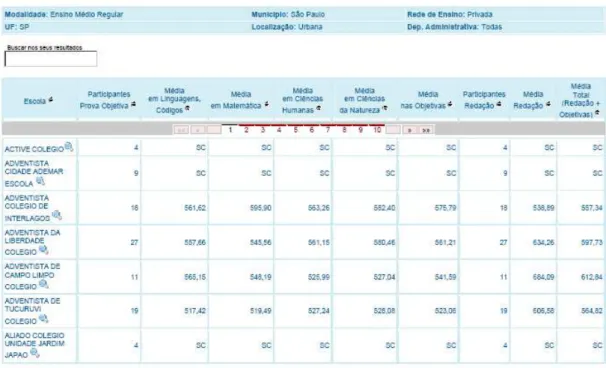
The ENEM scores are standardized in a 0-100 scale with mean 50. It has not used Item Response Theory until 2009. The scores are publicized by the major newspapers, websites and also by the INEP’s website.2
2See Figure 1 showing a screen on how ENEM scores by school appear on INEP’s website
3
Data
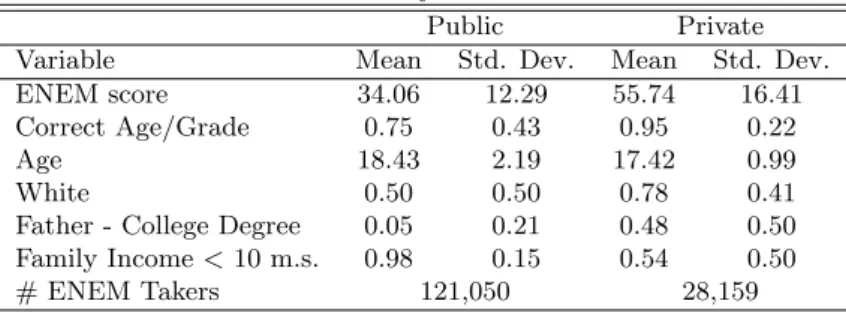
We use two databases: 2005 and 2007 ENEM Microdata and 2007 School Census. ENEM databases have information on test scores, number of ENEM takers and socio-demographic characteristics such as age, race, family income, parental schooling.
We are able to recover individual ENEM scores for schools below and above the cutoff point of 10 exam takers. Because we have access to individual results we can calculate school average scores for 2005, even though they were never publicized.
School Census has information on the schools’ characteristics: number of students; number of teachers; teachers’ schooling; principal schooling; existence of science and computer labs and libraries; and internet access.
We have analyzed the results for S˜ao Paulo Metropolitan Area (SPMA), the largest metropoli-tan area and, therefore, the largest school market in the country. Besides, given that one tenth of the Brazilian population lives in SPMA this analysis certainly has generalizable implications for the rest of the country.
4
Theoretical Predictions and Empirical Strategy
4.1 Theoretical Predictions
We assume that there exists a mapping g that links individual student proficiency (P) to his characteristics (X,θ) and school characteristics (I,η):
Pist=g(Xit, Ist, θit, ηst)
Where subscripts i,sand trepresent respectively student, school and time. The function g
is a school production function; X is a vector of observable background student characteristics such as age, gender, race/ethnicity and family characteristics;I is a vector of observable school inputs such as pupil/teacher ratio, teachers’ qualification; existence of library, computers and science labs; θ and η are student and school unobservable characteristics respectively. We assume that θit is a function of student’s innate ability (ζi) and his effort (εit), whereas ηst is
a function of school’s intrinsic quality (ξs) and school’s effort (ϑst). Following the education
literature, we call η the school value-added.
It is plausible to expect that any informational shock in this market will affect students and schools levels of effort and the matching between students and schools. For example, a student
iin a schoolsat timet+ 1 will learn about the past quality of his/her schoolηst if an average
Pst is available for all schools. Students will eventually reoptimize their level of effortεit+1 after
using Pst to construct a predictor for ηst+1.
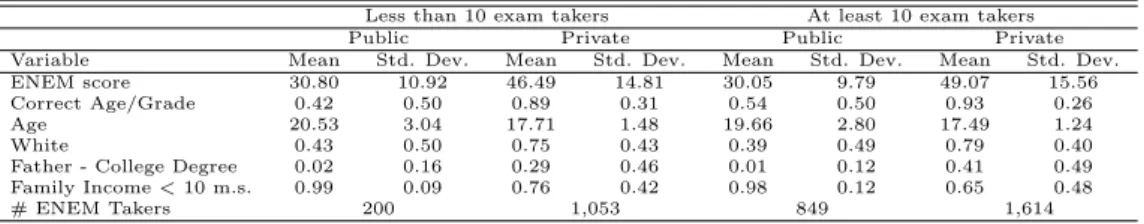
We exploit the publication of the 2005 ENEM average scores by school in 2006 as an in-formational shock in the Brazilian secondary education market. As previously discussed, in 2006 ENEM results from the 2005 exam became public at school level. In order to preserve the anonymity of students, INEP decided that only schools that had at least 10 exam takers in 2005 would have their averages publicized. Interestingly, this rule was created after the 2005 exam and therefore had no direct impact on students or school behavior on that year. That schools and their students have same characteristics immediately below and after the publication rule of 10 exam takers can be seen in Table 2.
We exploit the exogenous publication rule of school scores at timetto be able to identify, at time t+ 1, the effect of decreasing the informational asymmetry of education quality between students and schools on: (i) the sorting of students and schools, which corresponds to changes in Xit+1 for a given school s; (ii) changes in observable educational inputs, which correspond
to changes in Ist+1; (iii) and changes in students and school efforts, which correspond, after
controlling forXit+1 and Ist+1 to changes in Pist+1.
The ENEM informational shock can be seen as a partial remover of the veil on η. Students that had access on their own school average score could re-optimize and adjust their expectations and effort levels once a predictor for ηst+1 became available. The theoretical reason has been
described in detail in a previous section (to appear) and can be summarized as following: If
g is a known production function strictly increasing on effort (or if everybody has the same ignorance degree aboutg), studentiat timet+ 1 will update his/her belief on ηst+1 from
e
ηst+1=g−1 Xst+1, Ist+1, Eθ|Xst+1, Ist+1, EP|Xst+1, Ist+1
to
b
ηst+1=g−1 Xst+1, Ist+1, Eθ|Xst+1, Ist+1, Pst, EP|Xst+1, Ist+1, Pst.
Therefore, we expect that in 2006, the assessment that students who would finish high school in 2007 made on their own school quality was much better informed than students who finished high school in 2005. Information on the average proficiency of class of 2005 was publicly available and comparable to that of other schools. Thus, students who would be taking the exam in 2007 could have a better predictor of their success in being admitted in higher education than those graduating two years before.
ENEM result is used for admissions into higher education and the update on the quality of the school lowered students’ expectations on being admitted under usual level of effort; school staff (teachers and principals) because they have to respond accordingly and try to adjust the school quality η to regain the lost reputation. Given that ENEM is not a mandatory exam, students in schools in the lower end of the ENEM distribution would have less incentives to take the ENEM, but those taking it should be exerting more effort than the previous cohorts. Otherwise, if ENEM was mandatory, it could be arguably ambiguous the effect of being low ranked on students efforts.
The reputational effect is presumably more important for school administrators who are accountable for a low performance of students on ENEM. In that sense, it is interesting to break down the effect of ENEM publication on school effort for two types of schools, private and public schools. Before publication of ENEM, private schools could monetize their informa-tional rents but public schools did not face the same market incentives. In fact, there is little anecdotal evidence that school principals in the public system were ever held accountable for a low performance of their students on ENEM, which is a voluntary exam. However, students and parents who are more concerned with admissions into higher education have now better information and might try sorting into the best public schools.
Interestingly, students on schools that did not have their average scores being publicized, ie, schools with fewer than 10 students taking the exam, were not able to perform a complete update on their beliefs about school quality. They could infer, conditionally on school observables, what would have been the ranking of their school, but this matching on observables P∗st =
EP|Xst+1, Ist+1
uses the same information for prediction that was used before, and, because of that, does not increase prediction power. Algebraically we have that
EhP|Xst+1, Ist+1, P∗st
i
=EP|Xst+1, Ist+1
.
In that sense, students in schools with no publication of ENEM were not able to unveil η of their school as precisely as those students in schools that had their scores publicized.
In sum, students in both types of schools, public and private, above the cutoff point were expected to do some sort of reoptimization responding to availability of a less noisy signal of the school quality. However, because school staff of public and private schools face different incentives we expect that teachers and principals of public schools would not respond with the same intensity to score publication as their counterparts in private schools.
2007 ENEM released, as long as they had the same number of students enrolled in the final high school year in 2007. Thus, any observable differences that we find in 2007 between treated and control schools cannot be attributed to a differential probability of being checked in 2007, which in fact could have affected their actions. Thus, any differential probability of having 2007 ENEM publicized would show up in different 2007 school sizes between treated and control schools.
The anticipation effect of having their 2007 publicized could also lead to changes in school inputs and efforts. However, if the probability of being checked is the same across treatment and control groups, one should not expect that there are any systematic differences between these groups. The only differences that one could detect should come, in principle, from the informational shock that the 2005 ENEM publication could have had on treated schools and their students.
4.2 Empirical Strategy
We take advantage of the exogenous publication rule of ENEM 2005 to estimate the reduced-form causal effects of publication on (i) students sorting to schools; (ii) changes in school inputs; (iii) students’ proficiency.
Consider the following specification:
Yist=αY +βY.ds+φY(T2005s−10) +ds·ψY(T2005s−10) +ǫY,ist. (1)
For a given variable of interest Y, we are interested in the impact of 2005 ENEM publication onY. Allowing for a flexible underlying relationship between the number of 2005 ENEM takers in each school (T2005) and Y, which is captured by the polynomial functionsφ(·) andψ(·) the coefficientβY ond= 1{T2005−10≥0} measures the impact of the ENEM publication onY.
The variable ǫY is an unobservable term that shall be mean-independent of dat T2005 = 10
under usual assumptions on continuity ofφY(·) andψY(·) atT2005 = 10, as discussed in Hahn
et al. [2001], Imbens and Lemieux [2008](2009) Lee and Lemieux [2010].
5
Results
5.1 Testing for Presence of Confounding Factors
We use the 2005 ENEM publication rule that released school average test scores for schools with at least 10 graduating students taking the exam. In order to investigate whether schools could manipulate the rule, we checked whether there was a jump in the frequency of schools at the discontinuity. Figure 2 shows that there is no important jump at the discontinuity.
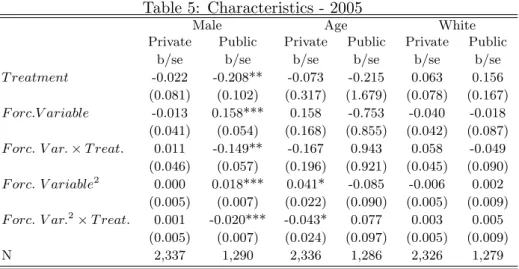
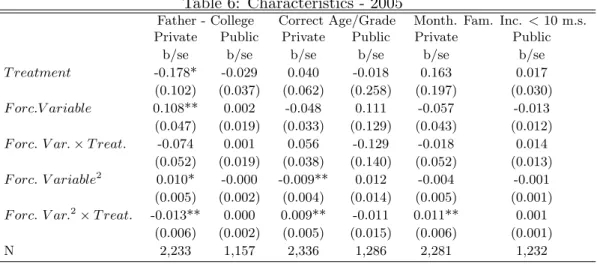
This evidence is not surprising. ENEM is a voluntary exam for the student and schools learned about the rule on publication several months after the exam was taken. Also, evidence on difference on observed characteristics between treated and control students and schools could not be found for the 2005 sample, as presented in Tables 1 to 3 (see previous section) and in Tables 4, 5 and 6.
Tables 4, 5 and 6 are interesting because they show that not only observable characteristics were the same for treated and control groups in 2005, but also there is evidence that unob-servables were not different across these two groups. Given that 2005 ENEM results contain information on observables and unobservables, the two combined evidences of no differences in observables and no differences in scores allow us to infer that unobservables should also present no difference between treated and control groups.
In Figures 3 and 4 we show that these results are robust for flexible choices of φY and ψY:
We first specify a quadratic specification for both functions and later we run non-parametric regressions using local linear regressions. In both cases and for several choices of kernels and bandwidths results remain robust.
We conclude that evidence presented in this subsection supports the claim that there was no observable and unobservable confounding factors that could explain future changes in inputs or outcomes two years after 2005 exam.
5.2 Testing for Sorting, Gaming and School Input Rearrangements
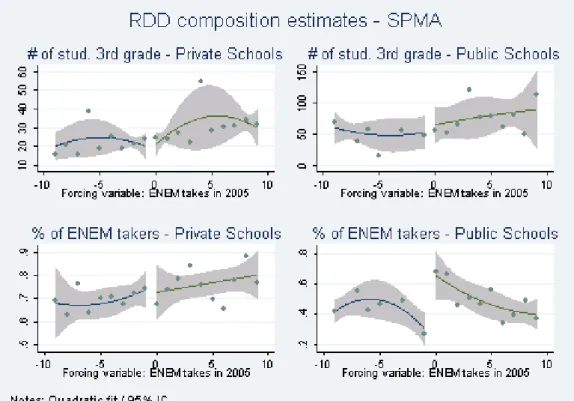
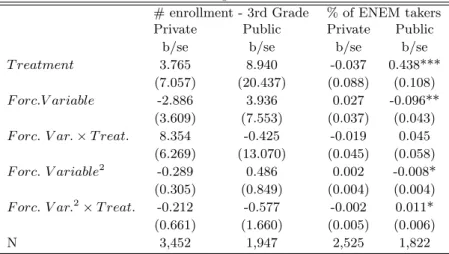
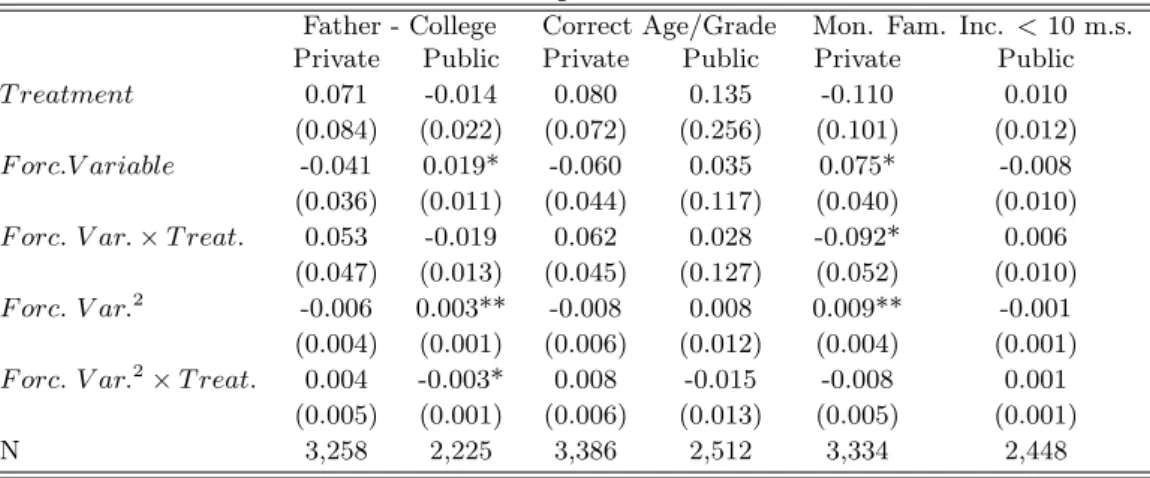
We investigate whether the release of test scores by schools had any impact on sorting of students and schools. If there was sorting, one should expect that characteristics of enrolled students would change from 2005 to 2007 differentially across treated and control schools. Given that students were similar across groups in 2005, we have to check whether there are systematic differences in 2007.
Table 7 shows that there was no important difference in students characteristics in 2007 between treated and control groups. Specifically, school size at the final year of high school, measured as proportion of ENEM takers is not different between treated and control schools.
seem to refute the gaming hypothesis, ie, that schools that had scores publicized could not affect students decision to participate in the exam in a different way from those schools that did not have their scores public. Figures 5 to 7 and Tables 10 to 11 show more evidence on that, allowing for several flexible specifications and robustness checks.
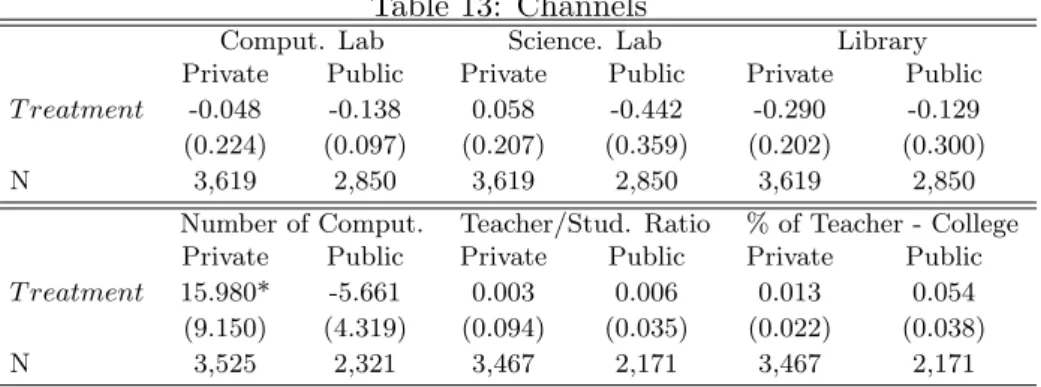
Finally, we checked whether schools were able to react to publication of scores by altering their inputs. Interestingly, we found no evidence that treated schools affected their inputs differ-entially from control schools (Table 13). This seems to be a piece of evidence that publication of past scores was not an important factor on creating any sizeable observational school reaction.
5.3 The Effect of Scores Publication on Effort Levels
We use a residual argument to investigate whether publication affected effort levels. We had collected supporting evidence that score publication induced no important difference on observ-able characteristics of students and schools. However, we have strong evidence that scores in 2007 did change between groups: students from treated schools had better performance than students from control schools. Moreover, such effects were sound only for the subsample of private schools.
Figures 8 to 10 show that there is a substantial difference in scores between students in treated and control groups. Such difference is persistent for all specifications. Figures 11 to 13 and Tables 15 to 15 illustrate this point.
The channels through such difference may act are differential effort levels between treated and control groups. Students now have a better predictor of their school quality and will react to it. We see from Figure 14 that the average scores of schools on the right side of the discontinuity are way below the rest of student population. In that relative sense, and because ENEM is an entrance exam for higher education, students that receive this less noisy signal of the quality of their school will exert positive levels of effort in order to increase their admission chances. Note that because students in private schools have better scores, they have more competitive profiles than students from public schools. That is a possible explanation for differences found in private but not in public schools.
Because school administrators in private schools face market incentives to keep a certain level of reputation, some of them, depending on their initial endowment of quality ξ, will also react to scores publication. Also, because public school administrators do not face the same incentive constraints, they will not respond to publication in the same way that private school administrators.
Therefore, we cannot, at this point identify, if changes in observable performance are mainly due to parental pressure and student’s effort or to market incentives that school administrators face.
an increase in a range between 0.2 to 0.6 of score standard deviation. These are by all accounts important effects.3
5.4 Robustness Checks
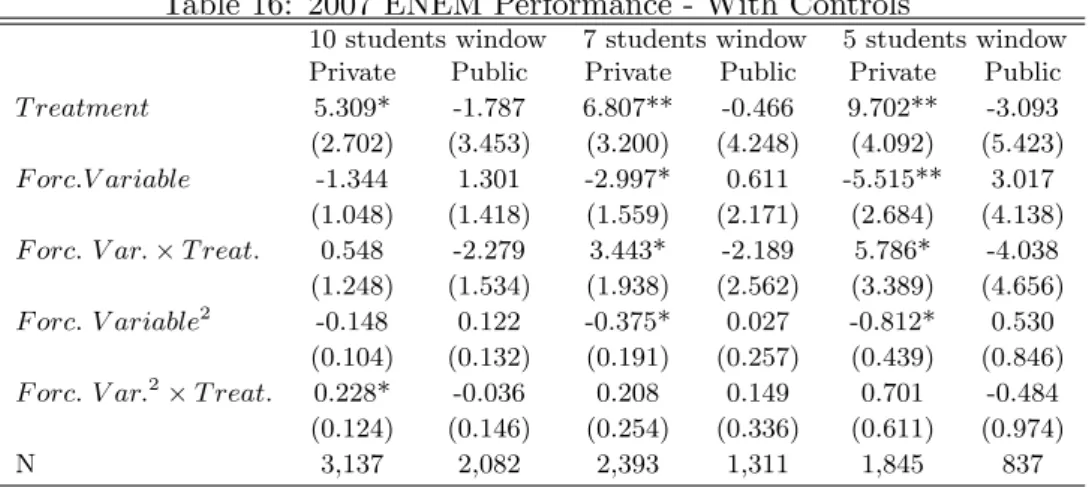
We have also performed some robustness checks. We have first checked whether results change if we include covariates. Table 16 and Figure 15 show that we have no important differences.
We also falsify the discontinuity and used different points other than 10. Table 17 and Figures 16-19 show that results are only present at the true discontinuity point.
6
Conclusions
In this paper we found evidence that the disclosure of schools’ average test scores did impact students’ performance. We used an exogenous disclosure rule of school test scores that.enable us to the identify the pure effect of information disclosure. This is an unique opportunity to isolate the informational channel of educational accountability systems. In general, accountability systems are universal and the empirical literature has mainly exploited either before and after variation or differences in incentives for low and high-performing schools.
Our results indicate that private schools that had their average scores released in 2005 outperformed those that did not by 0.2-0.6σ in 2007. We did not find the same result for public schools. Moreover, we did not find evidence that treated schools adjusted their inputs or that there were major changes in the students composition of treated schools.
The key channel through which test results disclosure affected future proficiency is the effort channel. Students and parents now have a better predictor of their school quality and reacted to it, given that individual exam results may be used for entrance into the higher education system. In addition, schools (teachers and principals) that have a low score released also had to start exerting more effort to reestablish reputation. This last effect is particularly important in private schools, whose principals face market incentives to keep a certain level of reputation.
References
Marigee Bacolod, John DiNardo, and Mireille Jacobson. Beyond incentives: Do schools use accountability rewards productively? NBER Working Papers 14775, National Bureau of Eco-nomic Research, Inc, March 2009. URL http://ideas.repec.org/p/nbr/nberwo/14775. html.
Sandra E. Black. Do better schools matter? parental valuation of elementary education. The
Quarterly Journal of Economics, 114(2):577–599, May 1999. URL http://ideas.repec. org/a/tpr/qjecon/v114y1999i2p577-599.html.
Martin Carnoy and Susanna Loeb. Does external accountability affect student outcomes? a cross-state analysis. Education Evaluation and Policy Analysis, 24(4):305–331, 2003.
Hanley Chiang. How accountability pressure on failing schools affects student achievement.
Journal of Public Economics, 93(9-10):1045–1057, October 2009. URLhttp://ideas.repec.
org/a/eee/pubeco/v93y2009i9-10p1045-1057.html.
Steven G. Craig, Scott Imberman, and Adam Perdue. Does it pay to get an a? school resource allocations in response to accountability ratings. Working Papers 2009-04, Department of Economics, University of Houston, October 2009. URL http://ideas.repec.org/p/hou/ wpaper/2009-04.html.
Thomas Dee and Brian Jacob. The impact of no child left behind on student achievement. NBER Working Papers 15531, National Bureau of Economic Research, Inc, November 2009. URLhttp://ideas.repec.org/p/nbr/nberwo/15531.html.
Gabrielle Fack and Julien Grenet. When do better schools raise housing prices? evidence from paris public and private schools. Journal of Public Economics, 94(1-2):59–77, February 2010. URLhttp://ideas.repec.org/a/eee/pubeco/v94y2010i1-2p59-77.html.
David N. Figlio and Maurice E. Lucas. What’s in a grade? school report cards and the housing market. American Economic Review, 94(3):591–604, June 2004. URLhttp://ideas.repec. org/a/aea/aecrev/v94y2004i3p591-604.html.
David N. Figlio and Cecilia Elena Rouse. Do accountability and voucher threats improve low-performing schools? Journal of Public Economics, 90(1-2):239–255, January 2006.
Jinyong Hahn, Petra Todd, and Wilbert Van der Klaauw. Identification and estimation of treatment effects with a regression-discontinuity design. Econometrica, 69(1):201–09, January 2001. URL http://ideas.repec.org/a/ecm/emetrp/v69y2001i1p201-09.html.
Eric A. Hanushek and Margaret E. Raymond. Does school accountability lead to improved student performance? Journal of Policy Analysis and Management, 24(2),:297–327., 2005.
Justine S. Hastings and Jeffrey M. Weinstein. Information, school choice, and aca-demic achievement: Evidence from two experiments. The Quarterly Journal of
Eco-nomics, 123(4):1373–1414, November 2008. URLhttp://ideas.repec.org/a/tpr/qjecon/
Guido W. Imbens and Thomas Lemieux. Regression discontinuity designs: A guide to practice.
Journal of Econometrics, 142(2):615–635, February 2008. URL http://ideas.repec.org/
a/eee/econom/v142y2008i2p615-635.html.
B. Jacob. Accountability, incentives and behavior: Evidence from school reform in chicago.
Journal of Public Economics, 89(5-6):761–796, 2005.
Pierre Koning and Karen van der Wiel. Ranking the schools: How quality information affects school choice in the netherlands. IZA Discussion Papers 4984, Institute for the Study of Labor (IZA), June 2010. URL http://ideas.repec.org/p/iza/izadps/dp4984.html.
David S. Lee and Thomas Lemieux. Regression discontinuity designs in economics. Journal
of Economic Literature, 48(2):281–355, June 2010. URL http://ideas.repec.org/a/aea/
jeclit/v48y2010i2p281-355.html.
Alejandra Mizala and Miguel Urquiola. Parental choice and school markets: The impact of infor-mation approximating school effectiveness. Documentos de Trabajo 239, Centro de Econom´ıa Aplicada, Universidad de Chile, 2009. URLhttp://ideas.repec.org/p/edj/ceauch/239. html.
Alejandra Mizala, Pilar Romaguera, and Miguel Urquiola. Socioeconomic status or noise? tradeoffs in the generation of school quality information. Journal of Development
Eco-nomics, 84(1):61–75, September 2007. URL http://ideas.repec.org/a/eee/deveco/
v84y2007i1p61-75.html.
Figures and Tables
Figure 2: (Frequency of schools)
Figure 4: (2005 ENEM Performance)
Figure 6: (Composition)
Figure 8: (Proficiency 2007)
Figure 10: (Proficiency 2007)
Figure 12: (Proficiency 2007)
Figure 14: (Proficiency 2007)
centering
Figure 16: (False Discontinuity Point)
Figure 17: (False Discontinuity Point)
Table 2: Summary Statistics: Window 10 students - 2005
Less than 10 exam takers At least 10 exam takers
Public Private Public Private
Variable Mean Std. Dev. Mean Std. Dev. Mean Std. Dev. Mean Std. Dev.
ENEM score 30.67 10.91 46.27 14.87 30.03 9.67 49.46 15.33
Correct Age/Grade 0.42 0.50 0.88 0.33 0.50 0.50 0.93 0.26
Age 20.52 3.03 17.76 1.57 19.98 2.93 17.49 1.22
White 0.44 0.50 0.75 0.44 0.41 0.49 0.78 0.41
Father - College Degree 0.02 0.15 0.29 0.45 0.02 0.13 0.40 0.49
Family Income<10 m.s. 0.99 0.09 0.77 0.42 0.98 0.12 0.66 0.47
# ENEM Takers 208 1,102 1,567 2,331
Table 3: Summary Statistics: Window 7 students - 2005
Less than 10 exam takers At least 10 exam takers
Public Private Public Private
Variable Mean Std. Dev. Mean Std. Dev. Mean Std. Dev. Mean Std. Dev.
ENEM score 30.80 10.92 46.49 14.81 30.05 9.79 49.07 15.56
Correct Age/Grade 0.42 0.50 0.89 0.31 0.54 0.50 0.93 0.26
Age 20.53 3.04 17.71 1.48 19.66 2.80 17.49 1.24
White 0.43 0.50 0.75 0.43 0.39 0.49 0.79 0.40
Father - College Degree 0.02 0.16 0.29 0.46 0.01 0.12 0.41 0.49
Family Income<10 m.s. 0.99 0.09 0.76 0.42 0.98 0.12 0.65 0.48
Figure 18: (False Discontinuity Point)
Table 4: 2005 ENEM Performance
10 students window 7 students window 5 students window Private Public Private Public Private Public T reatment -1.349 -1.915 -1.458 -4.406 -1.905 -1.099 (2.658) (2.407) (2.936) (2.887) (3.696) (3.879) F orc.V ariable -0.509 0.585 -0.303 2.661 -0.431 -0.992
(1.177) (1.351) (1.470) (1.876) (2.593) (3.560) F orc. V ar.×T reat. 2.403* -0.303 2.059 -2.237 3.483 1.692
(1.385) (1.424) (1.861) (2.077) (3.293) (3.929) F orc. V ariable2 -0.136 0.081 -0.108 0.401 -0.121 -0.331
(0.130) (0.158) (0.180) (0.269) (0.440) (0.730) F orc. V ar.2×T reat. -0.025 -0.106 -0.038 -0.444 -0.359 0.210
(0.151) (0.163) (0.256) (0.296) (0.665) (0.820) N 3,433 1,775 2,667 1,049 2,027 687
∗p <0.1,∗ ∗p <0.05,∗ ∗ ∗p <0.01
Table 5: Characteristics - 2005
Male Age White
Private Public Private Public Private Public b/se b/se b/se b/se b/se b/se T reatment -0.022 -0.208** -0.073 -0.215 0.063 0.156 (0.081) (0.102) (0.317) (1.679) (0.078) (0.167) F orc.V ariable -0.013 0.158*** 0.158 -0.753 -0.040 -0.018
(0.041) (0.054) (0.168) (0.855) (0.042) (0.087) F orc. V ar.×T reat. 0.011 -0.149** -0.167 0.943 0.058 -0.049
(0.046) (0.057) (0.196) (0.921) (0.045) (0.090) F orc. V ariable2 0.000 0.018*** 0.041* -0.085 -0.006 0.002
(0.005) (0.007) (0.022) (0.090) (0.005) (0.009) F orc. V ar.2×T reat. 0.001 -0.020*** -0.043* 0.077 0.003 0.005
(0.005) (0.007) (0.024) (0.097) (0.005) (0.009) N 2,337 1,290 2,336 1,286 2,326 1,279 Quadratic polynomial
Table 6: Characteristics - 2005
Father - College Correct Age/Grade Month. Fam. Inc. <10 m.s. Private Public Private Public Private Public
b/se b/se b/se b/se b/se b/se
T reatment -0.178* -0.029 0.040 -0.018 0.163 0.017
(0.102) (0.037) (0.062) (0.258) (0.197) (0.030) F orc.V ariable 0.108** 0.002 -0.048 0.111 -0.057 -0.013
(0.047) (0.019) (0.033) (0.129) (0.043) (0.012) F orc. V ar.×T reat. -0.074 0.001 0.056 -0.129 -0.018 0.014
(0.052) (0.019) (0.038) (0.140) (0.052) (0.013) F orc. V ariable2 0.010* -0.000 -0.009** 0.012 -0.004 -0.001
(0.005) (0.002) (0.004) (0.014) (0.005) (0.001) F orc. V ar.2×T reat. -0.013** 0.000 0.009** -0.011 0.011** 0.001
(0.006) (0.002) (0.005) (0.015) (0.006) (0.001) N 2,233 1,157 2,336 1,286 2,281 1,232 Quadratic polynomial
∗p <0.05,∗ ∗p <0.01,∗ ∗ ∗p <0.001
Table 7: Summary statistics - Window: 10 students
Private Public
Treatment Control Treatment Control Variable Mean Std. Dev. Mean Std. Dev. Mean Std. Dev. Mean Std. Dev.
ENEM score 63.98 15.69 60.84 15.91 40.47 12.87 40.45 13.33
Male 0.46 0.5 0.45 0.5 0.37 0.48 0.33 0.47
White 0.76 0.43 0.75 0.43 0.41 0.49 0.35 0.48
Age 17.43 0.91 17.54 1.23 19.62 2.88 20.7 2.98
Correct Age/Grade 0.95 0.22 0.91 0.28 0.57 0.5 0.39 0.49
Father - College Degree 0.42 0.49 0.37 0.48 0.03 0.16 0.02 0.14
Family Inc.<10m.s. 0.64 0.48 0.68 0.47 0.99 0.08 0.99 0.11
% ENEM takers 0.84 0.18 0.76 0.21 0.51 0.23 0.48 0.2
# ENEM Takers 2,210 1,409 2,322 518
# Schools 160 148 97 29
Table 8: Summary statistics - Window: 7 students
Private Public
Treatment Control Treatment Control Variable Mean Std. Dev. Mean Std. Dev. Mean Std. Dev. Mean Std. Dev.
ENEM score 63.62 15.64 61.44 15.74 40.62 12.62 39.95 12.95
Male 0.45 0.5 0.45 0.5 0.36 0.48 0.33 0.47
White 0.75 0.43 0.75 0.43 0.42 0.49 0.35 0.48
Age 17.42 0.91 17.43 0.92 19.44 2.81 20.87 2.96
Correct Age/Grade 0.94 0.23 0.93 0.25 0.6 0.49 0.37 0.48
Father - College Degree 0.42 0.49 0.38 0.49 0.02 0.14 0.02 0.14
Family Income<10m.s. 0.65 0.48 0.67 0.47 0.99 0.07 0.99 0.09
% ENEM takers - 3rd graders 0.82 0.19 0.77 0.22 0.55 0.23 0.49 0.21
# ENEM Takers 1,462 1,209 1,330 481
Table 9: Summary statistics - Window: 5 students
Private Public
Treatment Control Treatment Control Variable Mean Std. Dev. Mean Std. Dev. Mean Std. Dev. Mean Std. Dev.
ENEM score 63.70 15.42 61.64 15.73 41.08 12.57 40.13 12.84
Male 0.46 0.5 0.46 0.5 0.38 0.49 0.35 0.48
White 0.74 0.44 0.75 0.44 0.42 0.49 0.33 0.47
Age 17.42 0.94 17.41 0.83 19.56 2.88 21.2 2.98
Correct Age/Grade 0.94 0.23 0.93 0.25 0.58 0.49 0.33 0.47
Father - College Degree 0.39 0.49 0.38 0.49 0.02 0.14 0.01 0.12
Family Income<10m.s. 0.69 0.46 0.68 0.47 0.99 0.06 0.99 0.09
% ENEM takers - 3rd graders 0.84 0.18 0.78 0.21 0.54 0.21 0.50 0.25
# ENEM Takers 1,154 978 882 268
Number of Schools 106 84 39 16
Table 10: Composition Effects
# enrollment - 3rd Grade % of ENEM takers Private Public Private Public
b/se b/se b/se b/se
T reatment 3.765 8.940 -0.037 0.438***
(7.057) (20.437) (0.088) (0.108) F orc.V ariable -2.886 3.936 0.027 -0.096**
(3.609) (7.553) (0.037) (0.043) F orc. V ar.×T reat. 8.354 -0.425 -0.019 0.045
(6.269) (13.070) (0.045) (0.058) F orc. V ariable2 -0.289 0.486 0.002 -0.008* (0.305) (0.849) (0.004) (0.004) F orc. V ar.2×T reat. -0.212 -0.577 -0.002 0.011*
(0.661) (1.660) (0.005) (0.006)
N 3,452 1,947 2,525 1,822
Table 11: Composition Effects
Male Age White
Private Public Private Public Private Public T reatment 0.022 -0.010 -0.592 -1.165 -0.002 0.080
(0.065) (0.054) (0.399) (1.661) (0.058) (0.061) F orc.V ariable -0.010 0.043* 0.400 -0.042 0.007 0.006
(0.029) (0.024) (0.271) (0.746) (0.024) (0.036) F orc. V ariable×T reat. -0.001 -0.062** -0.362 -0.354 -0.015 -0.002
(0.033) (0.029) (0.277) (0.808) (0.036) (0.040) F orc. V ar.2 -0.002 0.004 0.055 -0.034 0.000 0.002
(0.003) (0.003) (0.036) (0.075) (0.003) (0.004) F orc. V ar.2×T reat. 0.003 -0.002 -0.059 0.076 0.001 -0.002
(0.003) (0.003) (0.037) (0.081) (0.004) (0.005) N 3,404 2,538 3,386 2,512 3,376 2,510
∗p <0.1,∗ ∗p <0.05,∗ ∗ ∗p <0.01
Table 12: Composition Effects
Father - College Correct Age/Grade Mon. Fam. Inc. <10 m.s. Private Public Private Public Private Public
T reatment 0.071 -0.014 0.080 0.135 -0.110 0.010
(0.084) (0.022) (0.072) (0.256) (0.101) (0.012) F orc.V ariable -0.041 0.019* -0.060 0.035 0.075* -0.008
(0.036) (0.011) (0.044) (0.117) (0.040) (0.010) F orc. V ar.×T reat. 0.053 -0.019 0.062 0.028 -0.092* 0.006
(0.047) (0.013) (0.045) (0.127) (0.052) (0.010) F orc. V ar.2 -0.006 0.003** -0.008 0.008 0.009** -0.001
(0.004) (0.001) (0.006) (0.012) (0.004) (0.001) F orc. V ar.2×T reat. 0.004 -0.003* 0.008 -0.015 -0.008 0.001
(0.005) (0.001) (0.006) (0.013) (0.005) (0.001) N 3,258 2,225 3,386 2,512 3,334 2,448
Table 13: Channels
Comput. Lab Science. Lab Library Private Public Private Public Private Public T reatment -0.048 -0.138 0.058 -0.442 -0.290 -0.129 (0.224) (0.097) (0.207) (0.359) (0.202) (0.300) N 3,619 2,850 3,619 2,850 3,619 2,850
Number of Comput. Teacher/Stud. Ratio % of Teacher - College Private Public Private Public Private Public T reatment 15.980* -5.661 0.003 0.006 0.013 0.054
(9.150) (4.319) (0.094) (0.035) (0.022) (0.038) N 3,525 2,321 3,467 2,171 3,467 2,171 Quadratic polynomial
∗p <0.1,∗ ∗p <0.05,∗ ∗ ∗p <0.01
Table 14: 2007 ENEM Performance
10 students window 7 students window 5 students window Private Public Private Public Private Public T reatment 2.584** 1.048 3.504*** 2.047 5.520** 3.789* (1.290) (1.069) (1.216) (1.345) (2.572) (2.150) F orc.V ariable -0.431* 0.447** -0.110 -0.069 -0.718 -1.277* (0.224) (0.182) (0.232) (0.249) (0.606) (0.692) F orc. V ar.×T reat. 0.296 -0.395* -0.209 -0.264 0.032 1.206
(0.246) (0.216) (0.316) (0.308) (0.840) (0.764) N 3,619 2,850 2,761 1,811 2,132 1,150
Table 15: 2007 ENEM Performance
10 students window 7 students window 5 students window Private Public Private Public Private Public
b/se b/se b/se b/se b/se b/se T reatment 8.295** 1.573 8.687** 4.068 9.890** 2.305 (3.265) (2.439) (3.758) (2.662) (4.907) (3.228) F orc.V ariable -3.193** 0.655 -3.368* -2.330* -5.157 0.233
(1.420) (1.129) (1.865) (1.355) (3.228) (2.270) F orc. V ar.×T reat. 2.526 -1.229 2.621 2.875* 6.050 -0.081
(1.655) (1.198) (2.333) (1.543) (3.930) (2.555) F orc. V ariable2 -0.393** 0.119 -0.419* -0.286* -0.744 0.323
(0.155) (0.116) (0.225) (0.154) (0.498) (0.418) F orc. V ar.2×T reat. 0.471*** -0.072 0.492 0.148 0.371 -0.375
(0.180) (0.125) (0.326) (0.190) (0.725) (0.497) N 3,619 2,850 2,761 1,811 2,132 1,150
∗p <0.1,∗ ∗p <0.05,∗ ∗ ∗p <0.01
Table 16: 2007 ENEM Performance - With Controls
10 students window 7 students window 5 students window Private Public Private Public Private Public T reatment 5.309* -1.787 6.807** -0.466 9.702** -3.093 (2.702) (3.453) (3.200) (4.248) (4.092) (5.423) F orc.V ariable -1.344 1.301 -2.997* 0.611 -5.515** 3.017
(1.048) (1.418) (1.559) (2.171) (2.684) (4.138) F orc. V ar.×T reat. 0.548 -2.279 3.443* -2.189 5.786* -4.038
(1.248) (1.534) (1.938) (2.562) (3.389) (4.656) F orc. V ariable2 -0.148 0.122 -0.375* 0.027 -0.812* 0.530
(0.104) (0.132) (0.191) (0.257) (0.439) (0.846) F orc. V ar.2×T reat. 0.228* -0.036 0.208 0.149 0.701 -0.484
(0.124) (0.146) (0.254) (0.336) (0.611) (0.974) N 3,137 2,082 2,393 1,311 1,845 837 Quadratic polynomial
Controls: age, white, male, father has college, family income>10m.s.
Table 17: Robustness - Jumps at Non-discontinuity Points 10 students window 7 students window 5 students window
20 Students Cutoff
Private Public Private Public Private Public T reatment -2.160 1.039 0.184 -0.407 0.743 -0.516 (2.807) (1.598) (3.476) (2.070) (4.900) (2.426) N 4,508 4,992 3,226 3,581 2,287 2,562
15 Students Cutoff
Private Public Private Public Private Public T reatment 1.598 -0.981 3.943 0.191 4.110 0.111
(3.080) (1.725) (3.568) (2.070) (4.619) (2.350) N 4,419 3,614 3,150 2,606 2,210 2,152
7 Students Cutoff
– – Private Public Private Public
T reatment – – -0.463 -4.196 0.144 1.524
– – (4.140) (2.735) (4.625) (3.408) N – – 2,275 1,144 1,821 767 Quadratic polynomial
∗p <0.1,∗ ∗p <0.05,∗ ∗ ∗p <0.01
Table 18: Controlling for Channels - Depen. Variab. - ENEM Scores Comput. Lab Science. Lab Library Private Public Private Public Private Public T reatment 8.278** 1.633 8.267** 2.288 7.749** 1.567
(3.269) (2.446) (3.256) (2.369) (3.228) (2.441) N 3,619 2,850 3,619 2,850 3,619 2,850
Number of Comput. Teacher/Stud. Ratio % of Teacher - College Private Public Private Public Private Public T reatment 8.208** -1.678 7.526** 3.085 7.526** 3.085
(3.320) (3.670) (3.273) (2.950) (3.273) (2.950) N 3,525 2,321 3,467 2,171 3,467 2,171 Quadratic polynomial