FACULDADE DE CIÊNCIAS
DEPARTAMENTO DE BIOLOGIA ANIMAL
SPECIATION IN SPATIALLY STRUCTURED
POPULATIONS: IDENTIFYING GENES RESPONSIBLE FOR
LOCAL ADAPTATION
Vera Lúcia Martins Nunes
DOUTORAMENTO EM BIOLOGIA
(B
IOLOGIA
E
VOLUTIVA
)
FACULDADE DE CIÊNCIAS
DEPARTAMENTO DE BIOLOGIA ANIMAL
SPECIATION IN SPATIALLY STRUCTURED
POPULATIONS: IDENTIFYING GENES RESPONSIBLE FOR
LOCAL ADAPTATION
Vera Lúcia Martins Nunes
Tese orientada por:
Professor Doutor Octávio S. Paulo
Professor Doutor Mark A. Beaumont
Professor Doutor Roger K. Butlin
DOUTORAMENTO EM BIOLOGIA
(BIOLOGIA EVOLUTIVA)
This study was supported by Fundação para a Ciência e a Tecnologia (FCT) through a PhD scholarship (SFRH/BD/21306/2005) attributed to Vera L. Nunes and two research projects: POCI/BIA/59288/2004 -“Process of speciation: accessing the genic view” and POCTI/BSE/47999/2002 -“Coalescent methods applied to populations’ analyses with microsatellites”.
Para a elaboração da presente dissertação, e nos termos do Nº 1 do Artigo 40 do Regulamento de Estudos Pós-Graduados da Universidade de Lisboa, publicado no
Diário da República nº 209 - II Série, de 30 de Outubro de 2006, foram usados
integralmente artigos científicos publicados ou a submeter para publicação em revistas internacionais indexadas. Tendo os trabalhos referidos sido efectuados em colaboração, a autora da dissertação esclarece que participou integralmente na concepção e execução do trabalho experimental, na análise e interpretação dos resultados e na redacção de todos os manuscritos.
À memória da minha mãe
To the memory of my mother
ACKNOWLEDGEMENTS | AGRADECIMENTOS xi
RESUMO xiii
ABSTRACT xvii
CHAPTER 1 – General Introduction 1
1.1 – Speciation 3
1.2 – Detection of genes under selection 5
1.2.1 – QTL mapping 6
1.2.2 – Genome scans 7
1.2.3 – Transcriptome analysis 9
1.2.4 – Candidate genes 9
1.2.5 – Next generation sequencing 10
1.2.6 – Validation of candidate loci 12
1.3 – Lizards as models for selection and adaptation 13
1.3.1 – Lacerta lepida 13
1.3.1.1 – Variation in morphology 17
1.3.1.2 – Variation in reproductive strategy 20
1.3.1.3 – Genetic variation 21
1.4 – Objectives and thesis structure 24 1.5 – References 25 CHAPTER 2 – Multiple approaches to detect outliers in a genome scan for selection in ocellated lizards (Lacerta lepida) along an environmental gradient 37 CHAPTER 2 – Supporting information 53 CHAPTER 3 – Challenges and pitfalls in the isolation and characterization of anonymous AFLP markers in non-model species: lessons from an ocellated lizard genome scan 57 CHAPTER 3 – Supporting information 87
CHAPTER 4 – Association of Mc1r variants with ecologically relevant phenotypes in the European ocellated lizard, Lacerta
lepida
93
CHAPTER 4 – Supporting information
105 CHAPTER 5 – Analysis of neutral versus non-neutral nuclear loci
provides evidence for incipient ecological speciation within European ocellated lizards, Lacerta lepida
109
CHAPTER 5 – Supporting information
137
CHAPTER 6 – General Discussion 145
6.1 – General discussion 147
6.2 – Concluding Remarks 159
6.3 – Future directions 161
6.4 – References 163
NOTE:
The varying format of some chapters in this thesis reflects the specific requirements of the scientific publications to which the presented manuscripts were submitted.
At the end of this long project, I would like to express my sincere gratitude to all those who have contributed to the fulfillment of this dissertation:
No final deste longo projecto, gostaria de expressar o meu sincero agradecimento a todos aqueles que contribuiram para a realização desta dissertação:
Ao Professor Octávio S. Paulo, por me ter proposto este projecto de doutoramento aliciante e me ter contagiado com o seu entusiasmo pela Biologia Evolutiva e pelos lagartos. Agradeço ainda a sua confiança nas minhas capacidades, as oportunidades de formação que me proporcionou ao envolver-me em vários projectos de investigação e a sua compreensão e o encorajamento perante os muitos desafios colocados por este projecto.
To Professor Roger K. Butlin and to Professor Mark A. Beaumont, for kindly accepted to co-supervise this thesis, for believing in the potential of this research project and for contributing with their expertise to the success of this project outcome. Thank you so much for your encouragement throughout these years and for your patience to attend all my doubts and to comment the many drafts of my manuscripts.
A todos os colegas com quem partilhei o laboratório, pela companhia, pela troca de experiências e pela entreajuda na resolução dos problemas recorrentes nas rotinas laboratoriais.
À Andreia Miraldo e à Inês Simões, por me transmitirem os seus conhecimentos nos meus primeiros meses no laboratório.
Um agradecimento muito especial a todos os que pertencem ou pertenceram ao grupo CoBiG2, pelas amizade e boa disposição, pela partilha de conhecimentos e pelo encorajamento. Um grande obrigado aos “cobigos” que me auxiliaram na revisão dos
manuscritos e no domínio de ferramentas informáticas: Francisco Pina-Martins, Sofia Seabra, Eduardo Marabuto, Joana Costa, Diogo Silva, Sara Silva e Renata Martins. Ao Pedro Moreira, à Paula Simões e à Dora Batista, por me proporcionarem a oportunidade de participar activamente nos seus projectos de investigação em paralelo com o meu projecto de doutoramento, permitindo alargar a minha experiência a outras técnicas e modelos de estudo no âmbito da Biologia Evolutiva.
À família e amigos, que acompanharam este processo muitas vezes à distância. A todos agradeço o apoio e a “torcida” para que este projecto chegasse a bom porto. Agradeço em especial ao meu pai e à minha irmã, por representarem um modelo de coragem e persistência na minha vida, fundamental para superar as provas mais duras deste projecto. Agradeço ao Hugo, que me acompanhou de perto em todos os altos e baixos desta caminhada. Agradeço ainda ao meu pequeno sobrinho, pela alegria e brincadeiras que preencheram as minhas visitas à “terrinha”, e ao Quim e à Zé, sempre incansáveis, transportando “mimos” culinários entre Alcobaça e Lisboa.
RESUMO
A determinação da base genética de caracteres adaptativos em populações naturais é fundamental para melhor compreender a evolução da divergência adaptativa entre populações em ambientes heterogéneos e a forma como estas podem evoluir para formar novas espécies. O presente trabalho teve como principal objectivo a identificação de genes ou regiões genómicas envolvidas na adaptação local em populações espacialmente estruturadas, mas na ausência de barreiras físicas evidentes ao fluxo genético entre elas. O lagarto ocelado (ou sardão), Lacerta lepida, foi o modelo escolhido para este estudo, tendo sido analisadas populações ao longo de um gradiente ambiental na Península Ibérica, que é sobretudo condicionado pela variação climática. Duas subespécies de sardão são actualmente reconhecidas nos extremos opostos do gradiente ambiental, tendo por base a existência de diferenças morfológicas significativas, que sugerem a sua adaptação às condições ambientais locais. A subespécie L. l. iberica encontra-se restringida ao Noroeste da Península Ibérica, enquanto que a subespécie L. l. nevadensis substitui a subespécie nominal no Sudeste da área de distribuição da espécie.
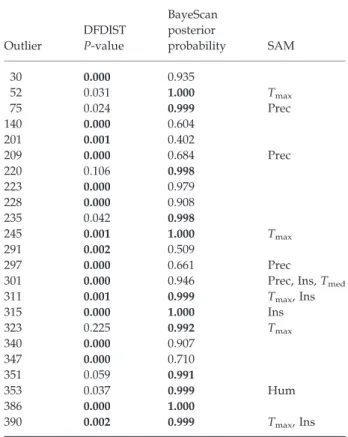
Como primeira abordagem para a detecção de regiões do genoma sob acção da selecção, foi realizado um genome scan com AFLPs. Esta estratégia permite gerar centenas de marcadores genéticos em qualquer organismo, distribuídos pelo genoma, sem que para tal seja necessário ter conhecimento genético prévio da espécie, sendo por isso muito útil para espécies não-modelo, como o sardão, com poucos recursos genómicos disponíveis. A identificação de loci candidatos foi feita mediante a detecção de outliers, isto é, de marcadores de AFLP com níveis de diferenciação entre populações anormalmente elevados (selecção direccional) ou reduzidos (selecção balanceada) de acordo com o expectável num cenário de neutralidade. Foram utilizados dois métodos de detecção, um método frequencista e um método Bayesiano, e embora ambos tenham detectado um proporção semelhante de outliers (3-4%), apenas alguns dos outlieres foram detectados por ambos, denotando diferenças na sensibilidade dos dois métodos. Vários dos AFLPs detectados como outliers foram também associados com a variação na temperatura, na insolação ou na precipitação registadas ao longo do gradiente, sugerindo que estas variáveis poderão ser importantes forças selectivas ao nível da adaptação local do sardão.
Devido à susceptibilidade dos métodos de detecção de outliers aos erros de tipo I (falsos-positivos), que embora podendo ser controlados, dificilmente poderão ser totalmente eliminados, os outliers deverão ser tratados como loci candidatos, potencialmente influenciados pela selecção, que deverão ser posteriormente validados por outros meios. Como os AFLPs são marcadores gerados a partir da fragmentação do genoma pela acção de enzimas de restrição, tratam-se de marcadores com localização desconhecida no genoma e a sequência de DNA que constitui cada fragmento permanece completamente anónima durante todo o processo de genotipagem, sendo estes distinguidos apenas pelas diferenças de tamanho e genotipados como marcadores dominantes. Assim sendo, é muito importante que depois de indentificar os AFLPs com comportamento outlier, estes sejam investigados por forma a indentificar as sequências que os constituem e determinar a que genes poderão pertencer e quais as suas possíveis funções.
O isolamento de AFLPs com tamanho específico de entre dezenas de outros fragmentos com tamanho semelhante é tecnicamente exigente. Sete outliers foram isolados, clonados e sequenciados com sucesso, mas nenhum deles parece fazer parte de uma região codificante, sendo o polimorfismo de tamanho dos fragmentos explicado pela presença de indels ou elementos repetitivos (microssatélites). Para cada outlier sequenciado foram desenhados primers internos de forma a converter estes loci em marcadores codominantes e poder amplificá-los a partir do genoma não digerido. Devido ao reduzido tamanho dos fragmentos, apenas para três dos sete outliers sequenciados (mk75, mk209 e mk245) foi possível desenvolver primers capazes de amplificar tanto os alelos dominantes como os alelos recessivos. Para o locus mk75, um outlier associado à variação na precipitação, foram detectados um haplótipo dominante conservado, com uma deleção de nove pares de bases, e oito haplótipos recessivos. A frequência do alelo dominante é superior em L. l. iberica enquanto que em L. l. nevadensis ele se encontra ausente. O locus mk209, também associado com a precipitação, apresentou dois haplótipos dominantes, caracterizados pela inserção de quatro bases (TGGA), e sete haplótipos recessivos. Todas os indivíduos de L. l. nevadensis sequenciados para o locus
mk209 apresentaram apenas haplótipos dominantes, enquanto que estes estão ausentes em
todas as amostras sequenciadas para as restantes subespécies. Relativamente ao locus
mk245, detectado em forte associação com a variação nas temperaturas máximas ao longo
um microssatélite com seis repetições de GTT, e oito haplótipos recessivos com três a cinco repetições de GTT. O haplótipo dominante não foi encontrado nos indivíduos de L.
l. iberica nem de L. l. nevadensis, sendo que ambas as subespécies apresentaram apenas
sequências com três repetições de GTT, embora estas se encontrem em extremos opostos do gradiente de temperatura. Os outliers mk75, mk209 e mk245 foram ainda amplificados e sequenciados com sucesso em espécies próximas (Lacerta tangitana, L. pater, L.
schreibei, L. agilis e Iberolacerta monticola), evidenciando que apesar da variação de
tamanho nos elementos repetitivos, as zonas que os flanqueiam permanecem bastante conservadas entre espécies. Tratando-se de regiões não codificantes, os outliers sequenciados para o lagarto ocelado poderão actuar como elementos reguladores da actividade de alguns genes ou poderão estar em desequilíbrio de linkage com outros genes que serão o verdadeiro alvo de selecção. Em qualquer dos casos, serão necessários mais recursos genómicos para compreender o papel destes outliers na evolução do lagarto ocelado.
A análise de genes candidatos, com efeitos conhecidos nas características fenotípicas de outras espécies, pode constituir uma alternativa ao genome scan para a identificação de genes importantes na adaptação local do lagarto ocelado. A coloração dorsal constitui uma das características morfológicas que varia substancialmente entre as subespécies de L. lepida, tendo possíveis consequências adaptativas ao nível da camuflagem ou da eficiência da termorregulação. O receptor da melanocortina 1 (Mc1r) é um gene envolvido na síntese de melanina e, como tal, constitui um importante candidato para a variação na proporção de escamas pretas ou castanhas entre os lagartos ocelados. A análise do Mc1r em L. lepida revelou uma susbtituição derivada e não conservativa na cadeia de aminoácidos (T162I), que se encontra associada com a coloração acastanhada de L. l. nevadensis, sugerindo que a mutação poderá conduzir a uma perda parcial da função do gene. Uma segunda substituição (S172C) foi detectada em associação com a prevalência de escamas pretas em L. l. lepida e em L. l. iberica. No entanto, não foi detectada qualquer mutação no gene Mc1r associada com a maior proporção de escamas pretas em L. l. iberica, implicando que tal differença se deva a mutações regulatórias que afectem a expressão do gene Mc1r ou a mutações noutros genes envolvidos na pigmentação. Os resultados da análise do gene Mc1r no lagarto ocelado constituem a primeira contribuição para a determinação da base genética da variação na coloração desta espécie e serão úteis no delineamento da investigação futura. As consequências
funcionais das mutações detectadas neste estudo deverão ser testadas com ensaios in vitro de forma a confirmar a sua associação com os fenótipos de cor do sardão.
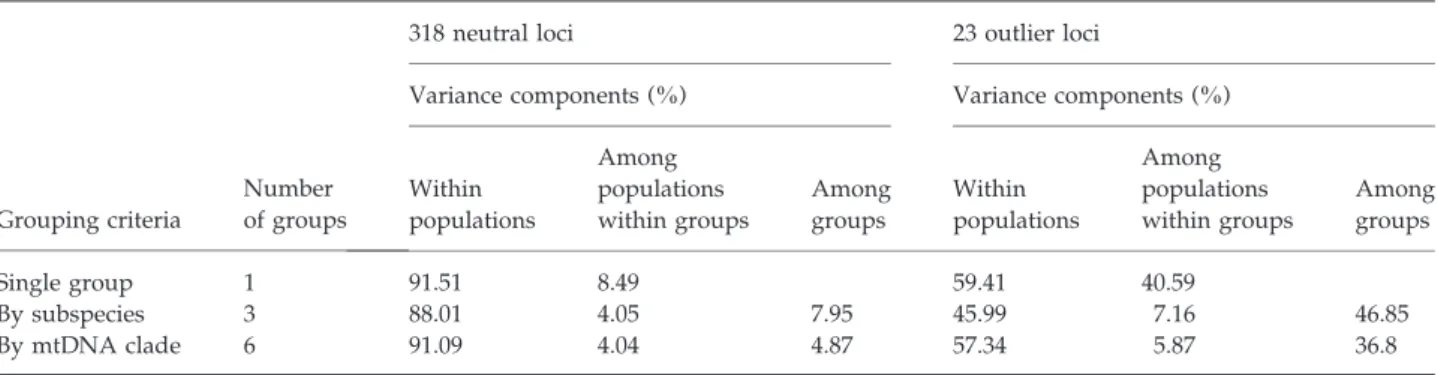
Os dados obtidos neste estudo para o lagarto ocelado a partir de um grande número de marcadores nucleares confirmam a previsão inicial de que a evolução da espécie é congruente com a perspectiva génica do processo de especiação, encontrando-se cada subspécie em differentes estádios de divergência. A análise da estrutura genética do lagarto ocelado foi realizada com base em 318 marcadores neutrais de AFLPs, 23 marcadores não-neutrais de AFLPs (ambos gerados pelo genome scan) e em oito microssatélites. A divergência de L. l. nevadensis é bem suportada tanto pelos marcadores neutrais como pelos não-neutrais, confirmando que a subespécie se encontra nos estádios finais do processo de especiação. Por outro lado, a divergência de L. l. iberica é sobretudo explicada pelos marcadores não-neutrais, enquanto que a homogeneidade genética ao nível dos marcadores neutrais implica a ocorrência generalizada de fluxo genético, sugerindo que a subespécie se encontra nos estádios iniciais da especiação ecológica, quando o processo de divergência é ainda reversível. Relativamente à subspécie nominal, e embora estudos anteriores tenham detectado vários clades mitocondriais na área geográfica de L. l. lepida, estes não são totalmente suportados pelos marcadores nucleares analisados neste estudo. A incongruência entre os marcadores mitocondriais e nucleares pode ser justificada pela recente divergência dos referidos clades e por incomplete lineage
sorting ao nível dos marcadores nucleares, embora a ocorrência de fluxo genético nas
zonas de contacto entre os clades também possa contribuir para a homogeneização da variação genética entre as populações de L. l. lepida.
Palavras-chave: gradiente ambiental, genome scan, adaptação local, especiação, genes
The determination of the genetic basis of adaptive traits in natural populations is fundamental to better understand how populations adaptively diverge in heterogeneous environments and eventually give rise to new species. This work describes the efforts to identify candidate loci influenced by selection in ocellated lizards (Lacerta lepida) along an environmental gradient in the Iberian Peninsula, strongly affected by climatic variables. Two subspecies are recognized at the opposite extremes of the gradient, L. l.
iberica in the northwest and L. l. nevadensis in the southeast, with morphological
differences that suggest their local adaptation. Candidate loci were detected through an AFLP genome scan. Detection of candidate loci with a frequentist method and with Bayesian method resulted in a similar proportion of outliers (3-4%), but only a few loci were detected by both methods, denoting differences in methods’ sensitivity. Several outliers were associated with variation in temperature, insolation or precipitation along the gradient, suggesting the importance of these variables as selective pressures for local adaptation. Seven outliers were successfully characterized, being noncoding, with internal indels or repetitive elements as causes of length polymorphism, indicating that they might act as regulatory elements or are in linkage with the actual target of selection. The analysis of Mc1r, a candidate gene for coloration, revealed a nonconserved and derived substitution (T162I) associated with the brownish colour phenotype of L. l. nevadensis, suggesting a putative partial loss of function. Another substitution (S172C) was associated with the presence of black scales in both L. l. lepida and L. l. iberica, but no mutations were associated with the higher melanization of L. l. iberica. Analysis of genetic structure showed that L. l. nevadensis divergence is well supported by both neutral and non-neutral loci, confirming that the subspecies is at the final stages of its speciation process. L. l. iberica divergence from the nominal subspecies is mostly explained by a few adaptive loci, indicating that L. l. iberica might be at the early stages of ecological speciation.
Keywords: candidate genes, environmental gradient, genome scan, local adaptation,
CHAPTER 1
GENERAL INTRODUCTION
1.1 – Speciation
The revolutionary idea that new species could arise from pre-existing ones by natural selection, proposed originally by Darwin and Wallace (1858), and later in Darwin’s “On the Origin of Species” (1859), led to the emergence of the field of evolutionary biology. The following decades brought important developments in the understanding of genetics and heredity, but also extensive debate and controversy on the species concept and speciation mechanisms driving to the emergence of new species. Evolutionary biologists could not find to date a consensual and universal species concept (Coyne & Orr 2004). The biological species concept (Mayr 1942, 1995) describes a species as a group of interbreeding natural populations which are reproductively isolated from other such groups, and still remains the most widely accepted species concept. As a consequence, and because gene flow normally prevents divergence among populations and therefore the evolution of reproductive isolation, geographical isolation was thought to be an important barrier to trigger speciation, imposing a complete (allopatric speciation) or partial (parapatric speciation) absence of gene flow, whereas speciation in the presence of gene flow (sympatric speciation) was considered an extremely rare mode of speciation (Coyne & Orr 2004).
As the knowledge in molecular biology progressed, the rise of the neutral theory of molecular evolution reduced the importance of natural selection as a trigger for speciation (Coyne & Orr 2004), claiming that most mutations had a neutral or nearly neutral selective effect and were fixed by random drift (Kimura 1983). However, the past decade brought a renewed interest in speciation mechanisms driven by natural selection, assuming that divergence in nonallopatry is not a rare event (Via 2001; Dieckmann et al. 2004; Nosil 2008; Wolf et al. 2010). Wu (2001) introduced a new perspective for the evolution of divergence at the genomic level by proposing the genic view of the speciation process. According to this perspective, speciation can occur among differently adapted populations in the absence of complete reproductive isolation. In the early stages of speciation, populations will diverge at a few loci that are locally advantageous, whereas divergence in non-adaptive regions of the genome will be prevented by
homogenizing gene flow. At this point, divergence between incipient species can still be reversed if perturbations in the habitat occur that facilitate massive hybridization (Wu 2001). However, if the accumulation of divergence extends to genes that promote non random mating or if hybrids have lower fitness, the reproductive isolation will evolve as a by-product of adaptive divergence and the diverging groups will became new species (Wu 2001, Nosil et al. 2009; Via 2009).
Speciation is a process that normally takes a long time, during which the spatial circumstances might change, i.e. initial differentiation can take place in allopatry but reinforcement in latter stages can occur in parapatry (Butlin et al. 2008). Therefore, current research in speciation is focused on the driving forces that trigger the evolution of divergence and reproductive isolation among emerging species rather than in the geographical modes of speciation (Via 2001; Dieckmann et al. 2004).
Among animals, three main driving forces for speciation are currently recognized by evolutionary biologists: drift (or chance), natural selection and sexual selection (Butlin
et al. 2008). Genetic drift corresponds to the change in allelic frequencies by chance and
not by their adaptive value. Speciation under such circumstances must take place in allopatry to counteract the homogenizing effect of gene flow, and because reproductive isolation evolves under neutral conditions, it takes a long time under geographical isolation to achieve complete reproductive isolation between the new species (Sobel et al. 2010). According to the scarce empirical evidence collected to date, speciation events caused by drift alone are likely to be rare (Coyne & Orr 2004; Sobel et al. 2010). In some cases, new species might arise by chance from hybridization events between older species, resulting in the duplication of the genome (allopolyploidy) or in the recombination between genomes of parent species with the maintenance of a diploid genome (homoploid hybridization) (Mallet 2007). The new hybrid species becomes reproductively isolated from parent species due to genomic incompatibilities. This process has been frequently reported in plants but is has been rarely detected in animals (Mallet 2007).
A significant role for sexual selection in speciation has been detected in several birds, insects and fishes. Sexual selection results from assortative mating due to male-male competition or to sex-specific preference over morphological (e.g. colour, sexual ornaments) or behavioral traits (e.g. calling songs, nuptial parade) on the opposite sex, thus promoting premating isolation. The cichlid fish radiation has been a classic example for speciation in sympatry by sexual selection, yet, some authors argue that sexual
selection might have acted alongside ecological speciation in cichlids and that empirical evidence suggest that it is unlikely that sexual selection may often act alone in the formation of new species (Ritchie 2007).
Ecological speciation occurs when adaptive traits are favoured by natural selection, contributing to the evolution of barriers to gene flow between populations living in different ecological conditions, as a response to biotic and abiotic factors such as climate, resources, habitat structure, competition, predation or pathogens (Schluter 2001; Rundle & Nosil 2005). The action of divergent natural selection between environments leads to the fixation of alleles that are advantageous in one environment but not in the other (Schluter 2009). Ecological speciation might occur either in sympatry or in allopatry. When ecological divergence evolves in allopatry, a secondary contact zone can be later established if divergent populations become sympatric through dispersal or range shifts (Schluter 2001; Rundle & Nosil 2005). In a parapatric scenario, adaptive divergence can evolve along an environmental gradient, where an ancestral population gives rise to phenotypically distinct descendant species that are locally adapted and spatially segregated along the gradient, resulting in a stepped phenotypic cline (Doebeli & Dieckmann 2004).
Schulter (2001, 2009) suggests another way of speciation by natural selection besides ecological speciation, the mutation-order speciation, although few empirical examples support this speciation mode so far. Under mutation-order speciation, populations become divergent under similar natural selection pressures because different mutations arise by chance in each population and reach fixation through natural selection, even though they might be advantageous in both environments.
The evolution of reproductive isolation between emerging species might often involve a combination of both selection and stochastic forces, regardless of the mechanism that triggered the initial steps of population divergence (drift, natural selection or sexual selection) (van Doorn et al. 2009; Sobel et al. 2010).
1.2 – Detection of genes under selection
The identification and characterization of genes under selection is essential to understand the genetic mechanisms underlying the evolution of adaptive phenotypic
divergence, reproductive isolation and the formation of new species. Gathering empirical evidence for the genetic basis of adaptive traits from many taxa will make possible to address several unanswered questions, which have been much debated, through comparative genomics. For instance, how often evolution of adaptive traits results from a few genes of large effect or from many genes of small effect (Orr 2001)? What is the relative role of structural (i.e. in coding regions) versus regulatory mutations (i.e. mutations in regulatory regions affecting gene expression) in adaptive evolution (Stern & Orgogozo 2008)? Do adaptive alleles emerge from standing genetic variation or as new mutations (Barrett & Schluter 2007)? Does phenotypic convergence (i.e. the independent evolution in the same environment of the same phenotypic trait in different taxa) arise from convergence at the genetic level (Manceau et al. 2010)? How predictable is genetic evolution (Gompel & Prud’homme 2009)?
Several approaches have been used in a variety of organisms to detect genetic targets of selection and to investigate genomic regions or specific genes with implications on adaptation to the environment or involved in sexual selection. The identification of genes under selection is particularly challenging in non-model species (i.e. species with limited genomic resources). In the last decade, much progress has been made in the development of molecular tools, which have been applied to wild populations from a growing number of non-model species, offering the opportunity to investigate speciation mechanisms in natural ecological backgrounds where species are evolving. The following sections will detail some of the molecular tools and genomic approaches which have been successfully applied in non-model species.
1.2.1 – QTL mapping
Quantitative trait locus (QTL) mapping, also termed as linkage mapping, consists in the identification of chromosomal regions that underlie phenotypic variation. QTL mapping has been traditionally used in model species and requires the crossing of individuals with distinct phenotypes to follow the inheritance of segregating traits in a large progeny (Ellegren & Sheldon 2008). Individuals must be scored for phenotypic traits of interest and genotyped for many genetic markers across the genome in order to detect genetic markers that co-segregate with phenotypic traits. Thus, the demanding need
for genetic markers requires a wealthy amount of genomic resources, a condition that is not met by most non-model species. QTL mapping is feasible in non-model species as long as individuals from natural populations can be bred and selected for divergent phenotypes under controlled conditions (Ellegren & Sheldon 2008). QTL mapping studies for the parallel armour plate reduction in threespine stickleback (Colisimo et al. 2004), the wing colour pattern in butterfly Heliconius erato (Tobler et al. 2005) or for albinism in cavefish Astyanax mexicanus (Protas et al. 2006) provide some recent examples. However, some authors propose that QTL mapping without controlled breeding can be performed in species with long-term studies, that provide accurate pedigree information from free-living wild populations, along with detailed phenotypic and genotypic records (Beraldi et al. 2007; Slate et al. 2010). Nevertheless, chromosomal regions identified by QTL mapping are often large and potentially contain several genes. Further fine-scale linkage mapping is required to refine the search and narrow down the number of candidate loci affecting the phenotypic trait of interest (e.g. Colisimo et al. 2005; Ferguson et al. 2010).
1.2.2 – Genome scans
Genome scans are a commonly used tool in population genomics that consist in the comparison of relative levels of differentiation between populations based in a large number of unlinked genomic markers (Storz 2005). This strategy does not require the prior identification of candidate genes or the definition of relevant phenotypic traits and is instead a useful approach to identify candidate genes under selection. The detection of selection footprints through genome scans relies on the assumption that neutral loci across the genome will be similarly affected by demographic and historical effects (bottlenecks, population expansion, migration), while loci under selection will behave differently, exhibiting unusually higher (divergent selection) or lower (balancing selection) divergence between populations (Luikart et al. 2003). Loci exhibiting outlier behavior are therefore considered as candidate loci potentially under selection and can be selected for follow-up studies in order to confirm such assumptions and understand how they affect phenotypes and fitness or which selection forces are acting over them (Vasemägi & Primmer 2005).
Genome scans usually rely in molecular markers such as microsatellites (e.g. Mäkinen et al. 2008), single nucleotide polymorphisms (SNPs) (e.g. Namroud et al. 2008) or amplified fragment length polymorphisms (AFLPs) (e.g. Bonin et al. 2006). The development of a high number of microsatellites or SNPs is normally expensive and time consuming. AFLPs are probably the type of markers that can be most rapidly and cost effectively developed for any non-model species (Bench & Akesson 2005). The technique consists in the fragmentation of the genomic DNA in thousands of small fragments with two different restriction enzymes, normally by combining a rare cutter, like EcoRI, with a frequent cutter such as MseI (Vos et al. 1995; Bonin et al. 2005). The following step of the method involves the attachment of adapters (short oligonucleotides) to the sticky ends of digested fragments. The sequence content and length of digested fragments beyond the restriction site of the enzymes is unknown. Moreover, a random number of fragments result from digestion in both ends by the same enzyme while other fragments result from the digestion of both enzymes (one at each end). The latter are the fragments for which the AFLP technique was designed to amplify and genotype (Vos et al. 1995). In order to achieve the amplification of these fragments, the polymerase chain reaction (PCR) is first performed with preselective primers, one specific for each enzyme’s cutting end, whose sequence is complementary to the adaptors and to the enzyme restriction site, plus a selective base. This step will greatly reduce the amount of fragments to genotype because only fragments containing the selective base will be amplified, thus reducing the complexity of the analysis. A second selective PCR is then performed using the product of the first PCR with primers that are equal to the preselective ones plus one to three additional selective bases. Multiple sets of polymorphic AFLP markers can be generated for the same individual by conducting several selective PCRs with primers bearing different combinations of selective bases (Bench & Akesson 2005; Bonin et al. 2005). Unlike microsatellites and SNPs, which are multiallelic and codominant markers, AFLPs are normally scored as dominant biallelic markers due to the anonymity of the sequence content. Thus, the follow-up studies with AFLP outliers require the isolation and sequencing of outlier AFLP fragments, which is technically demanding and particularly challenging in non-model species (Wood et al. 2008).
1.2.3 – Transcriptome analysis
Genome-wide variation in gene expression among natural populations with divergent phenotypes can be assessed through hybridization intensity in microarrays, (Ellegren & Sheldon 2008). This technique requires the development of species-specific arrays containing probes for thousands of genes, a process that can be technically demanding. Sometimes it is possible to use cross-species microarrays developed from closely-related species. The measurement of gene expression requires the isolation of messenger RNA (mRNA) from living tissues, which is often an invasive procedure in animals, frequently requiring the sacrifice of the sampled individuals. The amount of mRNA is tissue-specific and may change with time, stress or other environmental factors. Moreover, microarrays are prone to several sources of technical variance that can compromise the precision of gene expression, thus requiring the analysis of several replicates (Whitehead & Crawford 2006). All these limitations reduce the attractiveness of the technique for many non-model species. Even though, some studies have successfully used gene expression microarrays to target candidate genes associated with adaptive traits by differential expression in non-model species, such as the fish Fundulus
heteroclitus (Oleksiak et al. 2002), Darwins’ finches (Abzhanov et al. 2006) or the
whitefish, Coregonus clupeaformis (Derome et al. 2006; Derome & Bernatchez 2006). Recent studies have implemented an alternative strategy to microarrays for the detection of genes with differential expression using a cDNA-AFLP genome scan, which combines the use of mRNA (reverse transcribed into complementary DNA, cDNA) with an AFLP protocol (Martínez-Fernández et al. 2010). This strategy overcomes the need for the development of massive genomic information in non-model species for the construction of species-specific arrays.
1.2.4 – Candidate genes
The investigation of candidate genes to assess the genetic basis of adaptive phenotypes in non-model species is sometimes an effective shortcut to genome scans or QTL mapping. For non-model species not suitable for maintenance in captivity, nor to conduct controlled crosses, and with very scarce genomic resources, a candidate gene
approach may provide an effective and rewarding alternative to determine the genetic variation underlying adaptive phenotypes, using preexisting knowledge about genes affecting similar phenotypic traits in other species. However, the candidate genes approach is necessarily biased towards genes that are already characterized (Hoekstra 2006; Jensen et al. 2007) and only genome scans or quantitative trait loci analysis can highlight unsuspected targets of selection in the genome. Nevertheless, the study of vertebrate pigmentation genes in wild populations has provided several successful examples, benefiting from the vast knowledge accumulated from model organisms about the genes involved in pigmentation pathways (Hoekstra 2006; Protas & Patel 2008; Hubbard et al. 2010). Hoekstra et al. (2006) investigated the melanocortin-1 receptor (Mc1r), a gene involved in the melanin synthesis, and identified a derived amino acid mutation in association with adaptive colour pattern in beach mice (Peromyscus
polionotus). The involvement of Mc1r in beach mice coloration was confirmed by
functional assays in vitro, showing that the amino acid change reduces the activity of the receptor (Hoekstra et al. 2006). Complementing QTL mapping with candidate genes’ genotypes can also enhance the power of QTL analysis to highlight the genes underlying phenotypic traits, as demonstrated in beach mice (Steiner et al. 2007) and cavefish (Gross
et al. 2009).
1.2.5 – Next generation sequencing
The emergence of new DNA sequencing technologies from 2005 onwards has opened new and exciting prospects for the investigation of adaptation in non-model species (Ansorge 2009; Stapley et al. 2010). The next generation sequencing technologies (NGS) use nanotechnology to generate millions of small sequence reads simultaneously, overcoming the traditional automated sequencers, which implement the Sanger method through capillary electrophoresis, and are limited to the parallel sequencing of 96 samples (Hudson 2008; Mardis 2008). Several mutually competitive NGS platforms became commercially available. The best known and most popular platforms are the Roche 454 FLX Titanium system, the Illumina’s Genome Analyser (Solexa) and SOLiD from Applied Biosystems (Stapley et al. 2010). NGS dramatically reduce the time and cost
needed to obtain huge amounts of data from the genome or transcriptome of any organism, offering the opportunity to study species that are relevant for questions in evolutionary biology but that are distantly related to model species with sequenced genomes (Hudson 2008). This has been the case for several species, such as the marine snail Littorina saxatilis, the butterfly Heliconius melpomene or the tree-spined stickleback, Gasterosteus aculeatus, where NGS has been applied to study adaptation to the environment and speciation (Ferguson et al. 2010; Galindo et al. 2010; Hohenlohe et
al. 2010). Genome scans and QTL mapping can greatly benefit from the implementation
of NGS, by generating thousands of genetic markers in non-model species, such as SNPs or microsatellites, much faster than by traditional methods (Slate et al. 2010; Stapley et
al. 2010). Moreover, the implementation of NGS for many individuals from different
populations simultaneously corresponds to a genotype-by-sequencing approach, where the sequence content of genetic markers emerges from anonymity, thus overcoming limitations raised by the use of anonymous and dominant markers such as AFLPs (Rowe
et al. 2011).
The NGS are very young in the field, and like all new technologies, they still have some weaknesses and limitations (McPherson 2009). The large amount of data generated by NGS requires large computation and storing capacity and some studies report difficulties in dealing with repetitive sequences or indels in large genome assemblies based on short length sequences (Schatz et al. 2010; Gnerre et al. 2011). Assemblies of NGS sequences are more reliable when a reference genome is available, but most species have no reference genome available yet. These problems shall be overcome with progress in technology and in bioinformatic tools used for data analysis. The overall cost per base is lower for NGS when compared to Sanger sequencing, but it is still limiting for most low budget projects. However, a third generation of sequencing technologies is under development, with the Single Molecular Real Time (SMRT) DNA sequencer from Pacific Biosciences, which proposes to produce much longer read lengths (up to 10,000 bases) than current NGS platforms or Sanger sequencing (up to 1,000 bases) (McCarthy 2010). Such long reads will make de novo assembly of non-model species genome feasible, reliable and probably even cheaper than it is today.
1.2.6 – Validation of candidate loci
Once candidate regions of the genome potentially under selection have been targeted by statistical inference through one or several of the approaches described above combined, further studies are needed to understand the causes of selection signatures. Sequence analysis of candidate genes’ coding regions is useful to identify amino acid changes and their association with phenotypic variation. The consequences of changes in amino acids with different physico-chemical properties in the conformation and functionality of the protein can be inferred based on homology to protein structure in well-studied species (e.g. Wheat et al. 2006). Furthermore, whenever possible, functional assays might provide solid evidence for the consequences of alternative alleles in the phenotype. Such functional assays include in vitro studies, where proteins can be generated in bacteria, in cultured eukaryotic cells or in a cell free system, and tested for levels of enzyme activity on substrates (Jensen et al. 2007). Functional consequences of
Mc1r mutations has been tested this way in beach mice (Hoekstra et al. 2006), in lizards
(Rosenblum et al. 2010) and even in an extinct species, the mammoth (Römpler et al. 2006). Because proteins encoded by genes are often involved in complex metabolic networks, the link between the functional effects of mutations in a single gene and the consequences in individual fitness is rarely direct due to the effect of epistasy (i.e. when effects of one gene are modified by other genes) (Storz & Wheat 2010). Measures of single-gene expression are also important to validate candidate genes, since genes with a conserved amino acid chain can still affect the phenotype by changes in gene expression, which are triggered by regulatory mutations. This was the case of the Agouti gene in beach mice (Steiner et al. 2007) and in deer mice (Linnen et al. 2009). Functional assays
in vivo are perhaps more powerful than in vitro assays, because the function is tested in
the genetic background where it evolved (Jensen et al. 2007). However, in vivo assays are restricted to a limited group of species where transgenic technologies are possible. Recent studies in cavefish Astyanax mexicanus provide an interesting example for in vivo functional assays in non-model species. The functional effect of Mc1r mutations was tested by gene knockdown in zebrafish (Danio rerio) embryos, while in vitro transcribed RNA derived from alternative Mc1r alleles in cavefish were injected in those embryos to evaluate changes in pigmentation during early development (Gross et al. 2009).
1.3 – Lizards as models for selection and adaptation
Lizards are a very successful group of vertebrates that have diversified to fill a wide variety of ecological niches (Pianka & Vitt 2003). Several lizard species have become model organisms in ecological studies (e.g. species from the genus Anolis), where differences in body size or shape and coloration have been frequently considered as local adaptations to the habitat (Losos et al. 1994; Ogden & Thorpe 2002; Thorpe & Stenson 2003; Thorpe et al. 2008). However, when compared to the other groups of vertebrates, lizards are far behind in the application of population genomics and genome sequencing. The first lizard genome was finally released in 2010, from Anolis carolinensis (Alföldi et
al. 2011), and hopefully more lizard genomes will follow, bridging a long-standing gap in
vertebrate’s genomics and opening new perspectives for the investigation of the genetic basis of adaptive traits (Schneider 2008). Although the genetics of adaptation in lizards is still largely unknown, this is a group with great potential for speciation studies (Camargo
et al. 2010). The species chosen for the present study was Lacerta lepida, a non-model
lizard species with spatial morphological and genetic variation, suitable to study local adaptation. Current knowledge in L. lepida characteristics and evolution will be detailed in the following sections.
1.3.1 – Lacerta lepida
Lacerta lepida Daudin, 1802 is a lizard species from the Lacertidae family (species
of this family are native from Africa, Europe or Asia) and belongs to a group of lizard species commonly designated as ocellated lizards or jewelled lizards, due to the characteristic eyespots on their dorsum and flanks. Mayer & Bischoff (1996) reviewed their taxonomy and proposed the exclusion of the subgenus Timon (where ocellated lizards were included) from genus Lacerta, and its upgrade to a full genus based on morphological and karyological peculiarities. Therefore, L. lepida is currently known as
Timon lepidus, but the former designation is still in use in recently published works (Díaz et al. 2006; Paulo et al. 2008; Miraldo et al. 2011), and will be used throughout this
Ocellated lizards are large sized lizards with a distribution that is restricted in Europe to almost all of the Iberian Peninsula and some regions in the South of France and North of Italy, while in Africa they can be found in Morocco and in northern Algeria and Tunisia (Fig. 1). Ocellated lizards from Europe and North Africa were until recently considered as the same species, but the morphological and genetic divergence between lizards from each side of the Strait of Gibraltar led to the recognition of North African lizards in Tunisia and Algeria as Lacerta pater Lataste, 1880 and in Morocco as Lacerta
tangitana Boulenger, 1887, while only European ocellated lizards remained as L. lepida
(Mateo et al. 1996; Fig. 2).
Fig. 1 Map of the western Mediterranean with the distribution of ocellated lizards (adapted from Paulo (2001)). Lacerta lepida (green) is the single species of ocellated lizards living in Europe. Distribution of subspecies L. l. iberica (in the northwest of the Iberian Peninsula) and L. l. nevadensis (in the southeast of the Iberian Peninsula) are recognizable with darker tones of green, while light green corresponds to the nominal subspecies distribution, L. l. lepida. In Africa, two species can be found: L. tangitana (brown) in Morroco and L. pater (light orange) in Algeria and Tunisia.
There are four subspecies currently recognized within L. lepida: Lacerta lepida
lepida Daudin, 1802; Lacerta lepida nevadensis Buchholz, 1963; Lacerta lepida iberica
(López Seoane, 1884) and Lacerta lepida oteroi Castroviejo & Mateo, 1998. The nominal subspecies occupies most of the distribution area, occurring in typically Mediterranean habitat. It is replaced by L. l. nevadensis in the southeastern region of the Iberian Peninsula, along the Mediterranean Sea coastline, including most of the Spanish provinces of Almeria, Murcia and Alicante. L. l. lepida is also replaced by L. l. iberica in the northwest of the Iberian Peninsula, along the western coast of Galicia and north of Portugal (Fig. 1). The fourth subspecies, L. l. oteroi, is restricted to the small island of Sálvora, located near the Galicia coast. This isolated subspecies exhibits some differences in morphology and in karyotype, but it resembles L. l. iberica from the nearby coast (Castroviejo & Mateo 1998). The present work will focus on the three subspecies inhabiting the mainland in the Iberian Peninsula (Fig. 2), and therefore all mentions to L.
lepida subspecies hereafter will not be extensive to L. l. oteroi.
Luís García Cardenete
Rosa Gambóias
Tony Herrera Andreia Miraldo
Nockoocho
1
2
3
4
5
Fig. 2 European and African ocellated lizards. From Europe: (1) Lacerta lepida lepida; (2) Lacerta lepida
iberica and (5) Lacerta lepida nevadensis. From Africa: (3) Lacerta tangitana and (4) Lacerta pater.
Ocellated lizards are diurnal, poikilothermic and ground-dwelling lizards that forage actively on a large variety of mainly arthropod prey (Castilla & Bawens 1989;
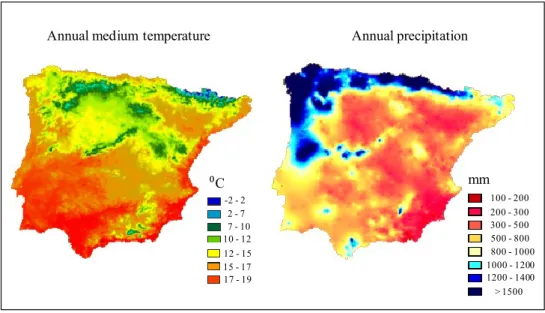
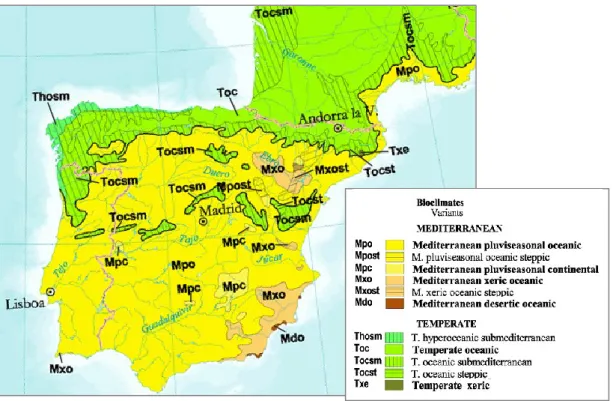
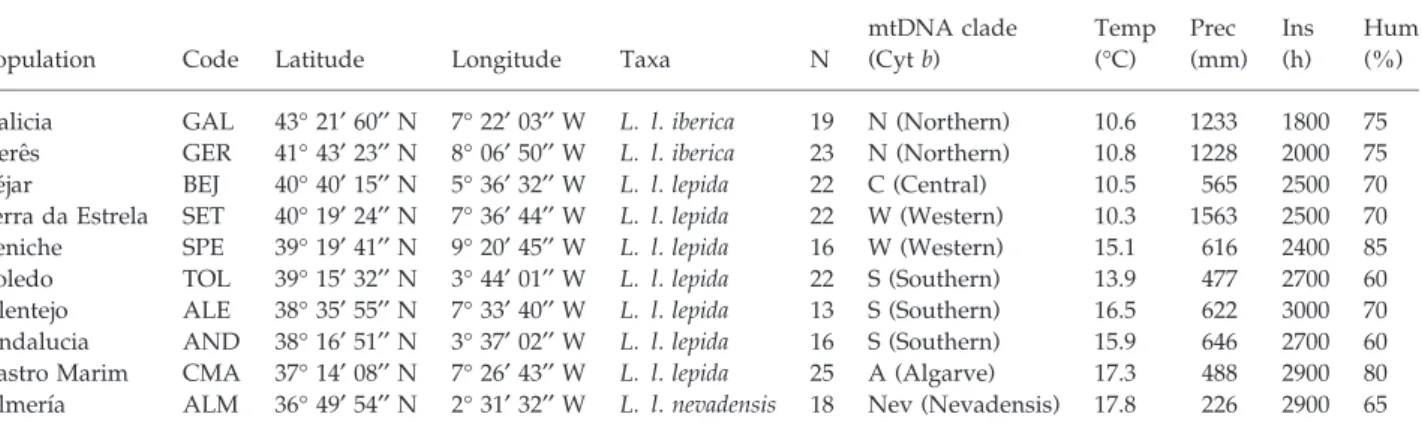
Busack & Visnaw 1989). Morphological and genetic divergence has been documented between the three mainland subspecies in the Iberian Peninsula and some authors argue that it might be important for the local adaptation to the contrasting climatic and ecological conditions registered in each subspecies’ distribution range (Mateo 1998; Mateo & Castroviejo 1990; Mateo & López-Jurado 1994). Clinal variation has been detected in several morphological traits in L. lepida, following a northwest-southeast climatic gradient across the Iberian Peninsula. This gradient is affected by the irregular distribution of precipitation and temperature (Fig. 3), which in turn affects the vegetation cover and even the properties of the soil. Therefore, the distribution of each L. lepida subspecies coincides with different bioclimatic regions (Fig. 4).
-2 - 2 2 - 7 7 - 10 10 - 12 12 - 15 15 - 17 17 - 19 ⁰C mm 100 - 200 200 - 300 300 - 500 500 - 800 800 - 1000 1000 - 1200 1200 - 1400 > 1500
Annual medium temperature Annual precipitation
Fig. 3 Distribution of annual medium temperature and annual precipitation in the Iberian Peninsula according to measures recorded from 1950 to 1999. Adapted from the Digital Climatic Atlas of the Iberian Peninsula (Ninyerola et al. 2005, http://www.opengis.uab.es/WMS/iberia/en_index.htm).
Most of the distribution area of the nominal subspecies is characterized by a Mediterranean climate, with hot and dry summers. In the southeast, coinciding with most of L. l. nevadensis distribution, the Mediterranean climate assumes xeric properties, with reduced (< 300 mm) and irregular annual rainfall (IGN 1992). On the opposite direction, in the northwest of the Iberian Peninsula, the distribution of L. l. iberica is associated with a temperate climate with abundant annual rainfall (> 2000 mm) and mild summers. This
region presents the lowest annual hours of sunshine in the Iberian Peninsula (< 2000 h; IGN 1992). The following sections will describe in more detail the differences between the three L. lepida subspecies as provided in available literature.
Fig. 4 Bioclimatic map of the Iberian Peninsula and south of France (adapted from Rivas-Martínez et al. 2004, http://www.ucm.es/info/cif/form/bi_med.htm). Most of the Iberian Peninsula is characterized by a Mediterranean bioclimate (Mpo variant), except in the northwest, which presents a Temperate bioclimate (Toc variant). In the southeast of the Iberian Peninsula, a Mediterranean bioclimate with xeric properties can be recognized (Mxo variant).
1.3.1.1 – Variation in morphology
The most conspicuous differences in morphology between the three Lacerta lepida subspecies are related to biometry and colour pattern (Fig. 2). According to Mateo & Castroviejo (1990), the average snout-to-vent length (SVL) measured in L. l. iberica (males: 147.16 ± 18.42 mm; females: 130.78 ± 11.69 mm) was notoriously inferior to the measures obtained in the nominal subspecies (males: 166.36 ± 27.39 mm; females:
151.08 ± 21.84 mm) and in L. l. nevadensis (males: 175.40 ± 25.21 mm; females: 153.23 ± 17.19 mm). The head is longer and broader in L. l. nevadensis males and they present more femoral pores in the hind limbs than males from the other subspecies (Mateo & Castroviejo 1990). Lizards belonging to L. l. nevadensis are also the ones with more pronounced differences in colour pattern. They normally have no dorsal black scales, which are replaced by brown/grey scales in the colour pattern. The dorsal ornamentation composed by a pattern of more or less perfect rings of dark scales enclosing yellow/green scales is often absent in this subspecies, especially in large males. However, when dorsal circles are well defined, they are normally arranged in two longitudinal series in L. l.
nevandensis, whereas they are arranged in several transversal series in L. l. iberica. The
transversal banding is common in juveniles but adult lizards from L. l. iberica maintain this trait whereas it normally disappears with age in the nominal subspecies (Mateo 1988). The coloration presented by L. l. iberica is darker and results from the higher proportion of black scales in the dorsal pattern in this subspecies (Mateo & Castroviejo 1990; Mateo & López-Jurado 1994). The presence of ornamentation in the neck and in the limbs is commonly observed in L. l. iberica but is nearly absent in L. l. nevadensis (Mateo 1988). Ocellated lizards have conspicuous blue eyespots in their body flanks, which have probably an important role for social signaling (Font et al. 2009). The blue scales of lateral eyespots are bordered by a ring of black scales in L. l. iberica and in L. l.
lepida, but not in L. l. nevadensis, because black scales are lacking in this subspecies’
colour pattern (Mateo 1988).
Mateo (1988) proposed that the smaller body size and darker coloration presented by L. l. iberica could be driven by thermoregulatory limitations in the northwest, where sunshine hours and temperatures are lower, and such morphological traits could contribute to reduce the amount of solar exposition required to heat the body. The same author proposed that the brownish/greyish dorsal coloration in L. l. nevadensis might be effective for crypsis with the soil in the southeast, because large portions of the landscape have no vegetation cover.
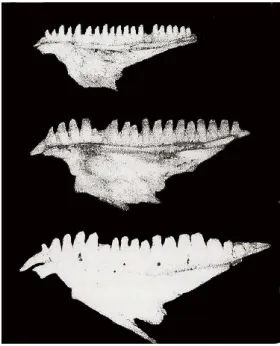
Dentition is another morphological trait that varies among L. lepida subspecies (Fig. 5). The number of teeth increases from the southeast to the northwest: 16-19 teeth in L. l.
nevadensis (average = 17.5); 17-22 teeth in L. l. lepida (average = 18.6) and 19-26 teeth
in L. l. iberica (average = 21.3). However, the degree of morphological specialization among teeth increases in the opposite direction, with L. l. iberica presenting
homogeneous teeth both in size and symmetry, whereas L. l. nevadensis has both large and small teeth, with one, two or three cusps (Mateo 1988; Castroviejo & Mateo 1998; Fig. 5). Differences among subspecies in teeth number and morphology might be related with slight variation in diet composition. L. l. nevadensis diet has been reported as less diverse, with a preference for Tenebrionidae beetles and a shift towards frugivory in scarcity periods in the dry zones from Almeria and Alicante (Busack & Visnaw 1989; Hodar et al. 1996), whereas in populations from L. l. lepida, in central Spain, Scarabidae beetles were the most abundant in ocellated lizards’ diet (Castilla 1989). Athough Coleoptera are the main prey for ocellated lizards, Gastropoda are specially abundant in humid regions and have a relevant contribution to L. l. iberica diet (Mateo 1988).
Fig. 5Maxilla from adult males belonging to different Lacerta lepida subspecies. From top to bottom: L. l.
iberica, L. l. lepida and L. l. nevadensis (adapted from Mateo 1988).
Analysis of the karyotype in L. lepida revealed three distinct patterns which differ in the number and position of the nucleolar organizers (NORs). The same pattern is found in L. l. lepida and L. l. nevadensis, with only one pair of NORs at the 5th pair of chromosomes, while three patterns were found in lizards from L. l. iberica: i) the same pattern as in the other subspecies, with one pair of NORs at the 5th pair; ii) one pair of
NORs at the 11th pair of chromosomes and iii) two pairs of NORs, at the 5th and the 11th pairs of chromosomes (Castroviejo & Mateo 1998; Mateo et al. 1999).
1.3.1.2 – Variation in reproductive strategy
Lacerta lepida females reach their sexual maturity normally around 32-33 months
of age, after the third winter since birth. Ocellated lizards emerge from winter hibernation in March and matings occur from April to June. Females lay a single clutch (with 16.9 eggs on average) until the end of July (Castilla & Bauwens 1989). Newborns appear in September and the hibernation period resumes in October until the following spring. In the northwest, L. l. iberica females mature a year before, when they reach 21 months of age, starting their sexual activity with a relatively smaller body size (Castilla & Bauwens 1989; Mateo & Castanet 1994). However, L. l. iberica females seem to have a shorter life span which rarely exceeds two breeding seasons (Mateo & Castanet 1994). L. l. iberica females born and raised in captivity, in the same conditions as L. l. lepida and L. l.
nevadensis, maintain a significant lower body size after their third year of life, suggesting
that size is genetically determined (Mateo & Castanet 1994). Females from L. l.
nevadensis produce smaller clutches (12.3 eggs on average), but composed by larger
eggs, and may produce more than one clutch per year, resulting in an extended and asynchronous laying period (Castilla & Bauwens 1989; Mateo & Castanet 1994).
The length of the annual cycle of activity and reproduction differs between subspecies, probably as the result of lizards’ adjustment to the local climatic conditions. In the southeast, temperature rises earlier in the spring, leading to a shorter hibernation period. Copulations in L. l. nevadensis may start as early as February and the laying period extends from March until June (Mateo & Castanet 1994). In the northwest, the end of lizards’ hibernation may be delayed in the year until the spring weather warms up. The first copulations in L. l. iberica were observed only in May and pregnant females were not detected until the end of June (Mateo & Castanet 1994).
1.3.1.3 – Genetic variation
The first studies concerning the genetic variability within European ocellated lizards were reported in Mateo (1988) and Mateo et al. (1996), based in allozymes’ diversity, and demonstrated that L. l. nevadensis was the most differentiated group within
L. lepida. More recent studies provided detailed phylogenetic and phylogeopraphic
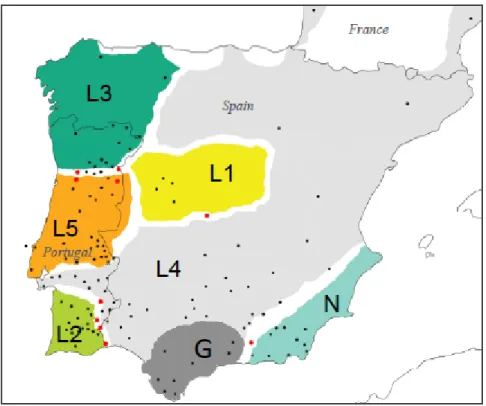
patterns based in additional genetic data (mitochondrial DNA and nuclear genes) and confirmed L. l. nevadensis as the most divergent subspecies (Paulo 2001; Paulo et al. 2008; Miraldo 2009; Miraldo et al. 2011). These studies detected further genetic structure and geographical subdivisions among L. lepida populations. According to divergence time estimates from Paulo et al. (2008), the split between European and African ocellated lizards occurred around 11.33 million years ago (Ma). The split between L. l. nevadensis (clade N, Fig. 6) and the remaining European ocellated lizards (clade L, Fig. 6) is estimated in 9.43 Ma, during the Miocene, and resulted in two reciprocally monophyletic clades (Paulo et al. 2008). The divergence within clade L occurred more recently, during the climatic cycles of the Quaternary (between 2.0 and 0.5 Ma), giving rise to six subclades (clades L1-L5 and Guadalquivir; Paulo 2001; Paulo et al. 2008; Miraldo et al. 2011; Fig. 6). The oldest split within clade L separated clades L2 and L3 from the remaining clades. Interestingly, clade L3 corresponds to the subspecies L. l. iberica from the northwest of the Iberian Peninsula, while clade L2 is geographically separated by several hundred kilometers from clade L3 and is composed by populations from the south of Portugal (Fig. 7). These genetic patterns suggest a history of population’s contraction and allopatric divergence of L. lepida in different refugia during the glacial periods of the Pleistocene. Miraldo et al. (2011) detected signs of recent demographic and spatial expansion in each clade and identified several zones of secondary contact between geographically adjacent clades. The contact zone between L. l. nevadensis and L. l. lepida (clade L4) was investigated in more detail by Miraldo (2009). The genetic patterns obtained with both mitochondrial and nuclear (microsatellites) DNA were consistent with a narrow contact zone and limited gene flow, attesting for the deep divergence level between these subspecies, which are following independent evolutionary trajectories.
Fig. 6 Maximum likelihood phylogenetic tree (with molecular clock enforced) based on mitochondrial
DNA cytochrome b fragments (adapted from Paulo 2001). Numbers above branches correspond to bootstrap support values obtained from 100 pseudo-replicates. Seven clades were detected within Lacerta
Fig. 7 Geographical distribution of Lacerta lepida mitochondrial clades as inferred from cytochrome b sequences (adapted from Miraldo et al. 2011). Sampled localities are represented by black dots and red dots. Red dots indicate localities where two or more phylogroups were detected in sympatry by Miraldo et
al. (2011). The phylogroup “G”, represented in dark grey, was detected by Paulo (2001) but was not
1.4 – Objectives and thesis structure
The main objective of this work is to gather empirical evidence for the speciation process in spatially structured populations, in the absence of abrupt environmental barriers for the occurrence of gene flow, through the identification and investigation of genes or genomic regions involved in the local adaptation. The species chosen as a model is the ocellated lizard (Lacerta lepida), which has scarce genomic resources available. The species has a wide distribution range in the Iberian Peninsula, with ecological and climatic heterogeneity and three recognized parapatric subspecies. Previous studies indicate that variation in several morphological traits might be a response to local selective pressures. The phylogeny and phylogeography of the species corroborates the morphological differentiation at the genetic level and demonstrates that populations are spatially structured, with a level of genetic divergence that reflects several divergence timescales and a complex evolutionary history. This work addresses, for the first time, the genetic variation in ocellated lizards from an adaptive perspective, investigating the role of natural selection in the evolutionary history of the species. Two main approaches were chosen for the detection of genes under selection: a population genomic approach using an AFLP genome scan and a candidate gene approach through the investigation of
melanocortin-1-receptor (Mc1r), a candidate gene for melanin-based coloration.
To achieve the main objective, the following specific objectives were established:
(i) To statistically detect candidate loci under selection (outlier loci) through a genome scan with AFLP markers in European ocellated lizards sampled across an environmental gradient;
(ii) To infer possible selective pressures acting over AFLP outliers by testing for associations between AFLP outliers’ band frequency and variation in environmental variables along the environmental gradient;
(iii) To isolate and sequence AFLP markers detected as outliers in the ocellated lizards genome scan, bringing them out of anonymity, infer their homology with known genes and evaluate outliers’ haplotypic variation among ocellated lizards;
(iv) To investigate the genetic basis of dorsal colour variation in ocellated lizards through the analysis of sequence variation in a candidate gene involved in the melanin synthesis pathway, the Mc1r, and look for associations between amino acid changes in Mc1r and colour phenotypes of ocellated lizards;
(v) To compare the genetic structure in European ocellated lizards as inferred from neutral markers (microsatellites and AFLPs) and from loci suspected to be under the effect of selection (AFLP outliers), gaining some insights about gene flow and heterogeneity in nuclear genomic divergence along the
environmental cline.
To address the above specific objectives, the thesis is organized in four data chapters. The first data chapter (chapter 2) provides the results from the AFLP genome scan for selection in European ocellated lizards and from tests for association between AFLP markers and environmental variables (objectives i and ii). The second data chapter (chapter 3) describes the efforts to isolate, sequence and characterize AFLP outliers (objective iii), identified as candidate loci potentially under selection in chapter 2. The third data chapter (chapter 4) presents the sequence analysis of a candidate gene (Mc1r) in European ocellated lizards and its association with dorsal colour phenotypes (objective iv). Finally, the fourth data chapter (chapter 5) presents a comparative analysis of microsatellite data with AFLP data, using neutral markers and outlier markers in the analysis of population structure of European ocellated lizards (objective v). The implications of the findings of this thesis are debated in the general discussion (chapter 6) and the thesis ends with the enunciation of the main achievements and the new questions raised by this work, indicating which topics should be addressed in future research.
1.5 – References
Abzhanov A, Kuo WP, Hartmann C et al. (2006) The calmodulin pathway and evolution of elongated beak morphology in Darwin’s finches. Nature, 442, 563-567.