Analysis of Relative Humidity Sensors at the WMO Radiosonde Intercomparison
Experiment in Brazil
LUIZF. SAPUCCI
Departamento de Cartografia da Faculdade de Ciências e Tecnologia da Universidade Estadual Paulista, Presidente Prudente, São Paolo, Brazil
LUIZA. T. MACHADO
Divisão de Satélites e Sistemas Ambientais, Centro de Previsão de Tempo e Estudos Climáticos, Instituto Nacional de Pesquisas Espaciais, Cachoeira Paulista, São Paolo, Brazil
REINALDOB.DASILVEIRA
Coordenação-Geral de Modelagem Numérica de Tempo, Instituto Nacional de Meteorologia, Brasília, Distrito Federal, Brazil
GILBERTOFISCH
Divisão de Ciências Atmosféricas, Instituto de Aeronáutica e Espaço, Centro Técnico Aeroespacial, São José dos Campos, São Paolo, Brazil
JOÃOF. G. MONICO
Departamento de Cartografia da Faculdade de Ciências e Tecnologia da Universidade Estadual Paulista, Presidente Prudente, São Paolo, Brazil
(Manuscript received 17 April 2004, in final form 28 December 2004)
ABSTRACT
The quality of the vertical distribution measurements of humidity in the atmosphere is very important in meteorology due to the crucial role that water vapor plays in the earth’s energy budget. The radiosonde is the humidity measurement device that provides the best vertical resolution. Also, radiosondes are the operational devices that are used to measure the vertical profile of atmospheric water vapor. The World Meteorological Organization (WMO) has carried out several intercomparison experiments at different climatic zones in order to identify the differences between the available commercial sensors. This article presents the results of an experiment that was carried out in Brazil in 2001 in which major commercial radiosonde manufacturers [e.g., Graw Radiosondes GmbH & Co., KG (Germany); MODEM (France); InterMet Systems (United States); Sippican, Inc. (United States); and Vaisala (Finland)] were involved. One of the main goals of this experiment was to evaluate the performance of the different humidity sensors in a tropical region. This evaluation was performed for different atmospheric layers and distinct periods of the day. It also considers the computation of the integrated water vapor (IWV). The results showed that the humidity measurements achieved by the different sensors were quite similar in the low troposphere (the bias median value regarding the RS80 was around 1.8%) and were quite dispersed in the superior layers (the median rms regarding the RS80 was around 14.9%).
Corresponding author address:Dr. Luiz Fernando Sapucci, Universidade Estadual Pavlista, Departamento de Cartografia da Fac-uldade de Ciências e Tecnologia da Universidade, Estadual Paulista, Presidente Prudente, CEP 19060-900, SP Brazil.
E-mail: [email protected]
1. Introduction
Outside the Tropics the primary source of energy for synoptic disturbance is associated with the large latitu-dinal temperature gradient. In the Tropics, as a result of a very small temperature gradient, the primary source of energy is the latent heat released in association with convective clouds that are organized in mesoscale sys-tems (Holton 1992), as a result of intense convective processes causing considerable space–time variability in the humidity fields. The high concentration and vari-ability of water vapor in the tropical atmosphere make the quality of the humidity measurement of special im-portance to climatic change studies and weather fore-casts. The atmospheric water vapor plays an important role in the atmosphere’s general circulation, the hydro-logic cycle, and the formation of clouds.
Although there are several techniques for measuring the profile of atmospheric humidity, the radiosonde is one that gets the measurements directly, unlike other remote sensing–based techniques. The intercomparison experiments among several radiosondes from different manufacturers have allowed the potential of this instru-ment to be verified. On a worldwide level, radiosondes are operational devices that are used to measure the atmospheric water vapor’s vertical profile. Globally there are 900 operational radiosonde stations, and ap-proximately 51% use a radiosonde manufactured by Vaisala Oyj, 10% by Sippican/VIZ, 10% by Shang, 19% by Mars/MRZ, and 10% by other manufacturers (Wang et al. 2003b). Several intercomparison experi-ments on different radiosonde manufacturers were car-ried out to evaluate the humidity measurement quality of the different sensors in temperate regions (Ivanov et al. 1991; Yagi et al. 1996; Schimidlin 2005).
During September 1995, a radiosonde intercompari-son experiment was performed in Virginia, where the main radiosonde manufacturers were involved (Schim-idlin 2005). To ensure improvements in the production and better performance in the usage, recommendations were suggested to the manufacturers and users. The results showed the importance of intercomparison ex-periments to the improvement of that humidity mea-surement technique. Experiments with intensive water vapor observation periods in 1996 and 1997, and involv-ing several relative humidity (RH) measurement tech-niques, were carried out as part of the Atmospheric Radiation Measurement (ARM) Program (Revercomb et al. 2003). The main goal of these experiments was to characterize and improve the accuracy of the water va-por measurements. The ARM Program’s experiments used radiosondes together with an operational Raman lidar, a dual-channel microwave radiometer, multiple
surface-based and tower-based in situ measurements, solar and infrared radiometers and spectrometers, and a two-frequency global positioning system (GPS) re-ceiver to provide absolute water vapor measurements. The results showed a significant variability in the Vaisala RS80H radiosonde measurements of the same calibration batches. An altitude-independent scale fac-tor in the low troposphere can be used to reduce this variability by a factor of approximately 2 (Turner et al. 2003). The RS80 radiosonde data were the object of several studies, aiming to evaluate the need for correc-tions in their results because of the contamination of the capacitive-element humidity sensor by chemical substances (Miller et al. 1999; Guichard et al. 2000; Miloshevich et al. 2001; Wang et al. 2002). Other re-searches sought to evaluate the humidity sensor perfor-mance of RS80, after applying corrections in their re-sults, as well as the accuracy and performance of the Vaisala RS90 radiosonde during operational use (Pauk-kunen et al. 2001; Wang et al. 2001). Moreover, the RS80 was compared against the “Snow White” (here-after “SW”) sensor, which is a hygrometer provided by Meteolabor of Switzerland, in an intercomparison ex-periment that was accomplished at five tropical stations during different seasons in 2000–01 (Fujiwara et al. 2003). The SW and RS80 sensors showed reasonable agreement only in the middle troposphere. In the wet, lower troposphere, the RS80 sensor showed a dry bias error (RS80 values are approximately 10% less than those of SW) due to the humidity sensor contamina-tion, among other reasons. The SW sensor generally provides good performance in the troposphere (Fuji-wara et al. 2003), but it does not operate appropriately in extremely dry conditions (stratosphere), because of the large frost-point depression and the significant po-tential for the out gassing of water from the instrument box and the sensor housing (Vömel et al. 2003). In 2002, a large experiment entitled the International H2O
Proj-ect (IHOP_2002) was carried out in North America (Weckwerth et al. 2004). The aim was to obtain an improved characterization of the time-varying 3D wa-ter vapor field and evaluate its utility in improving the understanding and prediction of the convective pro-cesses. During this experiment 16 sondes were launched with the RS80, Sippican VIZ-B2, and SW sen-sors on the same balloons to evaluate the performance of humidity sensors in two widely used operational ra-diosondes (Wang et al. 2003a). This study showed that the SW can detect cirrus clouds near the tropopause and possibly estimate their ice water content.
and supported by many other Brazilian and interna-tional organizations, was carried out in Brazil in 2001 (Silveira et al. 2003), with the aim of studying the hu-midity sensor’s performance in tropical areas. This experiment was named the WMO Radiosonde Inter-comparison (RSO). The radiosonde manufacturers participating in the experiment were Graw Radio-sondes GmbH & Co., KG, from Germany (DFM-97); MODEM, from France, with InterMet Systems, from the United States (GL-98); Sippican, Inc., from the United States (MKII); and Vaisala Oyj, from Finland (RS80 and RS90). The Meteolabor SW humidity sensor from Switzerland was also used. This sensor has a new chilled-mirror technique to measure water vapor. The launching procedure established during the campaign made the vendors responsible for the radiosonde preparation and data processing; the processed data used in our analysis were those delivered to the site manager up to 60 min after the end of the flight. The only exceptions were the SW data that were postpro-cessed by the Met Office, the United Kingdom weather service, using the RS90 temperature, and the exclusion of some punctual null values that were clearly related to technical problems, like data transmission interrup-tions. Considering that the main goal was to analyze operational aspects, no other data preprocesses like those suggested by Wang et al. (2002), Miloshevich et al. (2001), and Turner et al. (2003) were performed. The aim of this work is to evaluate the performance of the different humidity sensors in a tropical region using the data recorded at the RSO experiment, considering aspects of operational usage. This evaluation was per-formed for different atmospheric layers and in different periods of the day.
2. The RSO experiment
The RSO humidity sensor intercomparison was car-ried out under the WMO experiment at the Brazilian Air Force Satellite/Rocket Launch Center (CLA), in the city of Alcântara, in the coastal area of Maranhão State, Brazil. The experiment was performed at the
CLA meteorological station, which is located at 2°18⬘S latitude and 44°22⬘W longitude, and 49 MSL.
The experiment lasted 18 days, beginning on 21 May and finishing on 7 June 2001. The flights occurred 4 times a day, at 0000, 0600, 1200, and 1800 UTC, as indicated in Table 1. This table shows radiosonde com-binations that were accomplished in each of the 43 flights made during the experiment. The arrangements for launching three or four radiosondes were done to test the RH sensors that were from available opera-tional radiosondes. However, it was decided that other less worldwide operational manufacturers would also participate in the intercomparison experiment, and they should be tested against those that are most avail-able operationally. Thus, the flights were arranged in such a way that GL-98 and DFM-97 were placed with MKII, RS80, or RS90. The SW humidity sensor was launched attached to the MKII radiosonde.
A rig structure consisting of one or two polyvinyl-chloride (PVC) pipes was used to hold up the balloon, the unwinder mechanism, the parachute, and three or four radiosondes, which flew all together attached to one balloon in order to compare the measurements from different sensors (Fig. 1). The rig varies according to the launchings with the three or four radiosondes. Additional details of this experiment can be obtained from Silveira et al. (2003).
Humidity sensor details
A brief description of each RH sensor participating in this experiment is given below, in which is presented the most important details of the radiosondes involved. 1) RS80RADIOSONDE(VAISALA OYJ, FINLAND) The RH sensor is the Vaisala H-Humicap. This is a thin-film capacitive sensor, using a highly porous poly-mer electrode, whose capacitance depends on the amount of water vapor and the air temperature. Its accuracy is better than 3% RH, and the humidity mea-surement range is from 0% to 100%, according to the manufacturer’s notes. Typically, the RS80 samples of RH data are given at intervals of approximately 1–2 s, and during the experiment a time interval of 2 s was chosen.
2) RS90RADIOSONDE(VAISALA OYJ, FINLAND) The RS90 RH sensor is the Vaisala H-Humicap, the same as the RS80 sensor, but the measurement method is different. The RS90 humidity sensor consists of two sensor elements containing heating devices, which are alternately turned on and turned off during the flight. This sensor is heated to eliminate moisture that may form on the polymer surface when the radiosonde pen-TABLE1. Launching times and radiosondes combination for the
flights.
Launching times (UTC)
0000 0600 1200 1800
RS80 RS80 RS80 RS80
MKII MKII MKII MKII
SW — — SW
DFM-97 GL-98 DFM-97 GL-98
etrates clouds. While one element is heated, the other measures the RH, alternating this procedure during the flight. The measurement range is from 0% to 100%, with a resolution of 1%. The humidity sensor accuracy is of the order of 2% RH, and the sounding uncertainty is of 5% RH with a 95% confidence level, according to the manufacturer’s notes. The sample rate was 2 s.
3) MKIIRADIOSONDE(SIPPICAN, INC., UNITEDSTATES)
The RH sensor is a polymer strip that is coated with a carbon slurry called “hygristor.” The MKII sensor operates on the resistance principle whereby it in-creases as atmospheric moisture dein-creases. The space between the carbon molecules increases or decreases as the RH changes, leading to a change in resistance. The hygristor measures RH between 5% and 100% for val-ues of temperature ranging from⫹40° to⫺50°C, with a resolution of 1% and an accuracy of 2%. The humidity data are available with the sample rate of 1 Hz and the data were converted to 2 s (postprocessing phase).
4) GL-98RADIOSONDE(MODEM, FRANCE) The RH sensor is a capacitor type with measure-ments ranging from 0% to 100%. The measurement humidity GL-98 resolution and absolute accuracy are 0.1% and 5%, respectively. The response time of this sensor is less than 2 s. The sample rate that was used was 1 s.
5) DFM-97 RADIOSONDE(GRAWRADIOSONDES GMBH & CO., KG, GERMANY)
The DFM-97 RH sensor is a capacitive polymer chip sensor that is protected against heating and water in-gress by a mirrored capsule. This sensor presents a hu-midity measurement error that is lower than 5%, with a resolution of 1% for values from 5% to 100%. The sample rate was 2 s.
6) SW RH SENSOR(METEOLABOR, SWITZERLAND)
This sensor is a hydrometer named Snow White, based on the physically chilled mirror principle to mea-sure water vapor concentrations. There is an electric system to maintain the mirror temperature at the dew-point temperature of the environment. The SW RH maximum values are 100%, and the minimum is given by the limited temperature depression of the electrical heat pump under the mirror (Peltier element). This de-pression is at air temperatures from 20° to ⫺60°C. Therefore, the lowest possible value is about 2%–3% RH (P. Ruppert 2004, personal communication). How-ever, this sensor has limitations in extremely dry con-ditions (lower than 6%) (Vömel et al. 2003). Its accu-racy is of the order of 2% at saturation under the tropi-cal tropospheric conditions, if the accuracy for air temperature is of about⫾0.2 K (Fujiwara et al. 2003) The SW flew connected to the MKII radiosonde to share the data transmitter and temperature measure-ments at a sample rate of 1 s.
3. Data processing and method
This section describes the procedures used in the ex-periment at the postprocessing phase. The first step was to set up a dataset sampling at a 2-s rate for all of the flights. The second postprocessing step was the time adjustment of all observations (offset-time adjustment). Because the radiosondes were launched all together, time is the common parameter to all of the equipment participating in the same flight. Therefore, the inter-comparison analyses are realized as functions of time. However, due to the specific system of each radio-sonde, the start of the flight is not the same for all sensors. Thus, a small offset adjustment time was nec-essary. An objective technique was used to adjust the time setup of all the sets of radiosondes that flew on the same balloon. This technique considers the following points.
• Temperature was the radiosonde measurement that best agreed among them. Thus, it was decided to use temperature as the parameter to guide the offset-time adjustment.
• The Vaisala RS80 was the radiosonde that partici-pated in all of the flights. Then, the RS80 tempera-ture profile was used as a reference to adjust the time offset of the remaining radiosondes. Considering that this procedure only adjusts the time offset, there is no implication for the results of the radiosonde compari-son due to the consideration of the RS80 as a refer-ence.
• A mean-squared error algorithm was applied to the temperature profile for each flight between the RS80 and each of the other radiosondes that were launched on the same balloon, considering a possible lag up to a maximum time offset. The minimum time lag ab-solute error was considered as the time offset of each sonde in relation to the time of the RS80.
• The maximum time offset was considered in the time interval of about 20 s. To ensure the best adjustment, this time step value was defined to be larger than the largest time offset occurring during the radiosonde trial.
• The time offset was adjusted by considering only the average time that it took for the radiosonde to cross a layer that is slightly larger than the mixed layer, that is, 160 s. The layer that included the mixed layer and a few meters higher has larger temperature changes with height. The use of this layer ensures having a good adjustment without including all of the radio-sonde patches that probably add time offset due to the specific radiosonde system. An example of this approach applied to one of the flights is shown in Fig. 2.
Although there are differences among the tempera-ture values that are measured by the different radio-sondes that might influence the RH values, these dif-ferences are quite small. Silveira et al. (2003) did a detailed analysis of the temperature sensors and con-cluded that bias among the radiosondes is less than 0.05°C for the heights lower than 3 km, is 0.15°C for the heights between 3 and 8 km, and is between 0.4° and 0.7°C for the layer above 8 km. Considering that most of the water vapor is in the first and second layers, this difference does not have a substantial influence on the RH analysis.
The RH measurements from SW were postprocessed using the RS90 temperature. Moreover, a quality-control process was applied to exclude spurious values. The Met Office carried out this postprocessing in the SW data.
The comparisons among different radiosondes that were launched in the same flight were accomplished using the ascension time as reference. However, that reference is not appropriate for use in describing the vertical statistics of humidity values from different flights, because the ascension rates of the balloons are not exactly the same for each flight. Therefore, the time–altitude relation is not the same among the differ-ent flights. To tackle this problem, the humidity value differences gathered from different sensors for each flight, then computed as a function of time, were re-ferred to in the pressure values to be analyzed, together with the other flights. The pressure vertical resolution was of 1 hPa.
Available data
Only two flights were cancelled from those 43 radio-sondes flights. Flight 33 with the RS80, RS90, MKII, FIG. 2. Example of temperature profile (left) without time offset adjustment and (right) after time offset
DFM-97, and SW sensors was cancelled because 2 min prior to the launch there was a heavy storm and the balloon was not able to ascend with the radiosondes. During flight 37, which was also cancelled, the balloon carrying the RS80, RS90, MKII, DFM-97, and SW sen-sors did not ascend properly, and it remained between 200 and 400 m for a 20-min period because of a strong rainfall prior to launching. Some of the RS80, RS90, MKII, and SW humidity data presented clear technical problems, and they were excluded in order not commit the statistical analyses (see Silveira et al. 2003 for spe-cific details).
Due to the absence of reference humidity data, the sensor’s performances are presented as a function of the RS80 values. The RS80 was chosen because it is currently the most used radiosonde for operational pur-poses (Wang et al. 2001), and much research has been done to reduce and, eventually, remove errors that were present in this sensor (Wang et al. 2003a,b). In addition, it participated in all flights accomplished in the experiment. Table 2 describes the number of avail-able flights during this experiment for each radiosonde system, and the number of flights available for the in-tercomparison with the RS80. Whereas the other radio-sondes continually measured the humidity during most of the soundings, the MKII had a large amount of in-terruptions, and it registered null values while the other radiosondes did not. This happened in the three flights. These values were taken out of the analyses.
Tendency and dispersion analyses were applied to verify the consistency of the radiosonde measurements. We have used the root-mean-square (rms) as the dis-persion and the bias measurement to account for pos-sible tendencies. These statistical quantities were com-puted on a level-to-level basis for a combination of the available radiosondes, for the same flight and time, and were further converted to the RS80 pressure. The analysis was carried out as a function of height (con-verted from pressure using the average relationship). Also, three layers were defined: the first layer includes the lower levels of the troposphere (from the surface to 3 km); the second layer includes the medium levels of
the troposphere, between 3 and 8 km; and the third layer includes the highest levels of the troposphere and the beginning of the stratosphere, starting at 8 km up to the end of the vertical profile.
4. Analysis of the results
We began by presenting the general features of the humidity profile for each radiosonde. The average pro-files were divided into four groups to assure simulta-neous measurements and the same amount of flights among the different sensors. It can be noted that DFM-97 and GL-98 never flew together. The four groups are composed of the flights at 0000, 0600, 1200, and 1800 UTC. The average profiles were computed using only those flights that were successful in collecting data from all of the sensors. These average profiles present a pre-liminary analysis of the main behavior of the different humidity sensors that are involved in the experiment. Figure 3 shows the mean profiles of the RH measured from different sensors launched in the four groups as a function of the altitude.
In Fig. 3 a low dispersion at the low and medium levels of the troposphere (up to around 8 km) can be seen, where the humidity concentration is relatively large. This fact is not observed at high levels of the troposphere, where the measurements are more dis-persed. Also, at low levels the MKII radiosonde pre-sents higher RH values than the other radiosondes. Conversely, the DFM-97 radiosonde, at low levels, pre-sents values lower than the others. These results sug-gest that at conditions of a high concentration of water vapor, MKII and DFM-97, respectively, overestimate and underestimate the humidity with relation to the other radiosondes. The point that draws attention in Fig. 3 is the high dispersion at high levels, where it is clearly seen that there is no agreement among the ra-diosondes. In this layer, daytime SW RH values have a larger dispersion with relation to the other radiosonde RH values than during the nighttime period. Solar heating reduces the cooling efficiency of the Peltier hot side, explaining the slightly higher limited temperature depression under the mirror for the daytime period (Vömel et al. 2003).
Figure 4 gives the bias and rms values of the RH sensors as a function of the RS80 sensor values. The number of samples considered in each comparison is presented in the Table 3.
• In the first layer the RS80 RH mean value is smaller than those from other sensors (Figs. 4a, 4b, 4c, and 4e), with the exception of the DFM-97 sensor values (Fig. 4d). In this layer GL-98 has nearly no bias (Fig. 4c).
TABLE2. The comparisons available between the RS80 and
other humidity sensors.
Humidity sensor
Accomplished flight numbers
Intercomparison number with RS80
RS80 40 . . .
RS90 25 18
MKII 43 33
SW 23 16
GL-98 23 20
FIG. 3. Mean profiles of RH computed from the radiosonde measurements for the flights launched at (a) 0000,
• In the second layer, the low bias values indicate the lack of tendency among the different radiosondes. An exception is observed between RS80 and MKII, where the latter presents smaller values than RS80 in that layer. However, a large dispersion is observed between such radiosondes (Fig. 4b). Despite these radiosondes that have generated values with low
ten-dencies the rms values in this layer indicate a larger dispersion than those observed in the first layer. • The largest dispersion of the RH is noticed in the
third layer. In this layer, the RS80 RH mean value presents a tendency to underestimate the RH. It pre-sents smaller values than those generated by the other sensors.
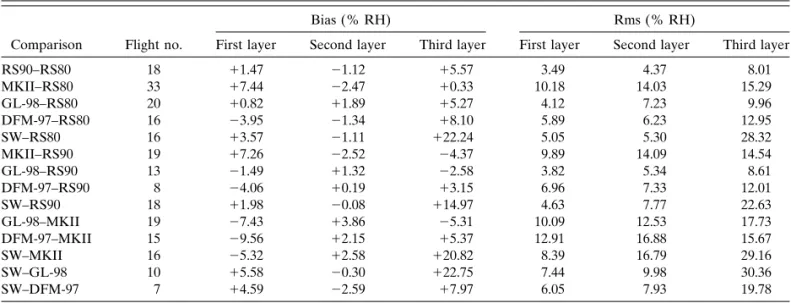
Table 3 shows a quantitative analysis of the bias and rms values (given in percent RH) concerning RS80, and in comparison to the other sensors, as well as of all the possible combinations of the radiosonde sensors. There are not statistics comparing GL-98 and DFM-97 be-cause they were not launched together in any of the flights. The values presented in Table 3 show the fol-lowing.
• RS90 has closer measurements to the other radio-sondes than does RS80. The bias and rms values from RS90 were better for the three analyzed layers, ex-cept for the comparison with the DFM-97 sensor, which presented a smaller tendency in the first layer and a smaller dispersion in the first and second layer, regarding RS80.
• The MKII sensor presented a positive bias and the largest dispersion in the first two layers.
• In the third layer, the SW sensor presented the larg-est tendency and the larglarg-est dispersion in the group comparison.
• In the three layers, the comparisons among the RS80, RS90, and GL-98 sensors presented a smaller ten-dency and dispersion than the other groups.
• Despite the largest bias and dispersion of SW in the third layer, the bias and rms values that were gener-ated in the first and second layer, considering RS80, RS90, and GL-98, were relatively low.
In summary, the values presented in Fig. 4 and Table 3 suggest the following: 1) the RS80 RH sensor presents a tendency to underestimate the humidity in the low and high troposphere and the layer above the latter [Some residues of correction for the RS80 dry bias, as described by Wang et al. (2002), can be present in these results.]; 2) RS90 presents RH values that are more
similar to most sensors available than does RS80; 3) MKII overestimates RH in the low troposphere and presents quite dispersive RH values in the low and me-dium troposphere; 4) RS80, RS90, and GL-98 pre-sented RH values with good agreement in the three layers; and 5) the SW sensor values presented good agreement with these radiosondes below 10 km and the largest tendency and dispersion above this layer.
To evaluate the humidity sensor’s sensitivity to solar radiation heating, the dataset was divided into day- and nighttime periods. This analysis was performed by com-puting the average differences between RS80 and the other radiosondes as a function of the RH. Figure 5 shows the results of these comparisons. One can clearly note that during the night RS80 underestimates the RH in relation to the other radiosondes (except for DFM-97) for higher RH values (larger than 75%). It is worth noting that the difference between the RS80 RH values and the other radiosondes is larger during the night-than during the daytime. For values above 50% during the night- and 70% during the daytime, the measure-ments were close to each other. In this interval the RH values from RS80, RS90, GL-98, and SW (SW only during the night) presented good agreement, around 3% RH, considering the manufacturer’s claim for ac-curacy at high RH, which is 3%, 2%, 5%, and 2%, respectively. Regarding SW, for RH values under those values, the sensor presented a high bias in relation to the measurements of others radiosondes, regardless of the period of day. Solar radiation is an important factor that needs special consideration in the humidity sen-sors’ measurements, and the radiosonde manufactures have studied a strategy to eliminate its effects on RH values (Paukkunen et al. 2001). For instance, there are two types of SW sensors specifically for day- and night-TABLE3. Bias and rms (% RH) for the vertical profile of radiosonde measurements at the three selected layers.
Bias (% RH) Rms (% RH)
Comparison Flight no. First layer Second layer Third layer First layer Second layer Third layer
RS90–RS80 18 ⫹1.47 ⫺1.12 ⫹5.57 3.49 4.37 8.01
MKII–RS80 33 ⫹7.44 ⫺2.47 ⫹0.33 10.18 14.03 15.29
GL-98–RS80 20 ⫹0.82 ⫹1.89 ⫹5.27 4.12 7.23 9.96
DFM-97–RS80 16 ⫺3.95 ⫺1.34 ⫹8.10 5.89 6.23 12.95
SW–RS80 16 ⫹3.57 ⫺1.11 ⫹22.24 5.05 5.30 28.32
MKII–RS90 19 ⫹7.26 ⫺2.52 ⫺4.37 9.89 14.09 14.54
GL-98–RS90 13 ⫺1.49 ⫹1.32 ⫺2.58 3.82 5.34 8.61
DFM-97–RS90 8 ⫺4.06 ⫹0.19 ⫹3.15 6.96 7.33 12.01
SW–RS90 18 ⫹1.98 ⫺0.08 ⫹14.97 4.63 7.77 22.63
GL-98–MKII 19 ⫺7.43 ⫹3.86 ⫺5.31 10.09 12.53 17.73
DFM-97–MKII 15 ⫺9.56 ⫹2.15 ⫹5.37 12.91 16.88 15.67
SW–MKII 16 ⫺5.32 ⫹2.58 ⫹20.82 8.39 16.79 29.16
SW–GL-98 10 ⫹5.58 ⫺0.30 ⫹22.75 7.44 9.98 30.36
time periods (Fujiwara et al. 2003). The solar radiation effects are clearly seen in the day- and nighttime analy-sis, and they are probably responsible for most of this behavior. However, the evaluation of these effects on the RH sensors results requires measurements from other techniques that employ different forms of mea-surement, such as a microwave radiometer (Turner et al. 2003), which were not performed during the experi-ment.
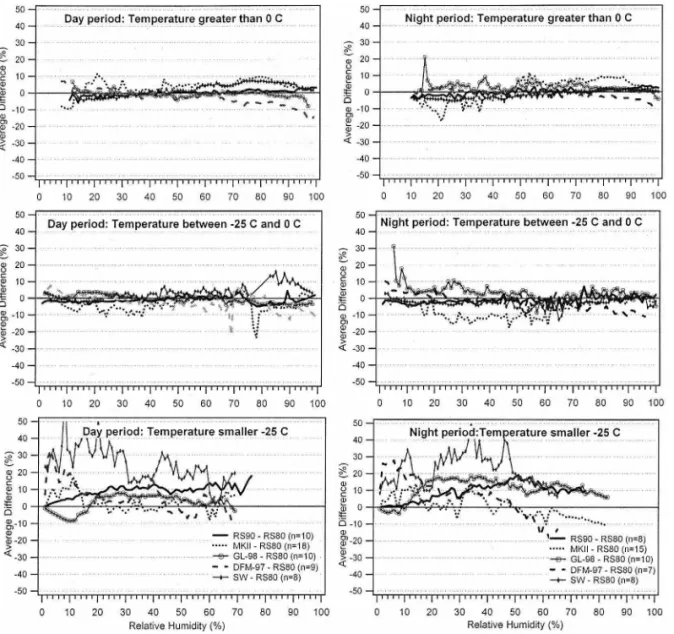
Another analysis evaluated the humidity computa-tions considering the variacomputa-tions of temperature. The temperature variation is related to the maximum amount of humidity that an air portion can have, and it also gives additional information about the humidity sensors. Therefore, temperatures above 0°C were se-lected as one interval, temperatures between⫺25° and 0°C were a second interval, and temperatures lower than⫺25°C were a third interval. Figure 6 shows the average difference as a function of the RS80 values for day- and nighttime periods, considering these selected intervals. Figures 6a and 6b show that for temperatures above⫺25°C during the day, the RS90, RS80, and
GL-98 radiosondes provided values that were very close to each other, with the average difference close to zero. However, for low temperatures, below⫺25°C, a higher disagreement is observed among the radiosondes. Dur-ing the night, under temperatures above⫺25°C, RS80, RS90, and SW measured the humidity very closely and, as shown in Fig. 6d, for temperatures above 0°C and close to 100% of humidity, RS90 presented higher RH mean values. One reason for these high values not ap-pearing during the daytime might be related to the ra-diation factor, which could compensate for possible problems in the humidity sensor of RS90. As was ex-pected, at temperatures below⫺25°C, the radiosondes diverge more than at any other levels. The humidity values computed by MKII and SW presented a high disagreement among the other radiosondes, regardless of the time of day, becoming more pronounced as the temperature decreases.
The integrated water vapor (IWV) total content in the atmosphere was computed, in addition to the sensor analysis. The great disagreement in the RH values pre-sented in the drier layers has smaller significance to FIG. 5. Average difference of RH for day- and nighttime periods as a function of the RS80
IWV values, because it is an integrated measurement and most of the water vapor is concentrated at lower levels. Consequently, the IWV values of different sen-sors are close to each other. The IWV values were cal-culated from a numeric integration of radiosondes’ RH values measured during the experiment for different layers. This analysis was carried out for different atmo-spheric layers. The third layer was subdivided into two layers, one between 8 and 15 km and another above 15 km, which added to the evidence of the dispersion at higher levels.
Figure 7 shows the dispersion diagram among the IWV values from different radiosondes as a function of the RS80 IWV values for the different appraised layers. The IWV values dispersion is gradually larger in the highest layers, as discussed previously. The scales of the different plots of Fig. 7 were variable to facilitate the interpretations of results. Table 4 shows the bias and rms values of the IWV between the humidity sensor of
the evaluated radiosonde and the RS80 humidity sensor for the four appraised layers. Table 5 presents the cor-relation coefficients (R2) of the IWV from other
sen-sors regarding the RS80 IWV values, and their respec-tive slope and interception.
The R2 values indicate that the correlations among
the IWV values are significantly high, mainly in the first three layers. TheR2values are above 0.9 in those first three layers, with the exception of the MKII radio-sonde, which presents slightly lower correlation values. In the fourth layer theR2values indicate a low corre-lation between the MKII, GL-98, and SW sensors. Only RS90 and DFM-97 present a relatively good correlation in this layer, of approximately 0.9.
The tendency and dispersion measurements show that the RS90 and RS80 humidity sensors present the most similar values, mainly in the first two layers, where the humidity concentration is larger. In those layers the correlation factor is quite high, above 0.9 (Table 5), FIG. 6. Average difference of RH for day- and nighttime periods as a function of the RS80 humidity values
and the bias and rms values are relatively low, around
⫺0.8 and 1.1 kg m⫺2 in the first layer, respectively
(Table 4). The MKII sensor presented the smallest cor-relation values with cor-relation to the RS80 sensor. We can note a large tendency and great dispersion, mainly in the first two layers. Considering the whole profile, the rms between the RS80 and MKII IWV values was 4.6 kg m⫺2. This value is 3 times larger than the
disper-sion resulting from the comparison between RS80 and RS90.
The GL-98, DFM-97, and SW sensors, in comparison to the RS80 values, had an intermediate performance compared with those extreme cases. Such sensors pre-sented values with a high correlation and relatively small rms values of 2.2, 2.4 and 2.6 kg m⫺2 for the
GL-98, SW, and DFM-97 sensors, respectively. The GL-97 sensor generated a low bias, in the first layer, when compared with RS80.
The slope values in Table 5 show that MKII, SW, and GL-98 present a similar sensitivity to water vapor
re-garding the RS80 IWV total content. The slope values for these sensors were closer to one (1.003, 0.988, and 0.981, respectively) than were those of RS90 and DFM-97. The slowest interception values were obtained be-tween DFM-97 and RS80, considering the IWV total content.
IWV value analysis during the day- and nighttime periods that were carried out in the ARM experiment, using a microwave radiometer and the RS80 radio-sonde, suggested that daytime radiosondes are typically 3%–4% drier than nighttime radiosondes (Turner et al. 2003). Considering that the RSO experiment did not have an independent humidity measurement using mi-crowave or GPS, this comparison cannot be performed. However, if we consider differences between the tradi-tional radiosonde measurements and SW, which mea-sures humidity in a completely different way (it uses mirrors), and the good performance of SW in the low-ers laylow-ers where most humidity is concentrated, we ob-serve a diurnal drier behavior of the order of 5.9% for FIG. 7. Correlation and scattering diagram of the IWV values in the different layers of the radiosonde profile as
RS80, 4.5% for RS90, 1.4% for MKII, and 7.1% for GL-98. Because the DFM-97 and SW sensors not were launched together during the daytime period these sta-tistics were not calculated.
The largest feature emerging in this RH sensor inter-comparison is the large disagreement between the RH
sensors above 8 km. The largest dispersion was found for the SW. The probable reason for this disagreement is the loss of frost coverage of the SW sensor when crossing the dry layer at higher altitudes, which may generate erroneous measurements in parts of or all of the profile above this layer as discussed by Vömel et al. TABLE4. Bias and rms values of the IWV regarding the RS80 radiosonde in the different layers.*
Layers*
Radiosonde
Flight No.
Statistical measurements
First layer (38.458 kg m⫺2
)**
Second layer (8.741 kg m⫺2
)**
Third layer (0.254 kg m⫺2
)**
Fourth layer (0.008 kg m⫺2
)**
Total content (47.461 kg m⫺2
)**
RS90 18 Bias (kg m⫺2
) ⫹0.787 ⫺0.186 ⫺0.012 ⫹0.003 ⫹0.591
Bias (%) ⫹2.05 ⫺2.13 ⫺4.72 ⫹37.50 ⫹1.25
Rms (kg m⫺2
) 1.124 0.387 0.041 0.005 1.271
Rms (%) 2.92 4.43 16.14 62.50 2.68
MKII 33 Bias (kg m⫺2
) ⫹3.497 ⫺0.159 ⫺0.113 0 ⫹3.229
Bias (%) ⫹9.09 ⫺1.82 ⫺44.49 0 ⫹6.80
Rms (kg m⫺2
) 4.158 1.972 0.218 0.007 4.605
Rms (%) 10.81 22.56 85.83 87.50 9.70
GL-98 20 Bias (kg m⫺2
) ⫹0.578 ⫹0.187 ⫹0.064 ⫺0.004 ⫹0.822
Bias (%) ⫹1.50 ⫹2.14 ⫹25.20 ⫺50.00 ⫹1.73
Rms (kg m⫺2) 1.696 0.542 0.073 0.006 2.202
Rms (%) 4.41 6.20 28.74 75.00 4.64
DFM-97 16 Bias (kg m⫺2)
⫺1.979 ⫺0.279 ⫹0.006 ⫹0.057 ⫺2.194
Bias (%) ⫺5.15 ⫺3.19 ⫹2.36 ⫹712.50 ⫺4.62
Rms (kg m⫺2) 2.198 0.547 0.029 0.112 2.565
Rms (%) 5.72 6.26 11.42 1400.00 5.40
SW 16 Bias (kg m⫺2)
⫹1.725 ⫺0.197 ⫹0.062 ⫹0.025 ⫹1.607
Bias (%) ⫹4.49 ⫺2.25 ⫹24.41 ⫹312.50 ⫹3.39
Rms (kg m⫺2) 2.186 0.594 0.08 0.047 2.413
Rms (%) 5.68 6.80 31.50 587.50 5.08
* First layer is defined as the layer between surface and 3 km, second layer is from 3 to 8 km, third layer is from 8 to 15 km, and fourth layer is above 15 km.
** RH mean value in each layer.
TABLE5. Correlation coefficients of the IWV regarding the RS80 IWV values and their respective slope and interception.
Layers*
Radiosonde Flight No. Coefficients First layer Second layer Third layer Fourth layer Total content
RS90 18 Correlation 0.973 0.994 0.993 0.879 0.976
Slope 0.976 0.973 0.932 1.425 0.939
Intercept 1.663 0.089 0.019 ⫺0.001 3.431
MKII 33 Correlation 0.823 0.896 0.791 0.487 0.867
Slope 1.001 1.104 0.646 0.751 1.003
Intercept 3.455 ⫺1.081 0.016 0.002 3.105
GL-98 20 Correlation 0.947 0.990 0.995 0.461 0.907
Slope 1.249 0.965 1.042 0.270 0.981
Intercept ⫺8.108 0.522 0.043 0.001 1.690
DFM-97 16 Correlation 0.966 0.991 0.990 0.937 0.972
Slope 0.911 0.887 0.949 13.473 0.934
Intercept 1.237 0.704 0.020 ⫺0.072 0.919
SW 16 Correlation 0.942 0.984 0.992 0.581 0.940
Slope 0.926 1.112 1.081 6.582 0.988
Intercept 4.351 ⫺1.246 0.023 0.003 2.169
(2003). These events were quite frequent in the RSO experiment. This happened in almost all the SW flights, causing short disturbances in the RH profile or large dispersion at high altitudes. Figure 8 shows an RH pro-file to illustrate such a problem. This figure evidences the good agreement of the SW RH values below 11 km and larger dispersion above this layer, probably due to the loss of frost-point control.
5. Conclusions
This paper presents a comparison of moisture mea-surements obtained from different sensors launched to-gether on the same balloon. The aim is to evaluate, in a tropical region, the RH measurement performance of radiosondes from different manufacturers, considering aspects of operational usage. The results of this experi-ment show the RH sensors presenting similar results
with a small tendency and low dispersion where humid-ity concentration is larger (up to 3 km). In intermediate layers, from 3 to 8 km, the humidity sensors present a small bias, but a larger dispersion than in the first layer. However, in the layer above 8 km the largest disagree-ment among the humidity measuredisagree-ments is observed, as a result of dispersion and a tendency of the measure-ments to be very high. Although this last layer presents a low-humidity concentration, the radiative effects turn out to have great relevance, because the small mass of water vapor present in those layers has a great impact on infrared radiation absorption. Considering this fact, more sophisticated mechanisms should be used to evaluate the humidity measurement qualities in the at-mosphere’s high layers, such as employing different types of instruments to measure humidity. Experiments using such procedures should be carried out in the fu-ture with the objective of providing improvements in the sensors’ sensitivity to the small masses of water vapor and low temperatures that are typical of the high troposphere.
In the lower troposphere the different RH sensors have shown good agreement. The good performance of the SW chilled-mirror hygrometer sensor in the tropo-sphere was demonstrated by Fujiwara et al. (2003) and Wang et al. (2003a). Similarly, the RS90 RH sensor presents new measurement technology, which employs two heated humidity elements, and it has improved sounding accuracy (Paukkunen et al. 2001). The more sophisticated mechanisms employed by these sensors may explain the low dispersion and tendency found be-tween the SW and the RS90 RH sensors in the first layers. If one considers those measurements as a refer-ence, it can be verified that the MKII sensor overesti-mates the humidity values in the first layer, while the DFM-97, RS80, and GL-98 sensors tend to underesti-mate the humidity. Among these, the DFM-97 radio-sonde is the one that presents the largest tendency to underestimate the measurements, while RS80 and GL-98 present quite close values to the RS90 in that layer. In the analysis for the day- and nighttime periods, it was observed that the sensors yielded more similar measurements during the daytime period and smaller bias values when the RH was high. The largest tenden-cies, in both day- and nighttime periods, were gener-ated when the temperature was below⫺25°C.
The integrated water vapor (IWV) values presented small dispersion and small tendency, with the exception just of the MKII sensor. The RS80 and RS90 sensors presented more similar results, with an rms of only 1.3 kg m⫺2. The SW sensor presented low dispersion in the
IWV values because the largest dispersion in the hu-midity values found for this sensor occurred in the high FIG. 8. An RH profile from the RS80, RS90, MKII, GL-98, and
levels, where the atmospheric water vapor amount is small.
Acknowledgments.Many Institutions supported this experiment. The Word Meteorological Organization (WMO) and the Brazilian National Meteorological In-stitute (INMET) were the main institutions to support this RSO intercomparison. The Fundação de Amparo à Pesquisa do Estado de São Paulo (FAPESP) also con-tributed with financial support, through grants 2000/ 15124-7 and 2001/12761-9; as did the Brazilian Air Force, with CLA representatives, the Aerospace Tech-nical Center (CTA), and the Diretoria de Eletrônica e Proteção ao Vôo (DECEA); the National Weather Ser-vice from the United States; MeteoFrance; NASA; and the Met Office. Technical contributions were provided from Frank Schmidlin from NASA Wallops, who pro-vided very useful suggestions for the experiment; John Nash, who provided the Snow White–processed data; and, finally, the radiosonde manufactures: Graw Radio-sondes GmbH & Co., KG, from Germany, MODEM from France, Sippican, Inc., from the United States, Vaisala Oyj from Finland, and Meteolabor from Swit-zerland. We wish to thank all these organizations and individuals very much, as well as their representatives, for collaborating with this very successful joint effort.
REFERENCES
Fujiwara, M., M. Shiotani, F. Hasebe, H. Vömel, S. J. Oltmans, P. W. Ruppert, T. Horinouchi, and T. Tsuda, 2003: Perfor-mance of the Meteolabor “Snow White” chilled-mirror hy-grometer in the tropical troposphere: Comparisons with the Vaisala RS80 A/H-Humicap sensors. J. Atmos. Oceanic Technol.,20,1534–1542.
Guichard, F., D. Parsons, and E. Miller, 2000: Thermodynamic and radiative impact of the correction of sounding humidity bias in the Tropics.J. Climate,13,3611–3624.
Holton, I. R., 1992:An Introduction to Dynamic Meteorology. 3d ed. Academic Press, 507 pp.
Ivanov, A., A. Kats, S. Kurnosenko, J. Nash, and N. Zeitseva, 1991: WMO international radiosonde comparison, Phase 3. WMO Instruments and Observing Methods Rep. 40, 135 pp. Miller, E. R., J. Wang, and H. L. Cole, 1999: Correction for dry bias in Vaisala radiosonde RH data.Proc. Ninth Atmospheric Radiation Measurement (ARM) Science Team Meeting,San Antonio, TX, U.S. Department of Energy, 99. [Available on-line at http://www.arm.gov/publications/proceedings/conf09/ abstracts/miller-er-99.pdf.]
Miloshevich, L. M., H. Vömel, A. Paukkunen, A. J. Heymsfield, and S. J. Oltmans, 2001: Characterization and correction of relative humidity measurements from Vaisala RS80-A
radio-sondes at cold temperatures.J. Atmos. Oceanic Technol.,18,
135–156.
Paukkunen, A., V. Antikainen, and H. Jauhiainen, 2001: Accu-racy and performance of the new Vaisala RS90 radiosonde in operational use. Preprints,11th Symp. on Meteorological Ob-servations and Instrumentation, Albuquerque, NM, Amer. Meteor. Soc., 98–103.
Revercomb, H. E., and Coauthors, 2003: The ARM program’s water vapor intensive observation periods: Overview, initial accomplishments, and future challenges.Bull. Amer. Meteor. Soc.,84,217–236.
Schmidlin, F. J., 2005: Report of the WMO radiosonde relative humidity sensor intercomparison: Phase II, 8–26 September 1995.Instruments and Observing Methods,WMO, in press. Silveira, R., G. Fisch, L. A. T. Machado, A. M. J. Dall’Antonia,
L. F. Sapucci, D. Fernandes, and J. Nash, 2003: Intercompari-son of GPS radioIntercompari-sondes—Executive summary. WMO Rep. IOM–76, TD 1153, 15 pp. [Available online at http:// www.wmo.ch/web/www/IMOP/publications/IOM-76-GPS-RSO/Intercomp-RSO-Brazil2001-ExecSummary.pdf.] Turner, D. D., B. M. Lesht, S. A. Clough, J. C. Liljegren, H. E.
Revercomb, and D. C. Tobin, 2003: Dry bias and variability in Vaisala RS80-H radiosondes: The ARM experience.J. At-mos. Oceanic Technol.,20,117–132.
Vömel, H., M. Fujiwara, M. Shiotani, E. Hasebe, S. J. Oltmans, and J. E. Barnes, 2003: The behavior of the Snow White chilled-mirror hygrometer in extremely dry conditions.J. At-mos. Oceanic Technol.,20,1560–1567.
Wang, J., H. L. Cole, D. J. Carlson, and A. Paukkunen, 2001: Performance of Vaisala RS80 radiosonde on measuring up-per-tropospheric humidity after corrections. Preprints, 11th Symp. on Meteorological Observations and Instrumentation, Albuquerque, NM, Amer. Meteor. Soc., 94–97.
——, ——, ——, E. R. Miller, K. Beierle, A. Paukkunen, and T. K. Laine, 2002: Corrections of humidity measurement er-rors from the Vaisala RS80 radiosonde—Application to TOGA COARE data.J. Atmos. Oceanic Technol.,19,981– 1002.
——, ——, D. B. Parsons, T. F. Hock, D. Lauritsen, H. L. Cole, K. Beierle, and E. Chamberlain, 2003a: Performance of opera-tional radiosonde humidity sensors in direct comparison with a chilled mirror dew-point hygrometer and its climate impli-cation. Geophys. Res. Lett., 30, 1860, doi:10.1029/ 2003GL016985.
——, T. F. Hock, D. Lauritsen, H. L. Cole, K. Beierle, N. Cham-berlain, D. B. Parsons, and D. J. Carlson, 2003b: A reference radiosonde system for improving water vapor measurement in IHOP_2002. Preprints,Observing and Understanding the Variability of Water in Weather and Climate, Long Beach, CA, Amer. Meteor. Soc., CD-ROM, J3.5.
Weckwerth, T. M., and Coauthors, 2004: An overview of the In-ternational H2O Project (IHOP_2002) and some preliminary
highlights.Bull. Amer. Meteor. Soc.,85,253–277.