ANA CLARA BAIÃO MENEZES
USE OF 15N TO ESTIMATE MICROBIAL CONTAMINATION AND PROTEIN DEGRADATION OF CONCENTRATE FEEDS AND THE EFFECT OF DECREASING DIETARY CRUDE PROTEIN ON METHANE
EMISSION AND NITROGEN LOSSES IN NELLORE BULLS
Thesis submitted to the Universidade Federal de Viçosa as partial fulfillment of the requirements of the Animal Science Graduate Program for the degree of Magister Scientiae
VIÇOSA
Ficha catalográfica preparada pela Biblioteca Central da Universidade Federal de Viçosa - Câmpus Viçosa
T
Menezes, Ana Clara Baião, 1991-M543u
2016
Use of 15N to estimate microbial contamination and protein degradation of concentrate feeds and the effect of decreasing dietary crude protein on methane emission and nitrogen losses in Nellore bulls / Ana Clara Baião Menezes. – Viçosa, MG, 2016. xi, 89f. : il. ; 29 cm.
Orientador: Sebastião de Campos Valadares Filho.
Dissertação (mestrado) - Universidade Federal de Viçosa. Inclui bibliografia.
1. Bovino - Nutrição animal. 2. Proteína na nutrição animal. 3. Bovino - Digestão. 4. Digestibilidade. 5. Rúmen.
I. Universidade Federal de Viçosa. Departamento de Zootecnia. Programa de Pós-graduação em Zootecnia. II. Título.
ANA C L A R A BAIÃO M E N E Z E S
USE O F T O E S T I M A T E M I C R O B I A L CONTAMINATION AND P R O T E I N D E G R A D A T I O N O F C O N C E N T R A T E F E E D S AND T H E E F F E C T O F D E C R E A S I N G D I E T A R Y C R U D E P R O T E I N ON M E T H A N E
EMISSION AND N I T R O G E N L O S S E S IN N E L L O R E B U L L S zyxwvutsrqponmlkjihgfedcbaZYXWVUTSRQPONMLKJIHGFEDCBA
Thesis submitted to the Universidade Federal de Viçosa as partia! fulfillment of the requirements of the Animal Science
Graduate Program for the degree of zyxwvutsrqponmlkjihgfedcbaZYXWVUTSRQPONMLKJIHGFEDCBA Magister Scientiae
Approved: February, 16, 2016.
ii “You can judge a man's true character by the way he treats his fellow animals.”
iii AKNOWLEDGEMENT
I would like to say thanks to my parents, José Menezes and Terezinha Baião Menezes, for emotional support, believing in me and in my dreams and by their constant prayers to me. You are my inspiration.
Also, I would like to thank Sebastião de Campos Valadares Filho, my adviser since I was a scholarship member of his lab. I have learned a lot about ruminants nutrition with him. He is, beyond a great researcher, a great inspiration for my professional life.
Thanks Marcos Vinicius Carneiro Pacheco (Pretinho) for his help during the experiment, for the emotional support and advices, I love you.
Thanks my friends Luiz Fernando and Polyana. You are an example of friendship, couple and great researchers, thanks for all help and advices that you give me.
ThanksJéssica, a little sister that I won in Viçosa, for your friendship.
Also, I would like to thank Edenio Detmann, Mário Luiz Chizzotti, Luciana Navajas Rennó, and Stefanie Alvarenga Santos, for their help, advice, and collaboration in this important step throughout my M.S. training.
Thanks to the Animal Science Department of the Universidade Federal de Viçosa where I had the opportunity to develop a passion for science and to open a door to the infinite wealth of knowledge.
I thanks my fellow labmates and interns in the Animal Laboratory: Zanetti, Breno, Pauliane, Herlon, Flávia, Letícia, Amanda, Cíntia, Maisa, Giseli, Mariana, and Everton. Thanks by the friendly help of Juana, Marcinha, Anne, William, Janaúba, Tayane, Jarbas, Maurício, Dario, Gutierrez, and Débora.
Thanks to the staffs from Animal Science Departament: Pum, Niel, Zezé, Marcelo Cardoso, Vanor, Joélcio, Rodrigo, Ray, Plinio, Fernando, Monteiro, Juliana, Aline, and Mário.
Thanks for all the animals used on this work whose I developed a special affection for each one.
Thanks for the strayed dogs that I have taken care: Rajah, Feninho, Neguinha e Pretinha, you always make my days happy! This is a pure love, that only dogs have.
iv BIOGRAPHY
Ana Clara Baião Menezes, daughter of José Menezes and Terezinha Baião Menezes, was born in Ubá, Minas Gerais – Brazil on June 2, 1991.
She started bachelor´s degree in Animal Science at the Universidade Federal de Viçosa in 2009 and obtained Bachelor of Science in Animal Science in March of 2014.
v SUMMARY
ABSTRACT………... vi
RESUMO………ix
INTRODUCTION………1
REFERENCES .………...4
CHAPTER 1 - DOES MICROBIAL CONTAMINATION AFFECT THE RUMINAL PROTEIN DEGRADATION OF CONCENTRATE? ABSTRACT ……….. 10
INTRODUCTION ………... 12
MATERIAL AND METHODS ………... 13
RESULTS ………..……….... 21
DISCUSSION ………... 23
CONCLUSION ………. 27
REFERENCES ……….. 28
CHAPTER 2 - DOES A REDUCTION IN DIETARY CRUDE PROTEIN CONTENT AFFECT PERFORMANCE, NUTRIENT REQUIREMENTS, NITROGEN LOSSES, AND METHANE EMISSIONS IN FINISHING NELLORE BULLS? ABSTRACT ……….. 43
INTRODUCTION ………. 44
MATERIAL AND METHODS ………. 45
RESULTS AND DISCUSSION ……… 55
CONCLUSION ………. 56
vi ABSTRACT
MENEZES, Ana Clara Baião, M.Sc., Universidade Federal de Viçosa, February of 2016. Use of 15N to estimate microbial contamination and protein degradation of concentrate feeds and the effect of decreasing dietary crude protein on methane emission and nitrogen losses in Nellore bulls. Adviser: Sebastião de Campos Valadares Filho. Co-advisers: Edenio Detmann and Mario Luiz Chizzotti.
This study was developed based on two experiments conducted on the feedlot and
Animal Laboratory of Animal Science Department of Universidade Federal de Viçosa,
and the results are shown in two chapters. The aim of the first study was to use 15N to
estimate the microbial contamination (MC) of crude protein (CP) fractions that were
soluble (a) as well as insoluble but potentially degradable (b), and the digestion rate
of fraction b (kd), as well as to determine the incubation time necessary to estimate
the rumen degradable protein (RDP) of energy and protein feeds when considering
two outflow rates (0.05 h-1 and 0.08 h-1). Twelve types of feeds were evaluated, with
six energy concentrates: wheat bran, rice meal, ground corn, ground sorghum, ground
corn cob, and soybean hulls; and six protein concentrates: cottonseed meal 38% CP,
soybean meal, ground bean, peanut meal, sunflower meal, and corn gluten meal. The
feeds were divided into 4 groups and were incubated in the rumens of 4 crossbred
bulls. The feed samples were incubated for 0, 2, 4, 8, 16, 24, 48, and 72 h. To determine
the MC of the incubated residues, ruminal bacteria were labeled with 15N via
continuous intraruminal infusion of 15(NH4)2SO4. Ruminal digesta were collected for
the isolation of bacteria before the first infusion of 15N during the acclimation period,
and after the infusion of 15N during the collection period. There was no difference (P
> 0.05) in the parameters a, b, and kd, corrected and uncorrected, for all feeds that
were evaluated. All of the feed tests followed an exponential model of degradation and
the model fitted well to the data, except for corn gluten meal, probably because the
vii accurate estimation of the degradation profile. The cluster analysis (R² = 0.944)
allowed for the grouping of feeds into three different groups according to the necessary
incubation time to estimate RDP. The first was formed by the high-starch energy
concentrates (15.4 ± 0.46 h), the second by the low-starch energy concentrates (6.8 ±
0.60 h), and the third by the protein concentrates (9.9 ± 0.41) while considering a kp
of 0.05h-1. In conclusion, the microbial contamination was low and non-significant;
therefore, correction of ruminal protein degradation is irrelevant with regards to the
concentrate that was studied. However, the chemical composition of this feeds resulted
in different incubation times to estimate RDP content, and this has to be taken into
account in the techniques that are used to determine CP digestibility in the rumen and
intestines. The aim of the second experiment was to evaluate whether a reduction in
dietary crude protein (CP) content affects animal performance, energy and protein
requirements, N losses, and enteric methane emission in finishing Nellore bulls.
Twenty-six animals, with an average age of 20 ± 1.0 months and initial body weight
(BW) of 296 ± 8.1 kg were used in this experiment. Four animals were used as baseline
reference animals and were slaughtered at the beginning of the experiment. Four
animals were fed at maintenance level (MAIN), whereas 18 bulls were divided into 3
groups (n = 6 in each group) and were randomly assigned to the treatments consisting
of three levels of CP in the diets: 10, 12, and 14% of CP. At the end of the experiment,
all animals were slaughtered to evaluate their chemical body composition, energy and
protein requirements, and carcass characteristics. A linear effect was observed for
dietary CP level on CP intake and digestibility, while greater values were obtained for
animals that were fed 14% CP. Nitrogen metabolism was affected by CP levels, where
animals that were fed 12 and 14% CP had greater urinary N losses than those that were
viii carcass characteristics among diets, and there was no effect of CP level on microbial
efficiency and CH4 emissions. Thus, this study showed that for finishing bulls, the
level of dietary CP did not interfere with muscle deposition and greenhouse gas
emissions. The reduction of CP content in diets does not affect DM intake, animal
performance, and carcass characteristics, thereby suggesting that the use of 10% of CP
in diets for finishing bulls reduces their environmental impact due to a lower urinary
N excretion than 12 and 14% CP-based diets. Animals that were fed 10, 12, and 14%
CP diets had emissions equivalent to 3,893; 3,755; and 4,255 g d-1 of CO2, respectively,
and no difference was observed among diets. Furthermore, methane emission is not
affected by CP levels ranging between 10 to 14% which, on average, is 16.3 g kg-1 of
DM intake. Our study found that a decreased CP level did not influence animal
performance, but it did decrease N losses in manure without affecting methane
emissions. However, it is important to highlight that more studies are necessary to
ix RESUMO
MENEZES, Ana Clara Baião, M.S., Universidade Federal de Viçosa, Fevereiro de 2016. Uso do 15N para estimar a contaminação microbiana e a degradação proteica de alimentos concentrados e o efeito da redução dos níveis de proteína bruta na dieta de machos Nelore não castrados sobre a emissão de metano e excreção de nitrogênio. Orientador: Sebastião de Campos Valadares Filho. Coorientadores: Edenio Detmann e Mário Luiz Chizzotti.
Este trabalho foi desenvolvido baseado em 2 experimentos conduzidos no
confinamento experimental do laboratório animal do Departamento de Zootecnia da
Universidade Federal de Viçosa, e os resultados são mostrados em dois capítulos. O
objetivo do primeiro experimento foi utilizar o 15N para estimar a contaminação
microbiana (CM) das seguintes frações da proteína bruta (PB): fração solúvel (a),
insolúvel potencialmente degradável (b) e a taxa de digestão da fração b (kd). Assim
como determinar os tempos de incubação necessários para estimar a proteína
degradável no rúmen (PDR) de concentrados energéticos e proteicos, considerando
duas taxas de passagem (0,05 h-1 e 0,08 h-1). Doze alimentos foram avaliados, sendo
seis concentrados energéticos (farelo de trigo, farelo de arroz, fubá de milho, sorgo
moído, milho desintegrado com palha e sabugo e casca de soja) e seis concentrados
proteicos (farelo de algodão 38% PB, farelo de soja, feijão moído, farelo de amendoim,
farelo de girassol e farelo de glúten de milho). Os alimentos foram divididos e quatro
grupos e incubados no rúmen de quatro touros fistulados. Os alimentos foram
incubados por 0, 2, 4, 8, 16, 24, 48 e 72 horas. Para determinar a CM dos resíduos
incubados, as bactérias ruminais foram marcadas com 15N através de infusões ruminais
contínuas de 15(NH4)2SO4. Digesta ruminal foi coletada para isolamento de bactéria
antes da primeira infusão de 15N, durante o período de adaptação, e após a infusão de 15N nos períodos de coleta. Não foi observada diferença (P > 0,05) nos parâmetros a,
b e kd corrigidos e sem correção para todos os alimentos avaliados. Todos os alimentos
x Provavelmente porque o tempo máximo de incubação utilizado (72 horas) não foi
longo o suficiente para permitir uma estimativa acurada do perfil de degradação. A
análise cluster (R² = 0.944) permitiu agrupar os alimentos em três diferentes grupos de
acordo com o tempo necessário parra estimar a PDR. O primeiro grupo foi formado
por concentrados energéticos com alto teor de amido (15.4 ± 0.46 h), o segundo por
concentrados energéticos com baixo teor de amido (6.8 ± 0.60 h) e o terceiro por
concentrados proteicos (9.9 ± 0.41), considerando taxa de passagem de 0,05 h-1. Como
conclusão, a contaminação microbiana foi baixa e não significativa, assim a correção
da degradação proteica torna-se irrelevante para os concentrados utilizados neste
estudo. No entanto a composição química dos alimentos resultou em diferentes tempos
de incubação para estimar o conteúdo de PDR, e isto precisa ser levado em
consideração nas técnicas utilizadas para estimar a digestibilidade ruminal e intestinal
da PB. O objetivo do segundo experimento foi avaliar se a redução nos níveis de
proteína bruta (PB) da dieta afeta o desempenho animal, exigências de energia e
proteína, perdas nitrogenadas e emissão de metano entérico em machos Nelore não
castrados na fase de terminação. Vinte e seis animais com idade média de 20 ± 1 mês
e peso corporal inicial de 296 ± 8,1 kg foram utilizados neste experimento. Quatro
animais foram designados ao grupo referência, sendo abatidos ao início do
experimento. Quatro animais foram alimentados a nível de mantença, enquanto
dezoito animais foram divididos em três grupos (n = 6 em cada grupo), e foram
aleatoriamente designados a tratamentos consistindo de três níveis de PB na dieta: 10,
12 e 14% de PB. Ao final do experimento todos os animais foram abatidos para
determinação de sua composição química corporal, exigências de energia e proteína e
características de carcaça. Foi observado efeito linear do nível de PB da dieta sobre o
xi alimentados com 14%PB. O metabolismo do nitrogênio foi afetado pelos níveis de PB,
onde animais alimentados com 12 e 14 % PB tiveram maior excreção urinaria de N
que aqueles alimentados com 10% PB. Não houve efeito do nível de PB dietético sobre
retenção de N, desempenho animal e características de carcaça, e também não foi
observado efeito do nível de PB da dieta sobre a eficiência microbiana e emissão de
CH4. Este estudo mostrou que para bovinos em terminação o nível de PB da dieta não
influencia a deposição muscular e a emissão de gases do efeito estufa. A redução do
nível de PB das dietas não afetou o consumo de MS, desempenho e características de
carcaça, sugerindo que o uso de 10% PB em dietas de terminação reduz o impacto
ambiental devido a menor excreção urinária de N que dietas de 12 e 14% PB. Animais
alimentados com 10, 12 e 14% de PB nas dietas tiveram emissões de 3.893, 3.755 e
4.255 g/d de equivalente CO2 respectivamente e não foram observadas diferenças entre
as dietas. Além disso a emissão de metano não foi afetada por níveis de PB da dieta
variando entre 10 e 14%, sendo em média igual a 16,3 g/kg do consumo de MS. Este
estudo mostrou que a redução do nível de PB da dieta não influenciou o desempenho
animal e reduziu as perdas nitrogenadas nas fezes e urina sem afetar a emissão de
metano. Porém é importante destacar que mais estudos são necessários para confirmar
1 INTRODUCTION
In situ methods are widely used to estimate the ruminal degradability of crude protein (CP), but an important source of errors in this method is the microbial
contamination (MC) of the residual particles of incubated feeds, resulting in
underestimation of CP degradability (Wulf and Südekum, 2005), as well as
overestimation of the ruminal undegradableprotein (RUP) content.
As 15N is not naturally found in protein of feeds, it is widely used as a microbial
marker. The 15N can be incorporated by fertilization of cultivated feeds with
ammonium sulfate enriched with 15N (Wanderley et al., 1993; Kamoun et al., 2007) or
by ruminal infusion (Dixon and Chanchai., 1999; Machado et al., 2013; Rotta et al.,
2014).
There are few data in the literature regarding the effect of MC in the in situ
evaluation of concentrate feeds, and they are controversial. Most authors evaluated one
(González et al., 2006; Stefánski et al., 2013) or few feeds (Rodríguez et al., 2008;
Arroyo and González, 2011), and most of them did not evaluate only concentrate.
Researches developed on Brazil by Machado et al (2013) showed that MC is an
important source of errors for tropical forages; these authors also concluded that
protein and fiber level influence the dimension of contamination. González et al.
(1998) and Wanderley et al. (1993) also showed that the chemical composition of feeds
could influence the dimension of MC.
In Brazil, most of feedlots use 79% of concentrate in finishing diets (Oliveira
and Millen., 2014). Corn, sorghum, soybean hulls, soybean meal, sunflower meal and
cottonseed meal are the main ingredients used to formulate diets, so it is important to
know the availability of rumen degradable protein (RDP) of these feeds. Inadequate
2 associative effects on fiber digestion that may result in “energy spilling” (Van Kessel
and Russell, 1996; Klevesahl et al., 2003) and decreased microbial efficiency (Hoover
and Stokes, 1991). So, the knowledge about RDP content and its availability on
ruminal environment is important to attempt maximize the synthesis of microbial
protein.
The mobile nylon bag technique consists in ruminal incubation of 16 h to
access RDP content and consequently RUP content, to simulate intestinal digestibility
(Casamiglia and Stern., 1995; Paz et al., 2014). But the use of a same incubation time
for different feedstuffs can overestimate or underestimate the intestinal digestibility.
Accurate prediction of N supply is important to reach the requirements of
rumen microflora and minimize feed costs and N waste (Brooks et al., 2012). The
environmental impact of feeding animals in feedlots is a growing concern (Cole et al.,
2006; Patra and Lalhriatpuii., 2016). Most of nutrients that are absorbed from feeds to
feedlots are excreted as feces and urine, and cattle commonly retain only 10 to 20% of
their nutrient intake (McBride et al., 2003). In addition, between thirty to fifty percent
of N from feedstuffs may be lost via volatilization, mainly in the form of ammonia
(Bierman et al., 1999; Todd et al., 2005), and this amount of ammonia can be affected
by dietary crude protein (CP) level (Burgos et al., 2010). Furthermore, protein is
considered to be the most expensive nutrient in a ruminant diets (Russell et al., 1992).
Thus, unbalanced diets contribute to negative environmental impacts and represent
significant economic losses.
According to the NRC (1996), CP requirements decrease during the finishing
phase, however according to Oliveira and Millen (2014), Brazilian feedlots adopt up
to 16.6% CP in their diets for finishing cattle to stimulate DM intake and to slaughter
3 In addition, The Food and Agriculture Organization of the United Nations
(FAO) reported that greenhouse gas emissions from livestock sector represent 14.5%
of global human-induced greenhouse gas emissions and that the emissions from beef
production represent 41% of sector’s (Gerber et al., 2013).
Methane emissions (CH4) by livestock may be affected by diet, genetic,
individual differences among animals, which corresponds to 15 to 20% of human
activities (Martin et al., 2008). Recent studies have demonstrated higher dietary protein
contents are related to improved dry matter (DM) intake (Berends et al., 2014) and
increased feed intake causes an increase in CH4 production (Shibata and Terada., 2010;
Chaokaur et al., 2015).
Methane production was positively related to diet digestibility and negatively
related to dietary fat concentration, whereas dietary carbohydrate composition had
only minor effects (Chianese et al., 2009). Production of CH4 has a negative impact on
animal productivity, resulting in energy losses ranging from 2% to 12% of the animal’s
gross energy intake (Ramin and Huhtanen., 2013; Haarlem et al., 2008). So, reduce
CH4 emissions is an important way to decrease environmental pollution and minimize
energy losses.
Thus, on the first experiment we hypothesized that MC is not relevant in
concentrate feeds and it may not affect the estimated CP degradability; also, the
incubation time necessary to estimate RDP may vary between feeds. In this way, our
objectives were to use 15N to estimate the MC of crude protein fractions that are soluble
(a) and insoluble but potentially degradable (b) and the rate of digestion of the fraction
b (kd), as well as to quantify the necessary incubation time to estimate RDP of energy
and protein concentrates. On the second experiment we hypothesized that reducing CP
4 performance, and the objectives were to evaluate how the reduction in dietary CP
contents affects animal performance, nutrient requirements, nitrogen losses, and
methane emissions in finishing Nellore bulls.
Chapters 1 and 2 were writing according to the guidelines of Animal Journal
and Journal of Agriculture, Ecosystems and Environmental, respectively.
REFERENCES
Arroyo, J., and J. González. 2011. Effects of the ruminal comminution rate and
microbial contamination of particles on accuracy of in situ estimates of ruminal
degradability and intestinal digestibility of feedstuffs. J. Anim. Physiol. Anim.
Nutr. 97:119–118.
Berends, H., Van der Borne, J. J. G. C., Røjen, B. A., Hendriks, W.H., Gerrits, W. J.
J. 2014. Effect of protein provision via milk replacer or solid feed on protein
metabolism in veal calves. J. Dairy Sci. 98: 1119-1126.
Bierman, S., Erickson, G. E., Klopfenstein, T. J., Stock, R. A., and Shain, D. H. 1999.
Evaluation of nitrogen and organic matter balance in the feedlot as affected by
level and source of dietary fiber. J. Anim. Sci. 77: 1645–1653.
Brooks, M.A., Harvey, R.M., Johnson, N.F., Kerley, M.S. 2012. Rumen degradable
protein supply affects microbial efficiency in continuous culture and growth in
steers.J. Anim. Sci. 90:4985–4994.
Burgos, S.A., Embertson, N.M. Zhao, Y., DePeters, E.J., Fadel, J.G. 2010. Prediction
of ammonia emission from dairy cattle manure based on milk urea nitrogen:
5 Casamiglia, S., Stern, M.D. J. 1995. A Three-Step In Vitro Procedure for Estimating
Intestinal Digestion of Protein in Ruminants1J. Anim. Sci. 73:1459-1465.
Chaokaur, A., Nishida, T., Phaowphaisal, I., Sommart, K. 2015. Effects of feeding
level on methane emissions and energy utilization of Brahman cattle in the tropics.
Agric. Ecosyst. Environ. 199: 225-230.
Chianese, D.S., Rotz, C.A. and Richard, T.L. 2009. Simulation of Methane Emissions
from Dairy Farms to Assess Greenhouse Gas Reduction Strategies. Transactions
of the ASABE. 52:1313-1323.
Cole, N. A., Defoor, P. J., Galyean , M. L., Duff, G. C. and Gleghorn, J. F. 2006.
Effects of phase-feeding of crude protein on performance, carcass
characteristics, serum urea nitrogen concentrations, and manure nitrogen of
finishing beef steers. J. Anim. Sci. 84: 3421–3432.
Dixon, R.M., Chanchai, S. 1999. Colonization and source of N substrates used by
microorganisms digesting forages incubated in synthetic fibre bags in the rumen.
Anim. Feed Sci.Technol. 83: 261-272.
Gerber, P.J., Steinfeld, H., Henderson, B., Mottet, A., Opio, C., Dijkman, J., Falcucci,
A., Tempio, G. 2013. Tackling Climate Change Through Livestock–A Global
Assessment of Emissions and Mitigation Opportunities. Food and Agriculture
Organization of the United Nations (FAO), Rome.
González, J., C. A. Rodríguez, S. G. Andrés, and M. R. Alvir. 1998. Rumen
degradability and microbial contamination of fish meal and meat meal measured
by the in situ technique. Anim. Feed Sci. Technol. 73:71–84.
Gonzáles, J.C., Ouarti. M., Rodríguez, C.A., Alvir, M.R. 2006. Effects of considering
6 in situ studies of feed protein degradability in ruminants. Anim. Feed Sci. Technol.
125: 89–98.
Haarlem Van, R.P., Desjardins, R.L., Gao, Z., Flesch, T.K. and Li, X. 2008. Methane
and Ammonia Emissions from a Beef Feedlot in Western Canada for a
Twelve-Day Period in The fall. Can. J. Anim. Sci. 88: 641-649.
Hoover,W. H, Stokes S. R. 1991. Balancing carbohydrate and protein for optimum
rumen microbial yield. J Dairy Sci. 74: 3630–3644.
Kamoun, M., López, S., Beckers, Y., Lecomte, P., Francois, E., Théwis, A. 2007.
Anim. Feed Sci. Technol. 135: 353–361.
Klevesahl, E. A., R. C. Cochran, E. C. Titgemeyer, T. A. Wickersham, C. G. Farmer,
J. I. Arroquy, and D. E. Johnson. 2003. Effect of a wide range in the ratio of
supplemental rumen degradable protein to starch on utilization of low-quality,
grass hay by beef steers. Anim. Feed Sci. Technol. 105:5–20.
Machado, P. A. S., Valadares Filho, S. C., Detmann, E., Santos, S. A., Valadares, R.
F. D., Ducatti, C., Rotta, P. P., Costa e Silva, L. F. 2013. Development of equations
to estimate microbial contamination in ruminal incubation residues of forage
produced under tropical conditions using 15N as a label. J. Anim. Sci. 91: 3836–
3846.
Martin, C., Rouel, J., Jouany, J. P., Doreau, M., Chilliard, Y. 2008. Methane output
and diet digestibility in response to feeding dairy cows crude linseed, extruded
linseed, or linseed oil. J. Anim. Sci. 86: 2642-2650.
McBride, K. W., Greene, L. W., Cole, N. A., McCollum, F. T., Galyean, M. L. 2003.
Nitrogen and phosphorus utilization in beef cattle fed three levels of dietary crude
protein and three degradable intake protein/undegradable intake protein ratios. J.
7 NRC, 1996. Nutrient requirements of beef cattle. 7th ed. Natl. Acad. Sci., Washington,
DC, USA.
Oliveira, C. A., Millen, D.D. 2014. Survey of the nutritional recommendations and
management practices adopted by feedlot cattle nutritionists in Brazil. Anim. Feed
Sci. Techol. 197:64-75.
Patra, A. K., Lalhriatpuii, M. 2016. Development of statistical models for prediction
of enteric methane emission from goats using nutrient composition and intake
variables. Agri. Ecossyst. Environ. 215: 89-99.
Paz, H. A., Klopfenstein, 1 T. J., Hostetler, D., Fernando S. C., Castillo-Lopez, E.,
Kononoff, P. J. 2014. Ruminal degradation and intestinal digestibility of protein
and amino acids in high-protein feedstuffs commonly used in dairy diets. J. Dairy
Sci. 97:6485–6498.
Ramin, M. and Huhtanen, P. 2013. Development of Equations for Predicting Methane
Emissions from Ruminants. J. Dairy Sci. 96: 2476-2493.
Rodríguez, C.A., González, J., Alvir, M.R., Caballero, R. 2008. Effects of feed intake
on in situ rumen microbial contamination and degradation of feeds. Livestock
Science 116: 108–117.
Rotta, P. P., Valadares Filho, S. C. Costa e Silva, L. F., Detmann, E., Villadiego, F.
A. C., Engle, T. E., Valadares, R. F. D., Silva, B. C., Pacheco, M. V. C., Zanetti,
D. 2014. Comparison of purine bases and 15N for quantifying microbial nitrogen
yield using three marker systems and different sampling sites in zebu crossbreed
bulls. Livest. Sci. 167: 144-153.
Russell, J.B., O'connor, J.D., Fox, D.G., Van Soest, P.J., Sniffen, C.J., 1992. A net
carbohydrate and protein system for evaluating cattle diets. I - Ruminal
8 Shibata, M., Terada. F. 2010. Factors affecting methane production and mitigation in
ruminants. J. Anim. Sci. 81: 2-10.
Stefánski, T., Ahvenjärvi, S., Huhtanen, P., Shingfield, K.J. 2013. Metabolism of
soluble rapeseed meal (Brassica rapa L.) protein during incubations with buffered
bovine rumen contents in vitro. J. Dairy Sci. 96: 440–450.
Todd, R.W., Cole, N.A., Harper, L.A., Flesch, T.K., Baek, B.H. 2005. Ammonia and
gaseous nitrogen emissions from a commercial beef cattle feed yard estimated
using the flux-gradient method and N:P ratio analysis. Proc. Symposium State of
the Science: Animal Manure and Waste Management, Jan. 5–7, 2005, San
Antonio, TX.
Available:http://www.cals.ncsu.edu/waste_mgt/natlcenter/sanantonio/proceeding
s.htmh. Accessed Aug. 31, 2015.
Van Kessel, J. S., and Russell J. B.1996. The effect of amino nitrogen on the energetics
of ruminal bacteria and its impact on energy spilling. J. Dairy Sci. 79:1237–1243.
Wanderley, R.C., Huber, J.T., Wu, Z., Pessarakli, M., Fonte, C.J., 1993. Influence of
microbial colonization of feed particles on determination of nitrogen degradability
by in situ incubation. J. Anim. Sci. 71: 3073-3077.
Wulf, M., Südekum, K.-H., 2005. Effects of chemically treated soybeans and expeller
rapeseed meal on in vivo and in situ crude fat and crude protein disappearance
9 CHAPTER 1
Does microbial nitrogen contamination affect the estimation of crude
protein degradability of concentrate feeds?
A. C. B. Menezes 1†, S. C. Valadares Filho 1,P. P. Rotta 1, S. A. Santos 2, 1,
M. V. C Pacheco 1, B. C. Silva 1, P. Pucetti 1, H. M. Alhadas 1,C. Ducatti3,
andE. Detmann1
1Department of Animal Science, Universidade Federal de Viçosa,36570-900,
Viçosa, Minas Gerais, Brazil
2Department of Animal Science, Universidade Federal da Bahia, 40170-110,
Salvador, Bahia, Brazil
3Universidade Estadual Paulista Júlio de Mesquita, Departamento de Física
e Biofísica, 18608-000, Botucatu, SP, Brazil
†Email: [email protected]
10 Abstract
The effects of microbial contamination (MC) on crude protein (CP)
degradability of concentrate feeds are still controversial. Moreover, the
incubation time can influence the estimation of rumen degradable protein
(RDP), a relevant parameter on beef cattle nutrition. The aim of this study was
to use 15N to estimate the MC of CP fractions that were soluble (a), insoluble
but potentially degradable (b), and the digestion rate of fraction b (kd), as well
as to determine the incubation time necessary to estimate the RDP of energy
and protein feeds when considering two outflow rates (0.05 h-1 and 0.08 h
-1).Twelve types of feeds were evaluated, with six energy concentrates: wheat
bran, rice meal, ground corn, ground sorghum, ground corn cob, and soybean
hulls; and six protein concentrates: cottonseed meal 38% CP, soybean meal,
ground bean, peanut meal, sunflower meal, and corn gluten meal. The feeds
were divided into 4 groups and were incubated in the rumens of 4 crossbred
bulls. The feed samples were incubated for 0, 2, 4, 8, 16, 24, 48, and 72 h. To
determine the MC of the incubated residues, ruminal bacteria were labeled
with 15N via continuous intraruminal infusion of 15(NH
4)2SO4. Ruminal digesta
were collected for the isolation of bacteria before the first infusion of 15N during
the acclimation period, and after the infusion of 15N during the collection period.
There was no difference (P > 0.05) in the parameters a, b, and kd, corrected
and uncorrected, for all feeds that were evaluated. All of the feed tests followed
an exponential model of degradation and the model fitted well to the data,
except for corn gluten meal, probably because the maximum incubation time
that was used (72 h) was not long enough to allow for an accurate estimation
11 grouping of feeds into three different groups according to the necessary
incubation time to estimate RDP. The first was formed by the high-starch
energy concentrates (15.4 ± 0.46 h), the second by the low-starch energy
concentrates (6.8 ± 0.60 h), and the third by the protein concentrates (9.9 ±
0.41) while considering a kp of 0.05h-1. In conclusion, the microbial
contamination was low and non-significant; therefore, correction of ruminal
protein degradation is irrelevant with regards to the concentrate that was
studied. However, the chemical composition of this feeds resulted in different
incubation times to estimate RDP content, and this has to be taken into
account in the techniques that are used to determine CP digestibility in the
rumen and intestines.
Keywords: energy, incubation time, microbial contamination, protein, rumen
degradable protein
Implications
The knowledge about the amount of rumen degradable protein of concentrate
feeds is important to formulate precise diets for ruminants. Considering this,
the correction for microbial contamination for concentrate feeds is not
recommended because there is a small, but non-significant contribution of
microbial contamination on crude protein fractions in the feeds mostly used in
tropical conditions and it does not influence the crude protein degradability and
rumen undegradable protein values. The recommendation is to incubate
protein feeds for 9.9 hours and the energy feeds for 15.4 and 6.8 hours
12 Introduction
In situ methods are widely used to estimate the ruminal degradability of
CP, but an important source of errors in this method is the microbial
contamination of residual particles of incubated feeds, thereby resulting in the
underestimation of CP degradability (Wulf and Südekum, 2005;
Westreicher-Kristen et al., 2013) as well as the overestimation of rumen undegradable
protein (RUP) content. Machado et al. (2013) showed that microbial
contamination (MC) is an important source of errors for tropical forages, and
concluded that dietary protein and fiber content influence the degree of
contamination. However, concentrate incubation residues are less likely to be
contaminated when compared to forage residues due to the lower microbial
adhesion associated with a lower fiber content, and the microbial protein tends
to be diluted in feeds with higher levels of CP (Rodriguéz and González, 2006).
The accurate prediction of N supply and the requirements of rumen
microflora are important in order to minimize feed costs and N waste (Brooks
et al., 2012). The mobile bag technique (De Boer et al., 1987) is used to assess
rumen degradable protein (RDP) and RUP content, and to simulate intestinal
digestibility. This technique considers a ruminal incubation time of 16 h (Paz
et al., 2014), which is a necessary step to estimate the intestinal digestibility of
RUP, and lower incubation times are associated with higher values of intestinal
digestibility of feeds (Beckers et al., 1996).
However, a great diversity of concentrate feeds, differing by their fiber and
N contents, may be incorporated into ruminant diets, and it can affect the
dimension of MC and the incubation time that is necessary to provide an
13 relevant in concentrate feeds and it may not affect the estimated CP
degradability; also, the incubation time necessary to estimate RDP may vary
between feeds. Therefore, our objectives were to use 15N to estimate the MC
of crude protein fractions that are soluble (a) and insoluble but potentially
degradable (b) and the rate of digestion of the fraction b (kd), as well as to
quantify the necessary incubation time to estimate RDP of energy and protein
concentrates.
Materials and methods
Characterization of concentrate samples
The experiment was carried out at the Animal Science Department of the
Universidade Federal de Viçosa, Viçosa, Minas Gerais, Brazil. The procedures
for the human care and handling of the animals are in agreement with the Ethic
Commission in Use of Production Animals of the Universidade Federal de
Viçosa and with actual Brazilian legislation (protocol number 96/2014). Twelve
types of concentrates were evaluated with six energy concentrates: wheat
bran (Triticum aestivum), rice meal (Oryza sativa), ground corn (Zea mays L.),
ground sorghum (Sorghum vulgare), ground corn cob (Zea mays L.), and
soybean hulls (Glycine max (L.) Merr); and six protein concentrates:
cottonseed meal 38% CP (Gossypium hirsutum), soybean meal (Glycine max
14 hypogaea L.), sunflower meal (Helianthus annuss), and corn gluten meal (Zea
mays L.).
All samples were ground in a Wiley mill (TECNAL, Piracicaba, São Paulo,
Brazil) with a 1-mm sieve for chemical analyses and a 2-mm sieve for in situ
ruminal incubation. These samples were analyzed for DM, organic matter, N,
and ether extract according to the AOAC (2012; method number 934.01,
930.05, 981.10, and AOAC, 2006; method number 945.16, respectively). The
neutral detergent fiber and neutral detergent fiber corrected for ash and protein
analyses were performed according to the technique described by Mertens et
al. (2002) without the addition of sodium sulfite, but with the addition of
thermostable alpha-amylase to the detergent. The determination of neutral
detergent insoluble nitrogen followed the technique described by Licitra et al.
(1996). The lignin was extracted with 72% sulfuric acid while following the
recommendations of Van Soest and Wine (1967). The non-fibrous
carbohydrates were calculated according to Detmann and Valadares Filho
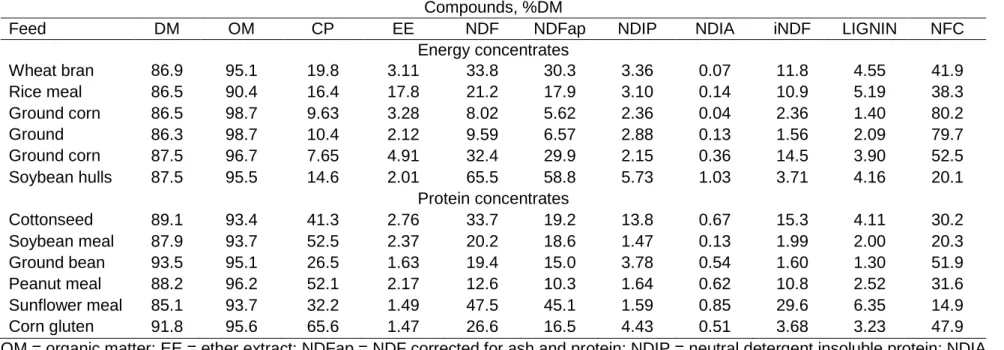
(2010). The chemical composition of feeds can be found in Table 1.
Table 1
Incubation and sampling procedures
The twelve feeds were divided into four groups, with three different types
of concentrate in each one, and these feeds were ruminally incubated in four
crossbred bulls while following a Latin square design (4 × 4). Within each
15 (Figure 1). As reported by Machado et al. (2013), the objective of the Latin
square was to assist and organize the information that is collected in the field,
while allowing for measurements of degradation of different feeds without
confounding the effect of the animal, as well as controlling sources of variation
and avoiding bias without estimating the variability.
The bulls were fed ad libitum with a diet based on a 50:50 (DM basis)
mixture of corn silage and concentrate. The diet presented with 120 g CP/kg
of DM. The concentrate was composed of 790 g/kg ground corn, 86 g/kg
soybean meal, 60 g/kg wheat bran, 14 g/kg urea, 1.5 g/kg ammonium sulfate,
9.0 g/kg salt, 9.0 g/kg mineral mix, and 15 g/kg sodium bicarbonate. The
animals were adapted to the experimental diet for 21 days prior to the
incubations.
Individually identified nylon bags (Sefar Nitex; Sefar, Thal, Switzerland;
porosity of 50 μm and 8 × 15 cm) were used, to which 6.0 g of each feed,
previously ground at 2 mm, were added. The incubation times were 0, 2, 4, 8,
16, 24, 48, and 72 h. The number of bags varied as a function of the time of
incubation in order to obtain enough residue for laboratory analyses: one bag
for 0 and 2 h, two bags for 4 and 8 h, three bags for 16 h, four bags for 24 h
and five bags for 48 and 72 h, with a total of twenty-two bags per feed and
sixty-six incubated bags per animal (excluding time 0).
The samples were ruminally incubated and attached to a steel chain with
a weight at the end, thus allowing for immersion within the ruminal contents.
Bags were placed in the rumen in the reverse order, so all bags were removed
at the same time and then washed in running water (Machado et al., 2013).
16 running water, together with the incubated bags. Bags were oven-dried at 55°C
for 72 h, after which they were placed in an oven at 105 °C for 2 hours, placed
in a desiccator, and then weighed.
The 15N infusion was performed according to Rotta et al. (2014), which is
briefly described here: the bulls received a solution containing 7.03 g of
ammonium sulfate enriched with 10% of 15N atoms [(15NH
4)2SO4; Sigma
Aldrich (Isotec), Miamisburg, OH], while providing 200 mg of daily 15N to each
animal. The amount of NH4+ infused into the salt was 1.99 g. Considering a
rumen volume of 80 L and a N-ammonia pool of 5 mmol/L, there would be a
total N-ammonia pool of approximately 400 mmol/d (Machado et al., 2013).
When considering 14 mg/mmol of N-NH3, there was a potential daily pool of
5.6 g N-NH3. Therefore, it should be noted that 1.99 g of NH4+ infused per day
is not a negligible value when compared to the 5.6 g of N-NH3, the potential
daily pool of ruminal N-ammonia (Machado et al., 2013). This solution was
continuously infused via a peristaltic pump (model 646; Milan, Scientific
Equipments, Colombo, Paraná, Brazil) and adapted hoses connected to a
ruminal fistula, which was surgically placed as described by Dougherty (1981).
The pump was constantly regulated so that the volume of the solution was
infused over a period of 24 h. After this time, the containers holding the
enriched 15N solution were replaced with containers holding a new solution,
always at the same concentration. The infusion of ammonium sulfate was
initiated 60 h before the first incubation day and continued until the last day of
incubation to ensure a uniform distribution of 15N and incorporation of 15NH 3
17 Ruminal digesta were collected for the isolation of bacteria before the first
infusion of 15N to quantify the 15N background, and ruminal digesta also were
obtained for the isolation of bacteria after the infusion of 15N on the second day
of each collection period. Three collections were performed each day, with the
first collection occurring before feeding and the other collections performed at
2 and 4 h after feeding. The procedure that was used for the isolation of
bacteria was developed by Reynal et al. (2005) and adapted by Krizsan et al.
(2010) as follows: 1 L of the ruminal digesta sample was filtered through a
100-μm nylon filter with a 44% pore surface area (Sefar Nitex 100/44; Sefar, Thal,
Switzerland), and the material that remained in the filter was washed with 800
mL of 0.90% (wt/vol) saline solution (NaCl). The remaining phase on the filter
was saved for isolation of the bacteria associated with the particles (BAP). The
filtered material was processed for the isolation of bacteria that were
associated with the liquid phase (BAL). After centrifugation (1,000 × g for 10
min, 5 °C), the pellet was saved for BAP isolation, and the supernatan t was
centrifuged at 11,250 × g for 30 min at 5 °C. After that, 200 mL of McDougall’s
buffer (McDougall, 1948) was added to this centrifugation pellet, and this
material was again centrifuged at 16,500 × g for 20 min at 5 °C. The resu lting
pellet from this centrifugation consisted of the BAL and was stored in aluminum
trays for subsequent lyophilization. To isolate the BAP, 700 mL of 0.90%
(wt/vol) saline solution with 0.1% Tween-80 (vol/vol) was added to plastic
containers with the above mentioned samples, which were then homogenized
with a glass rod for 30 s and stored in the refrigerator at 4°C for 12 h for
subsequent centrifugation. After 12 h, the samples were filtered by using a
18 Thal, Switzerland). The filtrate was centrifuged at 1,000 × g for 10 min at 5 °C,
and the supernatant was then centrifuged at 11,250 × g for 30 min at 5 °C. The
pellet resulting from this centrifugation was combined with 200 mL of
McDougall buffer and was centrifuged at 16,250 × g for 20 min at 5 °C. The
BAP of this last centrifugation was stored in aluminum trays for subsequent
lyophilization. Thirty-two samples were obtained after lyophilization for 15N
analyses with 4 periods and 4 bulls for BAP and BAL (4 × 4 × 2).
Chemical analyses
The incubation residues were analyzed with regard to crude protein
content, and BAL and BAP samples with regard to OM and CP content
according to previously described methods.The enrichment with 15N atoms
was measured by using an isotope ratio mass spectrometer (Delta S; Finnigan
MAT, Bremen, Germany). Samples were prepared for each incubation time,
consequently resulting in samples of 1 g each, and were placed in 5 by 8 mm
capsules for future readings. The ratios of stable isotopes of the same
chemical element (15N:14N) were evaluated in terms of Δ per thousand,
according to international standards, and were converted to percentages of
atoms in excess.
19 The chemical composition, 15N enrichment, and its background in BAL and
BAP were compared by using an analysis of variance according to the
following model:
ijk k ij j i
ijk A P AP B
Y
where µ is the general constant, Ai is the effect of animal I (random), Pj is the
effect of experimental period j (random), APij is the interaction between animal
I and period j (random), Bk is the effect of the bacteria sampled from the
different phases of digesta k (fixed), and εijk is the random error. The different
phases of digesta were considered as repeated measures. The data was
analyzed by using the MIXED procedure of SAS 9.4.
The degradation profiles of CP were interpreted by using the asymptotic
model of Ørskov and McDonald (1979), which was adapted to compare the
corrected and uncorrected parameters for MC. The following model was used
to estimate the parameters of CP degradability:
CPdt=D1× a1+b1×(1- e-kd1 ×t ) + D2 a2+b2×(1- e -kd2 ×t ) + ε
Where CPdt = the percentage of CP degraded at time t; D1 and D2 are
dummy variables corresponding to the procedure that was used when the
protein degradation was corrected or not: D1 = 0 and D2 = 1 correspond to
degradation without correction for the MC, and D1 = 1 and D2 = 0 correspond
to degradation corrected for the MC; t = the effect of time on the variables (h);
a = the soluble fraction of the CP (%); b = the insoluble fraction that is
potentially degradable (%); and kd = the degradation rate of "b" (h-1); and ɛ =
random error assumed to yield an asymptotic normal distribution.
The NLIN procedure of SAS 9.4 was used. Restricted and full models were
20 adjustments were performed for each feed. In the first adjustment, it was
assumed that the dimensions of the soluble, insoluble but potentially
degradable fractions, and the fractional degradation rate were similar in the
corrected and non-corrected profiles. The model that arose from this
adjustment was called the restricted model. In the second adjustment, those
parameters were supposed to be different for the corrected and non-corrected
profiles, and the model was called the complete model. From this information,
the statistical comparison was performed by using the ² distribution as follows:
) ln( 2 . RSSr RSSc n
calc
d.f. = p(c) – p(r)
where
calc2 . is the calculated value of ² statistics, n is the number ofobservations that were used for adjusting the degradation profiles, RSSc is the
residual sum of squares of the complete model, RSSr is the residual sum of
squares of the restricted model, d.f. is the number of degrees of freedom that
were used to perform the test, p(c) is the number of parameters that were
considered in the adjustment of the complete model, and p(r) is the number of
parameters that were considered in the adjustment of the restricted model. For
all feeds, p(c) = 6, p(r) = 3, and d.f. = 3.
Following the model adjustment, the RDP was calculated as follows:
kp kd kd b a RDP
where kp is the ruminal outflow rate (h-1). The other terms were previously
defined.
Two outflow rates of 0.05 h-1 and 0.08 h-1 were used to estimate RDP
21 (Steingass et al., 2013). A ruminal outflow rate of 0.05 h-1 was used to simulate
the outflow rate for calves, low-yielding dairy cows, and beef cattle (medium
rate), while 0.08 h-1 was used to simulate the outflow rate for high yielding dairy
cows (high rate) according to the AFRC (1993).
The necessary incubation time (h) to estimate the RDP of each feed by
using a single point incubation was quantified as the incubation time when the
degraded fraction of CP becomes equal to the RDP estimate. The following
equation was used:
] ) (
1 ln[
kd b
a RDP
t
Additionally, in order to identify concentrate subgroups with similar
incubation times to estimate the RDP, the necessary incubation times that
were obtained by using both outflow rates were submitted to a multivariate
non-hierarchical clustering procedure (Katthree and Naik, 2000) by using the
FASTCLUS procedure of SAS 9.4. All statistical procedures were conducted
by using 0.05 as the critical level for the probability of a type I error.
Results
Bacteria associated with the liquid phase and bacteria associated with the
particles 15N content
There was no difference (P > 0.05) between BAL and BAP 15N content;
thus, an average content was used to estimate the MC in incubation residues
22 Table 2
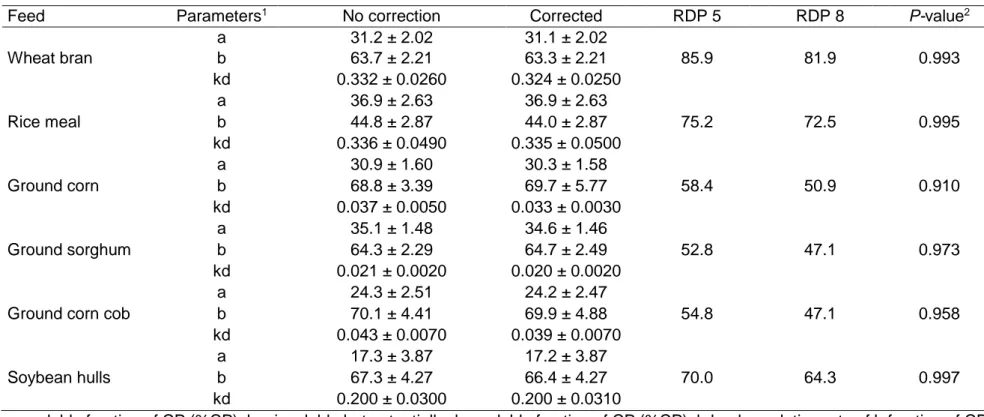
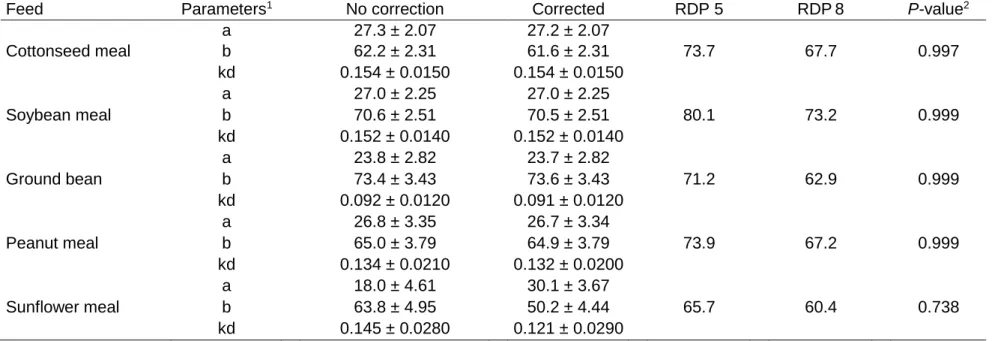
Effect of microbial contamination on crude protein degradation
Crude protein degradation parameters from energy and protein
concentrates, corrected and non-corrected for MC, are presented in Tables 3
and 4, respectively. All of the feeds followed an exponential model of
degradation and the model fitted well to the data, except for corn gluten meal.
The degradation pattern of this feed was not regular and the asymptote
estimation was not possible because the model did not converge. Probably,
the maximum incubation time that was used here (72 h) was not long enough
to allow for an accurate estimation of the degradation profile. For this reason,
corn gluten meal was no longer considered in any part of the discussion. There
was no difference (P > 0.05) between the fractions a, b, and kd corrected and
not corrected for MC. Rumen degradable protein values were obtained by
considering outflow rates of 0.05 h-1 and 0.08 h-1. There was a small, but
non-significant effect of MC on CP degradation (Figures 2 and 3), resulting in no
difference (P > 0.05) on CP degradation parameters, corrected and not
corrected for MC.
Table 3
23 Incubation time to estimate rumen degradable protein content
The cluster analysis allowed for the grouping of feeds into three different
groups (feeds with high starch content, low starch content, and protein
concentrates) according to the necessary incubation time to estimate RDP. It
should be highlighted that overall R² of the clustering procedure was high (R²
= 0.944).
Discussion
Bacteria associated with the liquid phase and bacteria associated with the
particles 15N content
According to Olubobokun and Craig (1990) and Beckers et al. (1995), the
capture of 15N by ruminal microorganisms can be different from BAL and BAP
because BAP is more predominant in rumen content than BAL (Legay-Carmier
and Bauchart., 1989). Nevertheless, we did not observe differences (P > 0.05)
between BAL and BAP 15N content. Results in this present study are similar to
those obtained by Machado et al. (2013) and Rotta et al. (2014), with no
difference in 15N:14N ratio of BAP and BAL, but different from Rodríguez et al.
(2000) who found lower concentrations of 15N in BAP than in BAL.
24 Literature data are variable with respect to the effects of microbial
contamination on the degradation of crude protein and its fractions (a, b, kd)
for concentrate feed, as well as for the microbial marker that is used. Results
that are similar to this study were obtained by Stefánski et al. (2013), who did
not observe differences in CP degradation for MC contamination when
studying canola meal while using a maximum of 10 hours of incubation.
However, González et al. (2011), when using 15N as a microbial marker, found
that MC is an important source of errors in CP degradation of ryegrass and
sunflower meal, and Alexandrov (1998) observed a significant effect of MC on
CP degradation as a function of incubation time for sunflower meal when using
DAPA as a microbial marker.
Rodríguez and González (2006) reported a small but non-significant effect
for fraction a when evaluating 14 feeds such as ground corn, sunflower meal,
soybean meal, soybean hulls, and wheat bran; however, these small effects
resulted in an increase in fraction b values. Beckers et al. (1995), when
studying meat and bone meal, soybean meal, and wheat bran, found a
significant effect of MC on the parameters a, b, and kd of wheat bran. These
authors reported that the greatest neutral detergent fiber content of wheat bran
leads to a similar pattern as forages (Craig et al., 1987; Olubobokun et al.,
1990; Wanderley at al., 1993), where the high bacterial colonization of fibrous
feeds led to the greatest underestimation of CP effective degradability when
the correction was omitted. Mathers and Aitchison (1981) and Beckers et al.
(1995) considered that for concentrate feeds that are rich in protein and without
fiber, such as meat, bone meal, and fish meal, the MC may be nutritionally
25 Some authors (Valadares Filho et al., 1992; Ould-Bah et al., 1998)
suggested that concentrate feeds present with low to moderate values of MC
when compared to roughage feeds. According to Krawielitzki et al. (2006), the
binding and access of microorganisms to feed particles is supported by fibrous
substances. Rodríguez and González (2006) relayed that the microbial
contamination would be directly related to the cellulose content of the feed.
However, according to Wanderley et al. (1993), feeds with a low CP content
would present with greater MC effects, and the microbial protein tends to be
diluted in feeds with higher levels of CP (Rodriguéz and González, 2006).
Machado et al. (2013) studied tropical forages and observed significant effects
of MC, and these authors developed equations while considering the content
of fiber and CP in roughages. In this scenario, the source of feed may affect
the extension of MC. In summary, the low fiber content of feeds that were
evaluated in this study was related to a non-significant contribution in MC.
Incubation time to estimate rumen degradable protein content
Knowledge about the RDP content of feeds is necessary to formulate diets
to meet the requirements of beef cattle. Ruminants have particularities with
regards to their protein nutrition because most of their amino acids and
absorbable proteins (50 to 80%) are from microbial proteins that are
synthesized in the rumen (Bach et al., 2005). In this study, we also evaluated
the necessary incubation time to estimate RDP of each feed and identified
26 outflow rates, 0.05 h-1 (moderate) and 0.08 h-1 (fast), according to the AFRC
(1993).
The cluster analysis allowed for the grouping of feeds into three different
groups. The first was formed by the high-starch energy concentrates (ground
corn, ground sorghum, and ground corn cob), the second by the low-starch
energy concentrates (wheat bran, rice meal, and soybean hulls), and the third
by the protein concentrates (Table 5). For the high starch energy concentrates,
more hours of incubation were needed to estimate the RDP content (15.4 ±
0.46 h, kp = 0.05 h-1 or 10.4 ± 0.12 h, kp = 0.08 h-1) than for the other groups.
This occurred because of the structural features of starch and interactions with
other components like proteins or lipids (Svihus et al., 2005). The presence of
a protein matrix around the starch beads hampers the microorganisms’ access
and the digestible enzymes that are necessary to digest the feed. Moreover,
corn and sorghum plants that are commonly found in Brazil have a harder
endosperm, which therefore indicates a greater binding between protein and
starch (McAllister et al., 1990).
Table 5
In line with this thought, the low starch energy concentrates, composed of
feeds with low starch contents, required the lowest incubation hours (6.80 ±
0.60 h, kp = 0.05 h-1 or 5.40 ± 0.41 h, kp = 0.08 h-1). The third group, composed
of protein concentrates, reached intermediate values of incubation hours that
were needed to estimate RDP (9.90 ± 0.41 h, kp = 0.05 h-1 or 7.50 ± 0.25 h,
27 of ruminal incubation as a necessary step in the mobile nylon bag technique
in order to assess RDP content, and consequently estimate RUP content (de
Boer et al., 1987). According to our data, 16 h of ruminal incubation are
indicated only for ground corn, ground sorghum, and ground corn cob, while
considering an outflow rate of 0.05 h-1. For the other feeds that were evaluated
in this study, 16 hours of incubation can overestimate the intestinal digestibility,
because theoretically, less RUP arrived in the small intestine. So, the majority
of concentrated feeds will not be retained for 16 h in the rumen because of the
chemical composition, particle size, and when considering the passage rate,
as they rapidly flow to the intestine. Thus, we present the incubation hours in
Table 5 as those needed to estimate RDP content from concentrate feeds.
Conclusions
The microbial contamination was low and non-significant, so the correction
of ruminal protein degradation is irrelevant for the concentrates that were
studied. However, the chemical composition of these feeds resulted in different
incubation times to estimate RDP content, and it needs to be considered in
techniques that are used to determine CP digestibility in the rumen and
intestines.
Acknowledgements
We would like to thank the Conselho Nacional de Desenvolvimento Científico
e Tecnológico (CNPq, Brazil), Instituto Nacional de Ciência e Tecnologia –
28 Minas Gerais (FAPEMIG, Brazil) for their financial support and the staff of the
Animal Science Department of the Universidade Federal de Viçosa for their
assistance in conducting these experiments.
References
Agricultural and Food Research Council 1993. Energy and protein requirements of
ruminants. An advisory manual prepared by the AFRC technical committee on
responses to nutrients. CAB International, Wallingford, UK
Alexandrov AN 1998. Effect of ruminal exposure and subsequent microbial
contamination on dry matter and protein degradability of various feedstuffs.
Animal Feed Science and Technology 71, 99–107.
doi:10.1016/S0377-8401(97)00129-6.
Association of Official Analytical Chemists (AOAC) 2000. Official methods of analysis.
17th edition. AOAC, Arlington, VA, USA.
Bach A, Calsamiglia S and Stern MD 2005. Nitrogen metabolism in the rumen. Journal
of Dairy Science 88, 9-21. doi: 10.3168/jds.S0022-0302(05)73133-7.
Beckers Y, Thewis A, Maudoux B and François E 1995. Studies on the in situ nitrogen
degradability corrected for bacterial contamination of concentrate feeds in steers.
Journal of Animal Science 73, 220-227.doi:/1995.731220x.
Beckers Y, ThCwis A and Maudoux B 1996. Intestinal digestibility of rumen
undegraded N of concentrates measured by the mobile nylon bag technique.
Animal Feed Science and Technology 61, 305-323.
Broderick GA and Merchen NR 1992. Markers for quantifying microbial protein
synthesis in the rumen. Journal of Dairy Science 75, 2618–2632.
29
Brooks MA, Harvey RM, Johnson NF and Kerley MS 2012. Rumen degradable protein
supply affects microbial efficiency in continuous culture and growth in steers.
Journal of Animal Science. 90, 4985–4994. doi:10.2527/jas.2011-4107.
de Boer G, Murphy JJ and Kennelly JJ 1987. Mobile nylon bag for estimating intestinal
availability of rumen undegradable protein. Journal of Dairy Science. 70, 977-982.
doi:10.3168/jds.S0022-0302(87)80102-9.
Detmann E and Valadares Filho SC. 2010. On the estimation of non-fibrous
carbohydrates in feeds and diets. Arquivos Brasileiros de Medicina Veterinária e
Zootecnia 62, 980–984. doi:10.1590/S0102-09352010000400030.
Dougherty RW 1981. Experimental surgery in farm animals. Iowa State University
Press, Ames, IA, USA.
González JC, Ouarti M, Rodríguez CA and Alvir, MR 2006. Effects of considering the
rate of comminution of particles and microbial contamination on accuracy of in situ
studies of feed protein degradability in ruminants. Animal Feed Science
Technology 125, 89–98. doi:10.1016/j.anifeedsci.2005.05.013.
Katthree R and Naik DN 2000. SAS system for multivariate data reduction and
discrimination. Statistical Analysis Systems Institute Inc., Cary, NC, USA.
Krawielitzki K, Schmidt T, Voigt J, Kowalczyk J and Gabel M 2006. Dynamics of
microbial contamination of protein during ruminal in situ incubation of feedstuffs.
Animal Feed Science and Technology 15, 313–328.
Krizsan SJ, Ahvenjärvi S, Volden H and Broderick GA 2010. Estimation of rumen
outflow in dairy cows fed grass silage based diets by use of reticular sampling as
an alternative to sampling from the omasal canal. Journal of Dairy Science 93,
1138–1147. doi: 10.3168/jds.2009-2661.
Legay-Carmier F and Bauchart D 1989. Distribution of bacteria in the rumen contents
of dairy cows given a diet supplemented with soyabean oil. British Journal of
30
Licitra G, Hernandez TM and Van Soest PJ 1996. Standardization of procedures for
nitrogen fractionation of ruminant feeds. Animal Feed Science and Technology
57, 347–358. doi: 10.1016/0377-8401(95)00837-3.
Machado PAS, Valadares Filho SC, Detmann E, Santos SA, Valadares RFD, Ducatti
C, Rotta PP and Costa e Silva LF 2013. Development of equations to estimate
microbial contamination in ruminal incubation residues of forage produced under
tropical conditions using 15N as a label. Journal of Animal Science 91, 3836–
3846. doi: 10.2527/jas.2012-5636.
McAllister TA, Rode LM, Major DJ, Cheng KJ and Buchanan-Smith JG 1990. Effect
of ruminal microbial colonization on cereal grain digestion. Canadian Journal of
Animal Science 70, 571-579. doi:10.4141/cjas90-069.
McDougall EI 1948. Studies on ruminant saliva. 1. The composition and output of
sheep’s saliva. Biochemical Journal 43, 99–109.
Mertens DR 2002. Gravimetric determination of amylase-treated neutral detergent
fiber in feeds with refluxing in beakers or crucibles: Collaborative study. J. AOAC
Int. 85,1217–1240.
Olubobokun JA and Craig WM 1990. Quantity and characteristics of micro-organisms
associated with ruminal fluid or particles. Journal of Animal Science 68,
3360-3370.
Ørskov ER and McDonald I 1979. The estimation of protein degradability in the rumen
from incubation measurements weighted according to rate of passage. Journal of
Agricultural Science 92, 499–503. doi: 10.1017/S0021859600063048.
Ould-Bah MY, Michalet-Doreau B and Jamot J 1988. Colonisation bactérienne des
résidus alimentaires des sachets incubés dans le rumen: utilisation du «
stomacher » pour la réduire et conséquences sur la mesure de la dégradabilité
ruminale de l’ azote. Reproduction Nutrition Development 28 (suppl.1), 107-108.
Paz HA, Klopfenstein TJ, Hostetler D, Fernando SC, Castillo-Lopez E and Kononoff