Preferential Interactions and the Effect of
Protein PEGylation
Louise Stenstrup Holm1¤a
*, Peter W. Thulstrup2, Marina R. Kasimova1¤b, Marco van de
Weert1
1Department of Pharmacy, Faculty of Health and Medical Sciences, University of Copenhagen, Copenhagen, Denmark,2Department of Chemistry, Faculty of Science, University of Copenhagen, Copenhagen, Denmark
¤a Current Address: Biopharm Formulation Development, CMC Supply, Novo Nordisk A/S, Gentofte, Denmark
¤b Current Address: Department of Antibody Characterization & Analytics, Symphogen A/S, Lyngby, Denmark
Abstract
Background
PEGylation is a strategy used by the pharmaceutical industry to prolong systemic circulation of protein drugs, whereas formulation excipients are used for stabilization of proteins during storage. Here we investigate the role of PEGylation in protein stabilization by formulation excipients that preferentially interact with the protein.
Methodology/Principal Findings
The model protein hen egg white lysozyme was doubly PEGylated on two lysines with 5 kDa linear PEGs (mPEG-succinimidyl valerate, MW 5000) and studied in the absence and presence of preferentially excluded sucrose and preferentially bound guanine hydrochlo-ride. Structural characterization by far- and near-UV circular dichroism spectroscopy was supplemented by investigation of protein thermal stability with the use of differential scan-ning calorimetry, far and near-UV circular dichroism and fluorescence spectroscopy. It was found that PEGylated lysozyme was stabilized by the preferentially excluded excipient and destabilized by the preferentially bound excipient in a similar manner as lysozyme. How-ever, compared to lysozyme in all cases the melting transition was lower by up to a few degrees and the calorimetric melting enthalpy was decreased to half the value for PEGy-lated lysozyme. The ratio between calorimetric and van’t Hoff enthalpy suggests that our PEGylated lysozyme is a dimer.
Conclusion/Significance
The PEGylated model protein displayed similar stability responses to the addition of prefer-entially active excipients. This suggests that formulation principles using preferprefer-entially inter-acting excipients are similar for PEGylated and non-PEGylated proteins.
OPEN ACCESS
Citation:Holm LS, Thulstrup PW, Kasimova MR, van de Weert M (2015) Preferential Interactions and the Effect of Protein PEGylation. PLoS ONE 10(7): e0133584. doi:10.1371/journal.pone.0133584
Editor:Jose M. Sanchez-Ruiz, Universidad de Granada, SPAIN
Received:March 17, 2015
Accepted:June 29, 2015
Published:July 31, 2015
Copyright:© 2015 Holm et al. This is an open access article distributed under the terms of the
Creative Commons Attribution License, which permits unrestricted use, distribution, and reproduction in any medium, provided the original author and source are credited.
Data Availability Statement:All relevant data are within the paper and its Supporting Information files.
Introduction
Next-generation protein drugs are proteins with altered amino acid sequence or altered glycosylation patterns, or proteins that are covalently modified with chemical moieties such as polyethylene glycol (PEG). These modifications are generally aimed at improving the pharma-cokinetics of the protein, most commonly an increase in circulation half-life. In the case of PEGylation inert PEG chains are covalently conjugated to the protein, which can then circulate more than 20 times longer than the non-modified product depending on various protein- and modification specific characteristics. PEGylation of proteins has led to significantly improved possibilities for drug administration; for example, in treatment of chronic hepatitis C a 7-fold increase in circulation half-life is observed upon PEGylation of the native protein drug [1]. This allows once-weekly injections with improved clinical outcome compared to the thrice-weekly injections of the unmodified drug, despite the fact that receptor binding is reduced by more than a factor 10 for the PEGylated product [2]. Currently, there are 10 PEGylated pro-teins on the market [3].
The chemical aspects of the PEGylation process are well-documented, focusing on the dif-ferent types of the PEGs, the coupling chemistry, the number of modifications and the target-ing of different modification sites [4–8]. Also pharmacokinetic studies showing sustained plasma concentrations are common [9–12].
Comparatively fewer studies are available on the physical stability of PEGylated proteins. Those studies generally show a lower propensity for aggregation upon PEGylation, as shown for several proteins [6,13–15]. Somewhat surprisingly, adsorption to hydrophobic surfaces is not reduced [13,16]. The impact of PEGylation on thermal stability is less equivocal, with both decreases [13,15] and increases [17] reported.
Considering the commercial success of protein PEGylation, there is surprisingly limited lit-erature on pharmaceutical processing and formulation aspects. A few studies on processing by freeze-drying show that PEGylation improves stability [18–21]. While there are numerous studies on protein formulation approaches to achieve long-term storage stability (reviewed in [22–24]) proper formulation principles for PEGylated proteins are largely unreported in the scientific literature although it has undoubtedly been explored by the industry. It is therefore still unknown whether PEGylation may change the interactions between the pharmaceutical protein and commonly used excipients. Therefore, we have investigated the interactions between a PEGylated model protein and model excipients which are either preferentially excluded or bound. The model protein was lysozyme (Lyz), doubly PEGylated with 5 kDa units (LyzPEG). The preferentially excluded excipient was sucrose, which is present in various pharmaceutical formulations, and the preferentially bound excipient was guanidine hydrochlo-ride (GdnHCl), which is commonly used to denature proteins. It is our hypothesis that PEGy-lation modifies the preferential interactions because PEG itself is preferentially active [25,26]. The impact of the excipients was investigated in terms of structural stability by far- and near-UV circular dichroism (CD), while thermal stability was characterized by thermal denaturation using DSC, near- and far-UV CD and fluorescence. Furthermore, we discuss the spatial impli-cations and possible interactions of PEG with the protein and possible explanations for the observed results.
Materials
Hen egg white lysozyme dry powder (>95%), HEPES, guanidine hydrochloride and sucrose
were purchased from Sigma. 5000 Da mPEG-succinimidyl valerate (mPEG-SVA)was pur-chased from Laysan Bio A/S.
article itself commenced prior to MRK's employment with Symphogen A/S and was then completed outside of her regular working hours at Symphogen A/S. MRK asked and received permission from Symphogen A/S to work on this paper. Symphogen A/S did not have any role in the study design, data collection and analysis, decision to publish, or preparation of the manuscript.
Experimentals
PEGylation
Lysozyme was diPEGylated with a 5 kDa mPEG-SVA onto lysine residues and purified with IEC as described previously [13]. The diPEGylated species was used for all experiments, the main modification sites being Lys-33 and Lys-97 [27,28] and to a minor degree Lys-116 [29] in the Lyz sequence.
Sample preparation
1.67 M sucrose and 2.77 M GdnHCl stock solutions with 10 mM HEPES pH 7.4 were prepared and frozen until use. In our experience sucrose solutions may behave differently after being fro-zen or kept at 5°C prior to use at room temperature. Therefore, both excipient solutions were heated to 50–60°C to ensure homogeneity and then left to cool to room temperature before fur-ther use. Excipient concentrations were determined by refractometry. The refractive index was measured on a RL3 refractometer (Nr. 28046/01, PZO Warszawa, Warsaw, Poland). 5 mea-surements were averaged and a buffer average subtracted. The difference in the refractive index,Δn, is linear with the concentration of sucrose [30]. The concentration of GdnHCl con-centration was calculated with the polynomial presented by Nozaki [31].
Protein stock solutions in 10 mM HEPES buffer pH 7.4 were diluted into the excipient solu-tions giving final excipient concentrasolu-tions of 1.0 M sucrose and 2.0 M GdnHCl. At this concen-tration sucrose imparts a significant stabilization through preferential exclusion [32,33]. A concentration of 2.0 M GdnHCl was chosen because for lysozyme it is well below the denatur-ing level [34,35]. These excipient concentrations were used in all experiments. The protein concentrations were 0.1–2.5 mg/ml depending on technique. LyzPEG was measured in protein equivalent weight concentration. Concentrations were measured on a NanoDrop-1000 or a NanoDrop-2000c Spectrophotometer (Thermo Scientific, Wilmington, Delaware). Solutions were filtered through a 0.22μm filter prior to DSC, CD and Fluorescence measurements.
CD
Far- and near-UV circular dichroism spectroscopy was used for two purposes: structural assessment of Lyz and LyzPEG in buffer and in presence of excipients, and to follow tempera-ture induced unfolding of the secondary and tertiary structempera-ture of the protein. Measurements were performed on degassed samples using a Jasco-815 CD instrument (JASCO, Essex, UK). The concentration was re-measured post degassing.
For recording of isothermal CD spectra for the structural assessment the instrument settings were: 0.1 nm data interval, 1 nm band width, digital integration time (DIT) of 4 s and 20 nm/ min scan speed. 3 spectra were averaged, smoothed using a 25 point Savitzky-Golay algorithm (2ndorder), a buffer scan subtracted and the data were normalized to mean residue ellipticity (MRE) using a molecular weight of 14306 Da. Specifically, spectra of far-UV CD were collected at 2.5 mg/ml in a 50μm circular quartz cuvette temperature controlled with a water bath set at 20°C. The spectra were recorded in the range 250–195 nm but are only displayed in the range 250–203 nm where the high tension always remained below 500 V. Near-UV CD were mea-sured at a concentration of 0.4 mg/ml in a 10 mm quartz cuvette which was thermostated at 20°C using a Peltier element. The samples were recorded in the interval 320–240 nm and the maximum high tension at 280 nm was less than 420 V in all cases.
rate and a data interval of 1°C in the temperature range 20–96°C. The heating rate used here is common for thermal unfolding analysis of proteins using DSC (see below).
The instrument parameters were set to 16 s digital integration time and the band width to 2 nm. For the temperature scans a 75 mm focusing lens was introduced in front of the sample, yielding a light spot of approximately 1 mm x 4 mm on the sample. The relevant buffer scans were subtracted and subsequently the data were fitted to a folded$unfolded model in
Micro-soft Excel to obtain the temperature and the enthalpy of unfolding. Specifically, far-UV CD melting curves were measured at 222 nm for change in backbone structure (α-helical content) using a 1 mm cuvette (300μl, max high tension<530 V). Near-UV CD melting curves were
measured at 257 nm and at 288.5 nm corresponding to the chiral activity bands of Phe and Trp side chains. Near-UV CD was measured using a 10 mm cuvette (1000μl, maximum high tension<330 V).
DSC
Differential scanning calorimetry (DSC) was conducted on a NanoDSC (cell volume 299μl, TA Instruments, Lindon, Utah) at 1 mg/ml of protein concentration. Heating was performed at 1°C/min in the temperature range from 20°C to 95°C. This heating rate is commonly used for thermal unfolding analysis of proteins in general [36] and lysozyme in particular [37–41]. Due to material restrictions we could not determine whether this scan rate was slow enough to allow sufficient time for the LyzPEG unfolding reaction to equilibrate or perform a reversibility assessment. Buffer scans were run until full overlay of two consecutive scans was obtained. Samples were degassed for 10 minutes prior to loading the solutions into the cells. Buffer sub-traction, baseline correction and data treatment (non-2-state model) were conducted with Ori-ginPro 8.6 (OriginLab, Northampton, Massachusetts, USA).
Fluorescence
Fluorescence spectra were recorded as a function of temperature on a Spex Fluorolog 3–22 fluorescence spectrometer (Jobin-Yvon Horiba, Longjumeau, France) equipped with a 450 W xenon lamp. 1 ml of 0.1 mg/ml protein were placed in a 10 mm quartz cuvette, covered with a lid and stirred. Samples were excited at 295 nm and emission recorded from 300 nm to 450 nm with an increment of 0.5 nm. Excitation and emission slits were set to 1 and 3 nm, respectively. The data acquisition time was 0.1 s and 5 spectra were recorded and averaged at every degree from 20°C to 96°C. The temperature was controlled by water bath circulation and the tempera-ture was measured directly in the water bath. Between each temperatempera-ture increase the equilibra-tion time was 1 minute and the tolerance for initializing the measurement was ± 0.5°C. Buffer scans were subtracted from the technical spectra (uncorrected for instrument characteristics) and the data were smoothed with a 25 point Savitzky-Golay algorithm. Maximum peak analy-ses were performed by fitting the curves to a Gaussian function around the apparent peak maximum. Due to unexpected spectral fluctuations for the sucrose-containing solutions the spectrum of Lyz in sucrose was fitted to a Gaussian function of the whole spectrum. The transi-tion midpoint temperature (Tm) and enthalpy of unfolding (ΔH) were determined by fitting the peak maxima (λmax) as a function of temperature to a 2-state model in Microsoft Excel. GraphPad Prism 5.03 for Windows, GraphPad Software, San Diego, California, USA was used for the Gaussian fit and graph presentation.
Structural images
structure of hen egg white lysozyme [42] to visualize the most probable PEGylation sites as well as the protein residues relevant for evaluation of the experimental data. PoPMuSiC 2.0 [43] was used to calculate the exposure of the tryptophan residues.
Results
Secondary and tertiary structure
The impact of the PEGylation process and the effect of the two model excipients on the struc-tural characteristics of Lyz was determined using far- and near-UV spectroscopy. The far-UV CD spectra show that LyzPEG (Fig 1A) has a lower (85% at 205 nm) signal at the same molar concentration as Lyz indicating a change in the secondary structure compared to the non-PEGylated, native protein [44]. For both proteins addition of 1.0 M sucrose does not alter the secondary structure (Fig 1B and 1C). Addition of 2.0 M GdnHCl has a marginal effect on Lyz (Fig 1B) and a stronger effect on LyzPEG (Fig 1C). The spectral changes are primarily observed in the region 203–235 nm, indicative of a minor loss ofα-helical content.
In the near-UV region, the absorbance is dominated by contributions from the 6 Trp resi-dues, and also includes dichroic signals of the 3 Tyr, 3 Phe and the 4 disulphide groups. Assign-ment of the CD signals in this region is highly complex, as the chiral environAssign-ment of the chromophore plays an important role in determining magnitude and direction of the signal. Furthermore, due to the large number of absorbing species there is a high probability of sign cancellation. The near-UV CD spectra of the native and PEGylated protein (Fig 1D) show a clear fine structure with 2 peaks at 300–275 nm at positive ellipticities attributed to Trp signals, and a shoulder around 265–250 nm at negative ellipticities often attributed to Phe signals [45]. The Lyz fine structure at positive ellipticities consists of two strong bands at 294 nm and 286 nm of equal intensity and a weaker fine structure at 278 nm. The fine structure of LyzPEG is slightly different with a diminished signal at 294 nm and a peak shift from 286 nm to 288 nm. For Lyz the shoulder has a delicate fine structure with 2 small positive peaks at 257 nm and 264 nm which has been observed earlier in similar solution conditions [46]. For LyzPEG only the fine structure at 257 nm remains. The LyzPEG CD signal at 257 nm is reduced compared to Lyz, similar to the signal reduction observed in the far-UV range.
For Lyz (Fig 1E) addition of sucrose does not change the Trp spectral features, but the Phe band gains in negative intensity confirming some type of reorganization and possible stabiliza-tion. Addition of GdnHCl reduces the signal in the full range of the spectrum. The stabilization of LyzPEG in presence of sucrose (Fig 1F) is only visible at the shoulder at 257 nm, and the response to sucrose is similar to that seen for native Lyz. GdnHCl reduces the signal of LyzPEG but to a lesser extent than for Lyz, which is opposite to the observations for the far-UV CD.
Thermal denaturation
Thermal denaturation of Lyz and LyzPEG with and without excipients was followed by DSC, far-UV CD at 222 nm and near-UV CD at 257 nm (Phe) and 288.5 nm (Trp).
samples gave similar values (S2 Table) to the ones obtained with the non-2-state model. The obtained values for Tmand enthalpies are represented inFig 2andTable 1(Tmvalues inS1 Table). Although the Tmvalues are often used as an indication of protein thermodynamic stabil-ity at room temperature [50–52], the correct approach would be to compare Gibbs free energy (ΔG) of the two proteins at physiologically relevant temperatures. This requires knowledge of the heat capacity change upon unfolding (ΔCP), which can be obtained directly from the DSC Fig 1. Far- and near- UV CD spectra measured at 20°C, pH 7.4 in HEPES buffer.Excipients are 1.0 M sucrose and 2.0 M GdnHCl. (A-C) Far-UV CD spectra of (A) Lyz and LyzPEG without excipients, (B) Lyz with excipients and (C) LyzPEG with excipients; (D-F) near-UV CD spectra of (D) Lyz and LyzPEG without excipients, (E) Lyz with excipients and (F) LyzPEG with excipients.
thermograms [53]. Unfortunately, this was not possible in our case, due to uncertainty in draw-ing the post-denaturational baselines, which were affected by the post-denaturational aggregation of lysozyme [47]. However, an estimate of theΔCPcan be made from the mutual dependence betweenΔHcaland Tm(S5 Fig). The CD results were fitted to a simple folding-unfolding model Fig 2. Melting transition temperatures and changes as a function of excipient presence.Blue: DSC non-2-state fit, red: far-UV CD at 222 nm (α-helical content) and green: near-UV CD global fit of 257 nm (Phe
signal) and 288.5 nm (Trp signal). The figures show A) melting transition temperatures. B) Sucrose induced change in melting transition temperatures. C) GdnHCl induced change in melting transition temperatures.
in Excel as described in the literature [54]. The near-UV CD data at 257 nm and 288.5 nm were fitted globally as well as individually and the results of the individual fits are available inS3 Table. The LyzPEG CD data fit equally well to a dimer model (S3 Fig, see alsodiscussionbelow). In all cases the heat capacity change was fixed to 0 as the fitting quality was not improved upon intro-duction of non-zeroΔCp. Melting curves and their respective fits can be found in theS1 Figand
S2 Fig, the resulting Tmand enthalpies are shown inFig 2andTable 1.
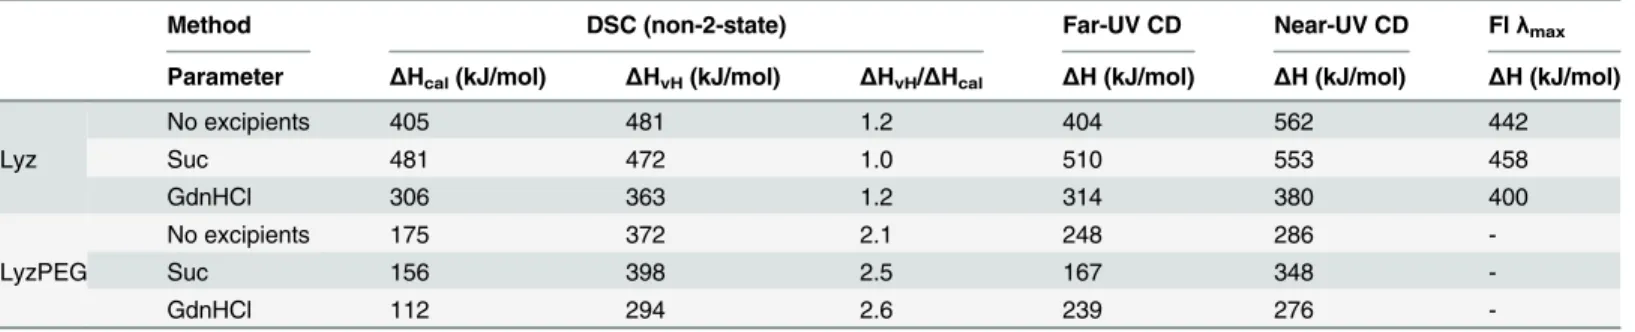
The CD and fluorescence derived enthalpies correspond to the DSC derived van’t Hoff enthalpies. Near-UV CD is a global fit of 257 nm and 288.5 nm. Fluorescence peak maximum revealed that Lyz in sucrose had an additional transition at 50°C withΔH = 495 kJ/mol.
DSC
The DSC data provided an estimate for the Tmvalue for Lyz at 73.5°C and 1.6°C lower for Lyz-PEG at 71.9°C. In the presence of sucrose the Tmof Lyz is shifted to 79.0°C, an increase of 5.5°C, and in the presence of GdnHCl the Tmis decreased by 16.9°C to 56.6°C. LyzPEG shows similar melting temperature shifts as Lyz in response to the addition of excipients, although all melting temperatures are lower than those for Lyz. In sucrose LyzPEG has a Tmof 76.3°C, which is a stabilization of 4.4°C, and GdnHCl lowers the LyzPEG Tmto 56.3°C, which is a decrease of 15.6°C. The transition midpoint temperatures are presented graphically inFig 2A
and the differences in Tmvalues as a function of sucrose and GdnHCl are presented inFig 2B and 2C, respectively.
The calorimetric melting enthalpy (ΔHcal) of Lyz is 405 kJ/mol which corresponds reason-ably well with previous studies [55]. For LyzPEG, however, the calorimetric enthalpy is less than half (175 kJ/mol) of that value, while the ratio of van‘t Hoff enthalpy (ΔHvH) to calorimet-ric enthalpyΔHcalis ca. two, suggesting that LyzPEG unfolds as a dimer. For Lyz theΔHcal andΔHvH, were essentially the same consistent with Lyz being a monomer. AllΔHcal,ΔHvH values andΔHvH/ΔHcalratios are summarized inTable 1. WithΔHcal= 481 kJ/mol sucrose clearly stabilizes Lyz, but for LyzPEG the addition of sucrose decreasesΔHcalto 156 kJ/mol. The denaturant GdnHCl reduces the calorimetric melting enthalpy to 306 kJ/mol and 112 kJ/ mol for Lyz and LyzPEG, respectively, which means both proteins are destabilized to the same extent. TheΔHvH/ΔHcalratios suggest that LyzPEG stays dimeric in the presence of both excipients.
TmandΔHcalobtained from the DSC data in all three solution conditions were used to calculate the heat capacity change upon unfolding,ΔCp, of Lyz and LyzPEG (S5 Fig). This approach givesΔCpof 7.35 kJ/(Kmol) and 2.68 kJ/(Kmol) for the Lyz and LyzPEG,
respec-tively. TheΔCpfor Lyz compares well with earlier studies [39,56]. TheΔCpfor LyzPEG is lower by more than a factor 2, which is in agreement with the decreased overall structure of the PEGylated protein observed by CD. The heat capacity change upon unfolding was then used to Table 1. Enthalpy of unfolding from various techniques.
Method DSC (non-2-state) Far-UV CD Near-UV CD Flλmax
Parameter ΔHcal(kJ/mol) ΔHvH(kJ/mol) ΔHvH/ΔHcal ΔH (kJ/mol) ΔH (kJ/mol) ΔH (kJ/mol)
Lyz
No excipients 405 481 1.2 404 562 442
Suc 481 472 1.0 510 553 458
GdnHCl 306 363 1.2 314 380 400
LyzPEG
No excipients 175 372 2.1 248 286
-Suc 156 398 2.5 167 348
-GdnHCl 112 294 2.6 239 276
estimate the Gibbs free energy function for both proteins using the modified Gibbs-Helmholtz equation, and as anticipated the LyzPEG was less stable at all temperatures between 0°C and Tmcompared to Lyz. At room temperature theΔG value of LyzPEG was about half of that of the native Lyz (S5 Fig).
CD
Thermal denaturation studies by CD show similar trends as the DSC analysis (Fig 2and
Table 1). For the far-UV CD melting the Tmvalues are ca. 1–4°C lower than those measured by DSC for both proteins and in all solution conditions. In sucrose the Tmof Lyz increases by 5.1°C, similar to that observed by DSC, and the LyzPEG Tmincreases by 2.5°C, almost half of that observed by DSC. In the presence of GdnHCl the far-UV CD Tmis decreased ca. 2°C fur-ther for both proteins compared to DSC.
In near-UV CD the changes for both Lyz and LyzPEG also occur at a lower temperature than measured by DSC. The Tmvalues are also lower than in the far-UV CD experiments except in the presence of GdnHCl, where a slightly higher Tmis observed as compared to that determined by far-UV CD.
The melting enthalpy for Lyz determined from the far-UV CD is lower than that observed by DSC, while the melting enthalpy for Lyz in presence of both excipients agrees better with the DSC data (Table 1) under both solution conditions.ΔH for LyzPEG is also lower than expected when comparing to the DSCΔHvHvalue. The addition of sucrose to LyzPEG appar-ently decreases the melting enthalpy, whereas this remains almost constant in the DSC data. Upon addition of GdnHCl the LyzPEG far-UV CD melting enthalpy remains the same as in buffer, and is twice as high as the correspondingΔHcal.
The melting enthalpies calculated from the near-UV CD are generally higher for both modi-fied and unmodimodi-fied proteins compared to DSC and far-UV CD. The only exception is that LyzPEG near-UV CD melting enthalpies are lower compared to the DSC van’t Hoff enthalpies. For Lyz the addition of sucrose does not change the enthalpy. Addition of GdnHCl reduces the enthalpy to the same extent as observed with DSC and far-UV CD. The near-UV CD enthalpy for LyzPEG in buffer is half that of Lyz. It is a bit higher than the far-UV CD enthalpy, much higher than theΔHcal, but lower than theΔHvH. Excipients exert a different effect on LyzPEG compared to Lyz: for LyzPEG the enthalpy is greatly increased by addition of sucrose, whereas addition of GdnHCl has no effect. The latter was also observed with far-UV CD.S1 Text con-tains a more elaborate discussion on data quality, including explanations for the apparent dis-crepancies in the enthalpy values obtained by the different techniques.
Fluorescence
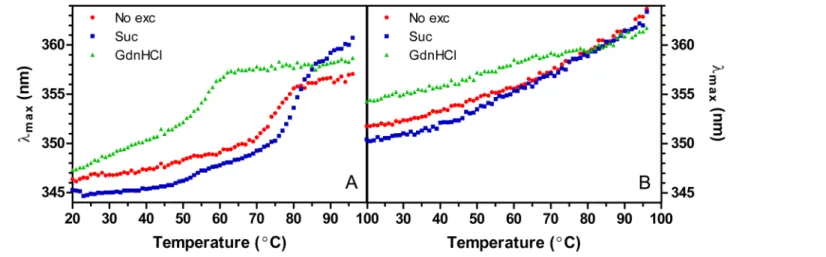
Characterization of the temperature-induced unfolding was also attempted using fluorescence spectroscopy. Lyz displays a clear melting transition (Fig 3A) while LyzPEG merely shows a gradual redshift during heating (Fig 3B) which does not allow calculation of the denaturation parameters. TheΔH (Table 1) and Tmvalues of Lyz correspond well with the calorimetric data. The melting points of Lyz are 75.2°C, 79.7°C and 56.6°C for no excipient, sucrose and GdnHCl containing solutions, respectively. An additional minor transition at 50°C is observed for Lyz in sucrose.
The fluorescence traces of the LyzPEG solutions lack clear melting transitions and theλmax
Discussion
Structural features exploited in lysozyme
Lysozyme is a very-well characterized protein and the 3D structure has been determined both in solution by NMR and in crystal form by protein X-ray crystallography.Fig 4depicts the structure of Lyz from Schwalbeet al. [42], with the two lysines that are most likely PEGylated marked in yellow. The fold of the protein is characterized by two sub-domains,αandβ. The
α-domain consists of a 310-helix and 4α-helices (res. no. 1–35 and 85–129), and theβ-domain is composed of a short triple-stranded antiparallelβ-sheet, a loop and a 310-helix (res. no. 36–
84). Theα-domain is stabilized by a hydrophobic core. Additionally, 4 disulphide bonds play an important role for the stabilization of the tertiary and secondary structure [57]. There is a general consensus that Lyz unfolds in a 2-state unfolding process [58,59] although some studies have suggested a more complicated unfolding process at low pH [53]. Of spectroscopic relevance there are 6 Trp and 3 Tyr and 3 Phe units in the native protein. The bulk of Lyz fluo-rescence is attributed only to Trp residues 62 and 108 (Fig 4, marked in green) [60]. The acces-sible surface area (ASA) calculated by PoPMuSiC shows that in the native state the side chain of Trp-62 is somewhat solvent-exposed (ASA = 42%) while Trp-108 is buried (ASA = 5.7%). Emission from the other Trp units is likely quenched by nearby cystine groups [60,61].
Effect of PEGylation
All analytical techniques used in the current study indicate that our PEGylated lysozyme has an altered conformation and stability compared to the native lysozyme, which corresponds to our earlier finding [13]. The far- and near-UV CD spectra indicate a loss ofα-helical structure in PEGylated protein and some local changes around the Trp residues. As depicted inFig 4
both PEG-chains are attached toα-helical motifs which may destabilize the implicated helices resulting in a reducedα-helix signal. A reduced far-UV CD signal has been observed before for LyzPEG monoPEGylated at Lys-33 [28].
The thermal denaturation studies show both a reduced thermal stability of LyzPEG, indi-cated by a lower melting temperature, and a reduced thermodynamic stability, with theΔGu value at 25°C being about half of that found for Lyz, suggesting that the LyzPEG is not fully folded. The latter is reflected in the lower enthalpy of denaturation at the Tmand the dimin-ished Gibbs free energy function in the temperature range of 0°C—Tm(S5 Fig). While Fig 3. Peak maximum of fluorescence spectra as function of temperature and excipient.A) Lyz B) LyzPEG.
denaturation of the native lysozyme is consistent with the 2-state model, the DSC melting pro-file of LyzPEG can only be fitted to the non-2-state model, indicating a change in the denatur-ation mechanism of LyzPEG. Unfortunately, material limitdenatur-ations prevented further eluciddenatur-ation of the unfolding mechanism and the potential contribution of kinetically controlled events. This introduces an uncertainty in the validity of the thermodynamic analysis, which in turn Fig 4. Ribbon structure of hen egg white lysozyme (pdb entry 1E8L).The PEGylated lysines are indicated in yellow and the fluorescence active tryptophans are indicated in green. The sequence of lysozyme is given below the structure with the same color indications for the mentioned lysines and tryptophans.
means the results can only be used for qualitative comparative purposes. The ratio of van‘t Hoff to calorimetric enthalpy of 2:1 (Table 1) suggests that the PEGylated protein forms a dimer. At the same time, the total calorimetric enthalpy of LyzPEG is lower, indicating that the energy of dimerization is insufficient for compensating the enthalpy loss from the partial unfolding. The dimeric nature of LyzPEG is supported by the small-angle X-ray scattering studies reported in our previous publication [13]. However, fitting the melting curves of Lyz-PEG to a model where the protein unfolding is coupled to dimer dissociation was unsuccessful, failing to reproduce the sharp shape of the LyzPEG denaturation transition. Inability of the dimer-denaturation model to properly describe DSC data could be due to the fact that this model does not take into account the partially denatured starting state of LyzPEG. In addition, it is unclear to what extent the potential interference from the PEG moiety could affect the shape of the DSC profile. In contrast, the dimer-denaturation model described the CD data very well, indicating that the spectroscopic techniques were insensitive to the selection of the fitting model as both monomer and dimer fitting results were of equally good quality.
The fluorescence spectroscopic analysis of LyzPEG spectra shows a significant red-shift of the peak maximum suggesting increased solvent exposure of the fluorescent tryptophans. This is another indication of the partially denatured initial state of LyzPEG with a consequent expo-sure of Trp residues that are normally buried in the native Lyz. In addition, the absence of a clear transition in the LyzPEG fluorescence melting data suggests that the local environment around the tryptophans is already disrupted at room temperature, so that increasing tempera-tures lead only to the gradual shifts in Trp fluorescence properties.
Another potential explanation for the altered fluorescent properties of LyzPEG is the pres-ence of PEG. It is unlikely that the dimer formation causes a quenching of the two active tryp-tophans by cysteine groups of the neighboring protein. Such a quenching would have reduced the overall fluorescence intensity, but the fluorescence intensity was found to be constant within the concentration uncertainties for all solutions (S4 Fig). Furnesset al. found that the cleft between theα- andβ-domain is a binding site for free 4 kDa PEG [62]. Both Trp-62 and Trp-108 are positioned close to the cleft and thus close proximity to PEG could shield or inter-fere with the spectroscopic changes during unfolding.
Effect of sucrose
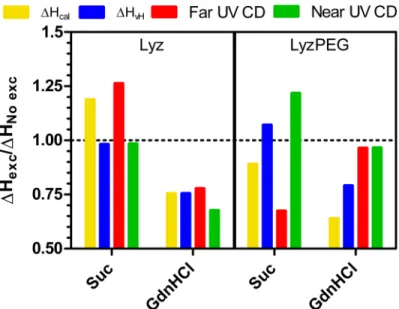
Addition of the preferentially excluded excipient sucrose to Lyz and LyzPEG has no impact on the secondary structure, and a minor effect on the tertiary structure of the protein, as indicated by far- and near-UV CD spectra, respectively (Fig 1). This minor effect is not unexpected, as the preferential exclusion of sucrose is known to reduce the structural flexibility of a protein [63] without affecting the secondary structure [64]. As also expected, the addition of sucrose resulted in increased Tmvalues [32,40,65]. This increase (Fig 2B), 5–6°C for Lyz, and 2.5–5°C for LyzPEG, is observed in all techniques used. The large variability of the change in Tmfor LyzPEG is unexpected, with the Tmdetermined by far-UV CD (222 nm) responsible for the low extreme. We have no unequivocal explanation for this variability, but it may be due to the dimeric nature of the LyzPEG and the associated complex unfolding process. The effect of sucrose on the LyzPEG appears to have the largest impact on the tertiary fold around some Phe residues, as suggested by the relatively large change in the near-UV CD spectrum around 257 nm. The relative change in van’t Hoff enthalpy as a result of excipients (Fig 5) is fairly constant for Lyz with noΔHvHchange in the sucrose solution, except in far-UV where it is higher.
and concomitant larger noise levels that impacted the fitting. As noted earlier, an increase for the unfolding enthalpy is expected upon addition of a preferentially excluded excipient [33,
66], and in principle this should be observed irrespective of the protein folding characteristic that is being followed. In summary, our data do not show any unequivocal differences of the impact of sucrose on the thermal stability between Lyz and LyzPEG.
Effect of GdnHCl
Lyz denaturation by GdnHCl is known to be pH dependent. At room temperature and neutral pH Lyz starts to unfold at GdnHCl concentrations around 3 M [34,35], at pH 4–6 it is dena-tured above 2 M [67–70] and 2 M is sufficient to start denaturing Lyz below pH 4 [49,71]. Thus, at the pH used in this study (7.4) no significant unfolding is expected. This is confirmed by the far- and near-UV CD (Fig 1), which show no change in the Lyz secondary structure, minor changes in the Lyz tertiary structure, and also minor changes in the secondary and ter-tiary structure of LyzPEG. As anticipated, GdnHCl does have a destabilizing effect, as shown by the significant reduction in unfolding temperature. In our case the Lyz Tmis decreased by ca. 16.5–18.5°C and the LyzPEG Tmis decreased a bit less by 14.5–18.0°C (Fig 2C). As expected upon a decrease in melting temperature, the unfolding enthalpy is reduced by a fourth for Lyz in the presence of GdnHCl (Fig 5) in both DSC, far- and near-UV CD. For LyzPEG this is not the case. A similar reduction is observed inΔHvH, but there are no changes for the far-UV or near-far-UV CD analyses. The DSC results suggest that LyzPEG responds similarly to GdnHCl as Lyz. While there are some inconsistencies between CD spectral data and CD ther-mal denaturation data both for far- and near-UV CD on the effect of GdnHCl, these are sther-mall. In conclusion, GdnHCl also does not cause any major difference in behavior of Lyz versus LyzPEG.
Fig 5. Relative change in enthalpy of unfolding upon excipient addition.Yellow: DSC calorimetric enthalpy from non-2-state fit, Blue: DSC van’t Hoff enthalpy from non-2-state fit, red: far-UV CD at 222 nm (α
-helical content) and green: near-UV CD global fit of 257 nm (Phe signal) and 288.5 nm (Trp signal). The LyzPEG ratios are calculated based on lower absolute values (seeTable1) likely with a larger impact of fitting uncertainty and thus resulting in an apparent larger variation.
Conclusion
Overall, our results show that within the limits of the different methods PEGylation of lyso-zyme has no, or a minor, impact on the preferential interaction with our model excipients. The preferential exclusion of sucrose and preferential binding of GdnHCl are somewhat lower for LyzPEG, as shown primarily by the change in melting temperature, but this may well be a result of the altered folding of LyzPEG caused by the PEGylation itself. Thus, the thermody-namic stabilization and destabilization of PEGylated proteins by preferentially active excipients is likely similar to that observed for the unmodified protein. This then means that PEGylated proteins can be stabilized using the same preferential interaction formulation principles as used for non-PEGylated proteins. Further experiments including multiple proteins should be performed to support this conclusion.
Supporting Information
S1 Fig. DSC results and fitting.The first row shows raw data (insert: protein and buffer) as well as the data with buffer subtracted and the cubic baseline to be subtracted before fitting. The second row shows area under the curve (AUC) which is comparable with the enthalpy (only this number is based on the true data whereasΔH is based on the fit of the data). The 3rd row shows the simplest fitting model: a 2-state fit (data in black, fit in red). The fit is very poor for LyzPEG in GdnHCl and these values were therefore not used. The 4throw shows the fit to a non-2-state model and the Tmvalues are listed inS2 Table. It was not possible to fit LyzPEG in presence of sucrose to a 2-state model.
(PDF)
S2 Fig. CD melting curves (buffer subtracted) and fitting to a 2-state model whereΔCp= 0. 1strow shows far-UV CD melting at 222 nm corresponding to the change in secondary struc-ture (especiallyα-helix content). The 2ndrow shows near-UV CD melting at 257 nm corre-sponding to the phenylalanine signal. The 3rdrow shows near-UV CD melting at 288.5 nm corresponding to the Trp fine structure. The 4throw shows the global fit of the two near-UV CD data sets. The Tm-values for the far-UV and global fit of near-UV data are presented inS1 Table. The TmandΔH values for the individual near-UV fit are presented inS3 Table. (PDF)
S3 Fig. Global fit of near-UV CD data (257 nm and 288.5 nm) of LyzPEG to a dimer model.
A) no excipients B) 1.0 M sucrose C) 2.0 M GdnHCl. For the simple monomer unfolding model the transition midpoint temperature (Tm) coincides with the temperature, where the change in Gibbs free energy is equal to 0 (TΔG = 0). In case of the dimer unfolding model the fit-ted TΔG = 0values are higher than the Tmvalues [57]. However, inspection of the fit indicates that population of the denatured state becomes 50% at the temperatures close to the Tmvalues calculated from the monomer unfolding model.
(PDF)
S4 Fig. Fluorescence spectra of Lyz and LyzPEG in HEPES buffer pH 7.4 at 20°C.The graphs demonstrate the apparent red-shift in LyzPEG whereas the fluorescence intensity remains the same.
(PDF)
contributions mediate the role of disulfide bonds on the conformational stability of interleukin-4. Protein Sci. 2006;15(1):33–44.
(PNG)
S1 Table. Melting transition temperatures from DSC and CD with Lyz and LyzPEG in vari-ous solution conditions.Values are presented graphically inFig 2Ain the article.
(DOCX)
S2 Table. DSC results of values obtained with different models.Integration was performed using a linear baseline while the 2-state and non-2-state were fitted using a cubic baseline as seen inS1 Fig. Integration results are AUC which is comparable toΔH and Tmaxwhich is com-parable to Tm. Lyz fitted well to a 2-state model and are included here. Values from the non-2-state fit presented in the article are included here for comparison.
(DOCX)
S3 Table. Near-UV CD 2-state fit of single data sets recorded at 257 and 288.5 nm.
(DOCX)
S1 Text. CD data quality
(DOCX)
Acknowledgments
Funding was kindly provided by the Advanced Technology Foundation and the Ministry of Science, Technology and Innovation for the NanoDSC instrument, by Apotekerfonden af 1991 for the Fluorolog, by the Drug Research Academy for the purchase of the NanoDrop 2000c and the Danish Agency for Science, Technology and Innovation for a PhD mobility stipend. The funders had no role in study design, data collection and analysis, decision to publish, or preparation of the manuscript. Co-author MRK is currently employed by Symphogen A/S, however, the work performed in connection with the article itself commenced prior to MRK's employment with Symphogen A/S and was then completed outside of her regular working hours at Symphogen A/S. MRK asked and received permission from Symphogen A/S to work on this paper. Symphogen A/S did not have any role in the study design, data collection and analysis, decision to publish, or preparation of the manuscript. The specific role of this author is articulated in the‘author contributions’section.
Author Contributions
Conceived and designed the experiments: LSH PWT MRK MvdW. Performed the experi-ments: LSH PWT. Analyzed the data: LSH PWT MRK. Contributed reagents/materials/analy-sis tools: LSH PWT MRK MvdW. Wrote the paper: LSH PWT MRK MvdW.
References
1. Pedotti R, Mitchell D, Wedemeyer J, Karpuj M, Chabas D, Hattab EM, et al. An unexpected version of horror autotoxicus: Anaphylactic shock to a self peptide. Nat Immunol. 2001; 2(3):216–222. PMID: 11224520
2. Bailon P, Palleroni A, Schaffer CA, Spence CL, Fung WJ, Porter JE, et al. Rational design of a potent, long-lasting form of interferon: A 40 kda branched polyethylene glycol-conjugated interferon alpha-2a for the treatment of hepatitis C. Bioconj Chem. 2001; 12(2):195–202.
3. Alconcel SNS, Baas AS, Maynard HD. FDA-approved poly(ethylene glycol)–protein conjugate drugs. Polym Chem. 2011; 2(7):1442–1448.
5. Pasut G, Veronese FM. PEGylation of proteins as tailored chemistry for optimized bioconjugates. In: Satchi-Fainaro R, Duncan R, editors. Polymer therapeutics I: Polymers as drugs, conjugates and gene delivery systems. Advances in polymer science. 1st ed. Berlin Heidelberg: Springer; 2006. p. 95–134. 6. Hinds K, Koh JJ, Joss L, Liu F, Baudys M, Kim SW. Synthesis and characterization of poly(ethylene
gly-col)-insulin conjugates. Bioconj Chem. 2000; 11(2):195–201.
7. Pasut G, Veronese FM. Polymer-drug conjugation, recent achievements and general strategies. Prog Polym Sci. 2007; 32(8–9):933–961.
8. Pfister D, Morbidelli M. Process for protein PEGylation. J Control Release. 2014; 180:134–149. doi:10. 1016/j.jconrel.2014.02.002PMID:24531008
9. Tuesca AD, Reiff C, Joseph JI, Lowman AM. Synthesis, characterization and in vivo efficacy of PEGy-lated insulin for oral delivery with complexation hydrogels. Pharm Res. 2009; 26(3):727–739. doi:10. 1007/s11095-008-9816-8PMID:19145407
10. Harris JM, Martin NE, Modi M. Pegylation—A novel process for modifying pharmacokinetics. Clin Phar-macokinet. 2001; 40(7):539–551. PMID:11510630
11. Fishburn CS. The pharmacology of PEGylation: Balancing PD with PK to generate novel therapeutics. J Pharm Sci. 2008; 97(10):4167–4183. doi:10.1002/jps.21278PMID:18200508
12. Ivens IA, Baumann A, McDonald TA, Humphries TJ, Michaels LA, Mathew P. PEGylated therapeutic proteins for haemophilia treatment: A review for haemophilia caregivers. Haemophilia. 2013; 19(1):11– 20. doi:10.1111/j.1365-2516.2012.02931.xPMID:22913770
13. Holm LS, McUmber A, Rasmussen JE, Obiols-Rabasa M, Thulstrup PW, Kasimova MR, et al. The effect of protein PEGylation on physical stability in liquid formulation. J Pharm Sci. 2014; 103 (10):3043–3054. doi:10.1002/jps.24094PMID:25139193
14. Rajan RS, Li TS, Aras M, Sloey C, Sutherland W, Arai H, et al. Modulation of protein aggregation by polyethylene glycol conjugation: GCSF as a case study. Protein Sci. 2006; 15(5):1063–1075. PMID: 16597829
15. Plesner B, Fee CJ, Westh P, Nielsen AD. Effects of PEG size on structure, function and stability of PEGylated BSA. Eur J Pharm Biopharm. 2011; 79(2):399–405. doi:10.1016/j.ejpb.2011.05.003PMID: 21620970
16. Pinholt C, Bukrinsky JT, Hostrup S, Frokjaer S, Norde W, Jorgensen L. Influence of PEGylation with lin-ear and branched PEG chains on the adsorption of glucagon to hydrophobic surfaces. Eur J Pharm Bio-pharm. 2011; 77(1):139–147. doi:10.1016/j.ejpb.2010.11.001PMID:21074613
17. Palm T, Esfandiary R, Gandhi R. The effect of PEGylation on the stability of small therapeutic proteins. Pharm Dev Technol. 2011; 16(5):441–448. doi:10.3109/10837450.2010.535830PMID:21261458 18. Stigsnaes P, Frokjaer S, Bjerregaard S, van de Weert M, Kingshott P, Moeller EH. Characterisation and physical stability of PEGylated glucagon. Int J Pharm. 2007; 330(1–2):89–98. PMID:17023127 19. Tattini V, Parra DF, Polakiewicz B, Pitombo RNM. Effect of lyophilization on the structure and phase
changes of PEGylated-bovine serum albumin. Int J Pharm. 2005; 304(1–2):124–134. PMID:16188407 20. Mosharraf M, Malmberg M, Fransson J. Formulation, lyophilization and solid-state properties of a
pegy-lated protein. Int J Pharm. 2007; 336(2):215–232. PMID:17207591
21. Heller MC, Carpenter JF, Randolph TW. Conformational stability of lyophilized PEGylated proteins in a phase-separating system. J Pharm Sci. 1999; 88(1):58–64. PMID:9874703
22. Wang W. Instability, stabilization, and formulation of liquid protein pharmaceuticals. Int J Pharm. 1999; 185(2):129–188. PMID:10460913
23. Manning M, Chou D, Murphy B, Payne R, Katayama D. Stability of protein pharmaceuticals: An update. Pharm Res. 2010; 27(4):544–575. doi:10.1007/s11095-009-0045-6PMID:20143256
24. Hawe A, Wiggenhorn M, van de Weert M, Garbe JHO, Mahler H-C, Jiskoot W. Forced degradation of therapeutic proteins. J Pharm Sci. 2012; 101(3):895–913. doi:10.1002/jps.22812PMID:22083792 25. Lee JC, Lee LL. Preferential solvent interactions between proteins and polyethylene glycols. J Biol
Chem. 1981; 256(2):625–631. PMID:7192709
26. Arakawa T, Timasheff SN. Mechanism of polyethylene glycol interaction with proteins. Biochemistry. 1985; 24(24):6756–6762. PMID:4074726
27. Suckau D, Mak M, Przybylski M. Protein surface topology-probing by selective chemical modification and mass-spectrometric peptide-mapping Proc Natl Acad Sci U S A. 1992; 89(12):5630–5634. PMID: 1608973
29. Lee H, Park TG. A novel method for identifying PEGylation sites of protein using biotinylated PEG deriv-atives. J Pharm Sci. 2003; 92(1):97–103. PMID:12486686
30. Yunus WMbM, Rahman AbA. Refractive index of solutions at high concentrations. Appl Opt. 1988; 27 (16):3341–3343. doi:10.1364/AO.27.003341PMID:20539378
31. Nozaki Y. [3] the preparation of guanidine hydrochloride. In: Hirs CHW, Timasheff SN, editors. Methods enzymol: Academic Press; 1972. p. 43–50. PMID:4680720
32. Lee JC, Timasheff SN. The stabilization of proteins by sucrose. J Biol Chem. 1981; 256(14):7193– 7201. PMID:7251592
33. Arakawa T, Timasheff SN. Stabilization of protein structure by sugars. Biochemistry. 1982; 21 (25):6536–6544. PMID:7150574
34. Kurtin WE, Lee JM. The free energy of denaturation of lysozyme: An undergraduate experiment in bio-physical chemistry. Biochem Mol Biol Educ. 2002; 30(4):244–247.
35. Ahmad F, Bigelow CC. Estimation of the free energy of stabilization of ribonuclease A, lysozyme,α
-lact-albumin, and myoglobin. J Biol Chem. 1982; 257(21):12935–12938. PMID:7130187
36. Jelesarov I, Bosshard HR. Isothermal titration calorimetry and differential scanning calorimetry as com-plementary tools to investigate the energetics of biomolecular recognition. J Mol Recognit. 1999; 12 (1):3–18. PMID:10398392
37. Ferreira M, Hofer C, Raemy A. A calorimetric study of egg white proteins. J Therm Anal. 1997; 48 (3):683–690.
38. Wu F-G, Luo J-J, Yu Z-W. Unfolding and refolding details of lysozyme in the presence of beta-casein micelles. Phys Chem Chem Phys. 2011; 13(8):3429–3436. doi:10.1039/c0cp01184cPMID:21264395 39. Liu YF, Sturtevant JM. The observed change in heat capacity accompanying the thermal unfolding of
proteins depends on the composition of the solution and on the method employed to change the tem-perature of unfolding. Biochemistry. 1996; 35(9):3059–3062. PMID:8608146
40. Cueto M, Dorta MJ, Munguia O, Llabres M. New approach to stability assessment of protein solution formulations by differential scanning calorimetry. Int J Pharm. 2003; 252(1–2):159–166. PMID: 12550791
41. Zielenkiewicz W, Swierzewski R, Attanasio F, Rialdi G. Thermochemical, volumetric and spectroscopic properties of lysozyme–poly(ethylene) glycol system. J Therm Anal Calorim. 2006; 83(3):587–595. 42. Schwalbe H, Grimshaw SB, Spencer A, Buck M, Boyd J, Dobson CM, et al. A refined solution structure
of hen lysozyme determined using residual dipolar coupling data. Protein Sci. 2001; 10(4):677–688. PMID:11274458
43. Dehouck Y, Grosfils A, Folch B, Gilis D, Bogaerts P, Rooman M. Fast and accurate predictions of pro-tein stability changes upon mutations using statistical potentials and neural networks: PoPMuSiC-2.0. Bioinformatics. 2009; 25(19):2537–2543. doi:10.1093/bioinformatics/btp445PMID:19654118 44. Greenfield NJ. Using circular dichroism spectra to estimate protein secondary structure. Nat Protoc.
2006; 1(6):2876–2890. PMID:17406547
45. Kelly SM, Jess TJ, Price NC. How to study proteins by circular dichroism. Biochim Biophys Acta. 2005; 1751(2):119–139. PMID:16027053
46. Goux WJ, Hooker TM. The chiroptical properties of proteins. II. Near-ultraviolet circular dichroism of lysozyme. Biopolymers. 1980; 19(12):2191–2208. PMID:7193056
47. Blumlein A, McManus JJ. Reversible and non-reversible thermal denaturation of lysozyme with varying pH at low ionic strength. Biochim Biophys Acta. 2013; 1834(10):2064–2070. doi:10.1016/j.bbapap. 2013.06.001PMID:23774197
48. Itzhaki LS, Evans PA, Dobson CM, Radford SE. Tertiary interactions in the folding pathway of hen lyso-zyme: Kinetic studies using fluorescent probes. Biochemistry. 1994; 33(17):5212–5220. PMID: 8172895
49. Tanford C, Aune KC. Thermodynamics of the denaturation of lysozyme by guanidine hydrochloride. III. Dependence on temperature. Biochemistry. 1970; 9(2):206–211. PMID:5412660
50. Arakawa T, Philo JS, Kita Y. Kinetic and thermodynamic analysis of thermal unfolding of recombinant erythropoietin. Biosci Biotechnol Biochem. 2001; 65(6):1321–1327. PMID:11471731
51. Ohtake S, Kita Y, Arakawa T. Interactions of formulation excipients with proteins in solution and in the dried state. Adv Drug Del Rev. 2011; 63(13):1053–1073.
53. Privalov G, Kavina V, Freire E, Privalov PL. Precise scanning calorimeter for studying thermal proper-ties of biological macromolecules in dilute solution. Anal Biochem. 1995; 232(1):79–85. PMID: 8600837
54. Pace CN. Measuring and increasing protein stability. Trends Biotechnol. 1990; 8(0):93–98.
55. van de Weert M, Andersen MB, Frokjaer S. Complex coacervation of lysozyme and heparin: Complex characterization and protein stability. Pharm Res. 2004; 21(12):2354–2359. PMID:15648269 56. Makhatadze GI, Privalov PL. Protein interactions with urea and guanidinium chloride: A calorimetric
study. J Mol Biol. 1992; 226(2):491–505. PMID:1322462
57. Matsuo K, Watanabe H, Tate S, Tachibana H, Gekko K. Comprehensive secondary-structure analysis of disulfide variants of lysozyme by synchrotron-radiation vacuum-ultraviolet circular dichroism. Pro-teins: Struct Funct Bioinf. 2009; 77(1):191–201.
58. Tanford C, Aune KC, Ikai A. Kinetics of unfolding and refolding of proteins: III. Results for lysozyme. J Mol Biol. 1973; 73(2):185–197. PMID:4347737
59. Griko YV, Freire E, Privalov G, Van Dael H, Privalov PL. The unfolding thermodynamics of c-type lyso-zymes: A calorimetric study of the heat denaturation of equine lysozyme. J Mol Biol. 1995; 252(4):447– 459. PMID:7563064
60. Imoto T, Rupley JA, Tanaka F, Forster LS. Fluorescence of lysozyme—emissions from tryptophan resi-due 62 and 108 and energy migration. Proc Natl Acad Sci U S A. 1972; 69(5):1151–1155. PMID: 4504329
61. Formoso C, Forster LS. Tryptophan fluorescence lifetimes in lysozyme. J Biol Chem. 1975; 250 (10):3738–3745. PMID:236300
62. Furness EL, Ross A, Davis TP, King GC. A hydrophobic interaction site for lysozyme binding to polyeth-ylene glycol and model contact lens polymers. Biomaterials. 1998; 19(15):1361–1369. PMID:9758036 63. Kendrick BS, Chang BS, Arakawa T, Peterson B, Randolph TW, Manning MC, et al. Preferential exclu-sion of sucrose from recombinant interleukin-1 receptor antagonist: Role in restricted conformational mobility and compaction of native state. Proc Natl Acad Sci USA. 1997; 94(22):11917–11922. PMID: 9342337
64. Kim YS, Jones LS, Dong AC, Kendrick BS, Chang BS, Manning MC, et al. Effects of sucrose on confor-mational equilibria and fluctuations within the native-state ensemble of proteins. Protein Sci. 2003; 12 (6):1252–1261. PMID:12761396
65. Back JF, Oakenfull D, Smith MB. Increased thermal stability of proteins in the presence of sugars and polyols. Biochemistry. 1979; 18(23):5191–5196. PMID:497177
66. Gekko K, Koga S. Increased thermal stability of collagen in the presence of sugars and polyols. J Bio-chem. 1983; 94(1):199–205. PMID:6619109
67. Tanford C, Pain RH, Otchin NS. Equilibrium and kinetics of the unfolding of lysozyme (muramidase) by guanidine hydrochloride. J Mol Biol. 1966; 15(2):489–504. PMID:5915179
68. Liu W, Cellmer T, Keerl D, Prausnitz JM, Blanch HW. Interactions of lysozyme in guanidinium chloride solutions from static and dynamic light-scattering measurements. Biotechnol Bioeng. 2005; 90(4):482– 490. PMID:15778988
69. Ahmad F, Yadav S, Taneja S. Determining stability of proteins from guanidinium chloride transition curves. Biochem J. 1992; 287:481–485. PMID:1445206
70. Laurents DV, Baldwin RL. Characterization of the unfolding pathway of hen egg white lysozyme. Bio-chemistry. 1997; 36(6):1496–1504. PMID:9063898