Association of
GH and IGF-1 polymorphisms with growth traits
in a synthetic beef cattle breed
Andréa Pozzi Pereira
1, Maurício Mello de Alencar
2, Henrique Nunes de Oliveira
3and Luciana Correia de Almeida Regitano
21
Universidade Federal de São Carlos, Departamento de Genética e Evolução, São Carlos, SP, Brazil.
2Embrapa Pecuária Sudeste, São Carlos, SP, Brazil.
3Universidade Estadual de São Paulo, Departamento de Melhoramento e Nutrição Animal,
Botucatu, SP, Brazil.
Abstract
The Canchim beef cattle (5/8 Charolais + 3/8 Zebu) has been selected for meat production in Brazil since late 1950. In the present work the effects of growth hormone (GH) and insulin-like growth factor 1 (IGF-1) polymorphisms were investigated in 688 animals born between 1998 and 2000. These animals belonged to two genetic groups,i.e., traditional and new lineages. Genotype effects on expected breeding values for birth weight (BW), weaning weight (WW) and yearling weight (YW) were investigated by the least square method. Significant effects were found forGH genotype on YW (p ≤ 0.05), with positive effects associated with the LV (leucine/valine) genotype. For IGF-1 genotypes, significant effects were found on BW (p≤0.01) and YW (p≤0.01). Average substitution effects forIGF-1 alleles estimated by regression analysis suggested a positive effect of theIGF-1 225 bp allele on BW and of the 229 bp allele on YW.
Key words:beef cattle, genetic association, genotype, growth hormone, insulin-like growth factor 1.
Received: April 15, 2004; Accepted: February 15, 2005.
Introduction
Crosses among breeds allow the formation of new breeds, selected for favorable traits including adaptation to the environment. The Canchim beef cattle breed was pro-duced in Brazil by crosses between Charolais (Bos taurus) and several Zebu (Bos indicus) breeds such as Guzerat, Nelore and Indubrazil, with a higher contribution of the lat-ter (Alencar, 1988), to combine the early maturity and pro-ductivity associated with European beef cattle and the rusticity attributed to Zebu breeds. Canchim animals, with a 5/8 Charolais + 3/8 Zebu genetic composition, have been selected for meat production traits since 1950.
Quantitative traits are often controlled by a great number of genes. Localization of QTLs (Quantitative Trait Loci) can be done by linkage disequilibrium analysis or by candidate gene approach.
Candidate genes have known biological functions re-lated to the development or physiology of an important trait (Rothschildet al., 1997). Such genes can encode structural
proteins or a member in a regulatory or biochemical path-way affecting the expression of the trait (Bryne and McMullen, 1996) and can be tested as putative QTLs (Yao
et al., 1996).
Growth in animals is controlled by a complex system, in which the somatotropic axis plays a key role. The genes that operate in the somatotropic axis are responsible for the postnatal growth, mainly GH that acts on the growth of bones and muscles mediated by IGF-1 (Sellier, 2000). The growth hormone (GH) and insulin-like growth factor 1 (IGF-1) genes are candidates for growth in bovine, since they play a key role in growth regulation and development (Breier, 1999; Hossneret al., 1997; Tuggle and Trenkle, 1996). Effects of GH on growth are observed in several tis-sues, including bone, muscle and adipose tissue. These ef-fects result from both direct action of GH on the partition of nutrients and cellular multiplication and IGF-1-mediated action stimulating cell proliferation and metabolic pro-cesses associated to protein deposition (Boyd and Bauman, 1989). IGF-1 stimulates the protein metabolism and is im-portant for the function of some organs, being considered a factor of cellular proliferation and differentiation.
www.sbg.org.br
Send correspondence to Luciana de Almeida Correia Regitano. Embrapa Pecuária Sudeste, Caixa Postal 339, 13560-970 São Carlos, SP, Brazil. E-mail: [email protected].
The bovineGHgene has a genetic variant character-ized by the substitution of one amino acid (leucine) for an-other (valine) at position 127, that can be identified byAluI restriction digestion of polymerase chain reaction products (PCR-RFLP) (Lucyet al., 1991).
TheIGF-1gene is extremely conserved among spe-cies and few polymorphisms are described. The presence of a microsatellite at the promoter region of this gene in bo-vine, human and horse allows to analyze genetic variations related to this locus (Kirkpatrick, 1992; Caetano and Bowling, 1998; Vaessenet al., 2001).
Evidence of selection effects on allele frequencies at these two loci was found in the traditional lineage of Canchim (Regitanoet al., 1999). The objective of the pres-ent study was to evaluate the influence of theGHandIGF-1
genotypes on growth traits in Canchim cattle.
Material and Methods
Animals
Blood or semen samples were collected from 688 Canchim animals born between 1998 and 2000. Among these, 329 belonged to the traditional Canchim population that started to be selected in 1953 and was kept closed ever since it reached a reasonable number of individuals, in 1979. The genetic composition of this group is 62.5% Charolais + 37.5% Zebu, and in the present work it was named genetic group 1 (GG1). This sample was composed of 187 males and 142 females. The remaining animals, re-ferred to as genetic group 2 (GG2), belonged to a new Canchim population, obtained by recent crosses between Charolais, Nelore and Canchim intended to introduce new variability to the breed. The Canchim animals of this group are approximately 65.7% Charolais + 34.3% Zebu. Of the 359 animals in this group, 183 were males and 176 were fe-males. All animals were born at Embrapa Pecuária Sudeste and raised on pastures, with mineral supplementation.
DNA extraction and genotyping
DNA was extracted from leukocytes or semen using a standard salting-out procedure, as described in Regitano (2001). PCR conditions were: 200 ng of genomic DNA in a 25µL reaction containing 50 mM KCl, 1.5 mM MgCl2,
10 mM Tris-HCl pH 8.4, 0.2µM of each dNTP, 0.5 units of Taq DNA polymerase, and 0.4 µM of each primer. Thermocycling conditions included an initial denaturation cycle at 94 °C for 2 min, followed by 30 cycles of denaturationat 94 °C for 1 min, primer annealing at 58 °C for 30 s for the two loci, and primer extension at 72 °C for 1 min. Then, the amplified product was subjected to a final extension cycle at 72 °C for 4 min.
The primers forGHwere those described in Schleeet al. (1994).GHalleles L and V were determined byAluI di-gestion of PCR products, according to Lucyet al. (1991).
The primers for theIGF-1 microsatellite were those de-scribed in Bishop et al. (1994). The amplified products were separated by electrophoresis in 8% non-denaturing polyacrylamide gels for 4 h and 30 min at 45 W, and sil-ver-stained for visualization. Allele sizes were estimated by comparison to a 10 bp ladder molecular weight marker.
Statistical analysis
Allele frequencies were calculated for the whole pop-ulation and within each genetic group, using the method de-scribed by Weir (1996). For comparison of proportions in the two genetic groups a chi-square test was used (Snedecor and Cochran, 1967).
Phenotypic data regarding birth weight (BW), wean-ing weight (WW) and yearlwean-ing weight (YW) were provided by the Canchim Breeding Program of Embrapa Pecuária Sudeste. The average weaning age was 210 days. Expected breeding values for BW, WW and YW were estimated in an animal model by the Best Linear Unbiased Method (BLUP) using Restricted Maximum Likelihood (REML), consider-ing animal, sex, year and month of birth, and the age of the dam (in the model).
Genotype effects on expected breeding values for BW, WW and YW were investigated by the least square method using the GLM procedure (SAS, 1999). The statis-tical model included the effects of genetic group (GG),GH
and IGF-1 genotypes, and the interactions GG*GH and
GG*IGF-1. Homozygotes with low frequencies (≤0.01) were not considered in this analysis.
Average allele substitution effects forIGF-1were es-timated by regression analysis as deviations from the 229 bp allele, as described in Stearet al. (1989), according to the model:
Yij=µ+GGi+g1mij+g2nij+g3oij+eij
whereYij= individual breeding value for the trait;µ= the population mean;GGi= the fixed effect of theithgenetic group;mij,nij,oij= the scores for the proportion of each
IGF-1allele in the genotype;g1 tog3 = the corresponding partial regression coefficients, which are the gene substitu-tion effects as deviasubstitu-tions from the 229 bp allele; and
eij = the random residual effect. In this analysis, all genotypic classes were considered, even the rare homozy-gotes for alleles 231 and 225 bp.
For those traits in which a significantGG*IGF-1 in-teraction was found in the least square analysis, the model was modified by nesting the allele substitution effect within
GG.
Results
Allele frequencies
Two alleles for theGHlocus, leucine (L) and valine (V), and fourIGF-1 microsatellite alleles were observed.
Allele sizes for the microsatellite ranged from 225 bp to 231 bp.Allele frequencies for both loci are shown in Table 1. ForGH, the L allele was the most frequent in both ge-netic groups, but its frequency was significantly higher in
GG1(p < 0.01). Differences between the two groups were also found regarding the 229 bp (p < 0.01), 227 bp and 225 bp (p < 0.05)IGF-1alleles.
Genotype effects on expected breeding values
The genetic group had significant effects (p < 0.01) on WW and YW (Table 2). The expected breeding value means for WW and YW were higher inGG2than inGG1
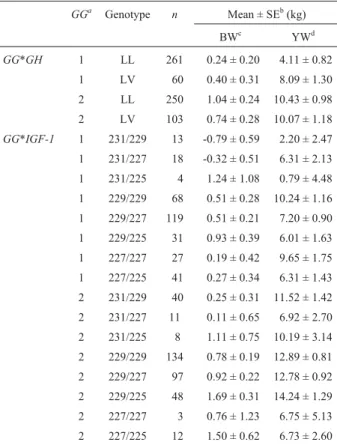
(Table 3). TheGHgenotype influenced the expected breed-ing value for YW, but theGG*GHinteraction was also sig-nificant. This interaction can be clearly seen in Table 4, where the YW mean associated to the LV genotype is al-most twice the estimated mean of the LL genotype inGG1, whereas forGG2the difference between these two geno-types is 3.6% favoring the latter, and not significant. For WW, theGG*GHeffects were significant, but no effect of
GHalone was observed (Table 2).
IGF-1had significant effects on BW and YW (Table 2). The 229/225 genotype was associated with increased BW (Table 3), while for YW the 229/229 genotype had the highest mean value. Regarding YW, the interaction between genetic group andIGF-1(GG*IGF-1) showed a significant effect. Genotype 229/225 was the most
favor-able for this trait inGG2, while inGG1the most favorable genotype was the homozygote for the 229 bp allele (Table 4).
SinceIGF-1 had no significant effects on WW, gression analysis was done only for BW and YW. The re-sults of this analysis are shown in Table 5. Genetic group had significant effects on BW and YW. This difference re-garding the significance ofGGfor BW when compared by the ANOVA test shown in Table 2 may be the result of an increased number of individuals in the regression analysis, once the rare homozygotes were considered, since there was an approximation of significance in the first analysis (p < 0.07).
Average substitution effects were estimated regard-ing the 229 bp allele (Figure 1). For BW, substitution of this allele by the 231 bp allele was significant (p < 0.01) and
Table 1- Allele frequencies forGHandIGF-1, standard error and results ofχ2test for comparison of proportions.
Alleles WPa GG1b GG2c p
GH L 0.87 ± 0.009 0.90 ± 0.012 0.85 ± 0.013 0.001
V 0.13 ± 0.009 0.10 ± 0.012 0.15 ± 0.013 0.001
IGF-1 231 bp 0.08 ± 0.007 0.06 ± 0.009 0.09 ± 0.010 0.091
229 bp 0.55 ± 0.013 0.44 ± 0.020 0.64 ± 0.017 0.000
227 bp 0.26 ± 0.012 0.37 ± 0.019 0.18 ± 0.014 0.045
225 bp 0.11 ± 0.008 0.13 ± 0.014 0.09 ± 0.010 0.045
a
WP = whole population;bGG1= genetic group 1;cGG2= genetic group 2; p = probability associated to theχ2test for proportions.
Table 2 - ANOVA test summary for BW, WW and YW expected breeding values.
Mean square
Source DFa BWb WWc YWd
GGe 1 15.31 722.51** 809.08**
GH 1 0.64 66.75 378.15*
IGF-1 7 12.44** 91.22 260.90**
GG*GH 1 6.26 342.54** 543.49**
GG*IGF-1 7 1.85 84.13 165.11*
Error 658 4.54 52.43 78.80
a
DF = degrees of freedom;bBW = birth weight;cWW = weaning weight; d
YY = yearling weight;eGG= genetic group; *p < 0.05; **p < 0.01.
Table 3- Least square means of direct effects on expected breeding values of BW, WW and YW, according to the main effects (genetic group and genotype forGHandIGF-1).
GGa Genotype n Mean ± SEb(kg)
BWc WWd YWe
1 321 0.32 ± 0.21A 4.45 ± 0.72A 6.10 ± 0.88A
2 353 0.89 ± 0.23A 8.38 ± 0.778B10.25 ± 0.95B
GH
LL 511 0.65 ± 0.16A 6.04 ± 0.52A 7.27 ± 0.64A
LV 163 0.57 ± 0.21A 6.79 ± 0.72A 9.08 ± 0.88B
IGF-1
231/229 53 -0.27 ± 0.34A 6.34 ± 1.16A 6.86 ± 1.43ABC
231/227 29 -0.10 ± 0.41A 5.56 ± 1.40A 6.61 ± 1.72AC
231/225 12 1.18 ± 0.66AB 5.61 ± 2.23A 5.49 ± 2.74ABC
229/229 202 0.65 ± 0.17AB 8.25 ± 0.58A 11.56 ± 0.7B
229/227 216 0.71 ± 0.15AB 6.83 ± 0.53A 10.04 ± 0.64ABC
229/225 79 1.31 ± 0.25B 8.13 ± 0.85A 10.12 ± 1.04A
227/227 30 0.48 ± 0.65AB 5.65 ± 2.21A 8.20 ± 2.71ABC
227/225 53 0.89 ± 0.36AB 4.94 ± 1.21A 6.52 ± 1.48AC
aGenetic group; bStandard error; cBirth weight; dWeaning weight; eYearling weight. Means followed by the same letter within columns for
negative, while substitution by the 225 bp allele was signif-icant (p < 0.05) and positive.
For YW, only the substitution of the 229 bp allele by the 231 bp allele had a significant and negative effect in both genetic groups (p < 0.01). For this trait, the substitu-tion of the 229 bp allele by the 225 bp allele had different effects in the two genetic groups, as predicted by the signif-icant interaction between genetic group and IGF-1. In
GG1, this substitution had a significant (p < 0.05) and nega-tive effect, while in GG2 no significant effect was ob-served. In the latter group, the substitution of the 229 bp allele by the 227 bp allele approached significance (p < 0.07) and was also negative (Figure 2). Considering these results, the 229 bp allele appeared to be the most fa-vorable one for YW in both genetic groups.
Discussion
The higher expected breeding value means found for
GG2were expected, since GG1was obtained by crosses between Charolais and Bos indicus breeds in the early 1950s, and the first crosses for the obtention ofGG2were started only in 1984. Thus, the Charolais stock used in the crosses for obtainingGG2was at least 30 years of selection apart from the original one. Moreover, the only Zebu breed
that contributed to the formation ofGG2was Nelore, which has one of the highest beef performances among Brazilian Zebu cattle.
The superiority of the LV growth hormone genotype compared to LL with regard to YW is in agreement with earlier suggestions of selection favoring the V allele over
Pereiraet al. 233
Table 4- Least square means of interaction effects on expected breeding values of BW, WW and YW, according to genetic group X genotype.
GGa Genotype n Mean ± SEb(kg)
BWc YWd
GG*GH 1 LL 261 0.24 ± 0.20 4.11 ± 0.82
1 LV 60 0.40 ± 0.31 8.09 ± 1.30
2 LL 250 1.04 ± 0.24 10.43 ± 0.98
2 LV 103 0.74 ± 0.28 10.07 ± 1.18
GG*IGF-1 1 231/229 13 -0.79 ± 0.59 2.20 ± 2.47
1 231/227 18 -0.32 ± 0.51 6.31 ± 2.13
1 231/225 4 1.24 ± 1.08 0.79 ± 4.48
1 229/229 68 0.51 ± 0.28 10.24 ± 1.16
1 229/227 119 0.51 ± 0.21 7.20 ± 0.90
1 229/225 31 0.93 ± 0.39 6.01 ± 1.63
1 227/227 27 0.19 ± 0.42 9.65 ± 1.75
1 227/225 41 0.27 ± 0.34 6.31 ± 1.43
2 231/229 40 0.25 ± 0.31 11.52 ± 1.42
2 231/227 11 0.11 ± 0.65 6.92 ± 2.70
2 231/225 8 1.11 ± 0.75 10.19 ± 3.14
2 229/229 134 0.78 ± 0.19 12.89 ± 0.81
2 229/227 97 0.92 ± 0.22 12.78 ± 0.92
2 229/225 48 1.69 ± 0.31 14.24 ± 1.29
2 227/227 3 0.76 ± 1.23 6.75 ± 5.13
2 227/225 12 1.50 ± 0.62 6.73 ± 2.60
aGenetic group;bStandard error;cBirth weight;dYearling weight.
Table 5- ANOVA test and average substitution effects ofIGF-1alleles on expected breeding values for BW and YW.
Source DFa MSb F value Pr > F
BWc
GG 1 59.99 13.36 0.00**
G1e 1 34.35 7.65 0.01**
G2f 1 1.32 0.29 0.59
G3g 1 22.97 5.12 0.02*
Error 677 4.49
YWh
GG 1 2196.28 27.48 0.00**
g1e(GG) 2 569.95 7.13 0.00**
g2f(GG) 2 140.11 1.75 0.17
g3g(GG) 2 182.04 2.28 0.10
Error 677 79.96
aDegrees of freedom;bMean square;cBirth weight;dGenetic group;e
Sub-stitution effect of the 231 bp allele relative to the 229 bp allele;f Substitu-tion effect of the 227 bp allele relative to the 229 bp allele;gSubstitution effect of the 225 bp allele relative to the 229 bp allele;hYearling weight; *p < 0.05; **p < 0.01.
Figure 1- Average substitution effects ofIGF-1alleles on expected breeding values for BW.
generations of the traditional Canchim population (Regitanoet al., 1999). Tambascoet al. (2003) observed a positive association between genotype LV and daily body weight gain (BWG) from weaning to yearling inBos taurus
XBos indicuscrosses. It is also in agreement with the re-sults observed in a Simmental population, where the LV ge-notype was associated with a higher BWG than LL and VV (Schlee et al., 1994). Unfortunately, the number of VV homozygotes in the present study was too small and could not to be included in the statistical analysis. The present data show that the effect ofGHon YW was greater in the traditional Canchim population (GG1) than in the new one (GG2), which reinforces the need for testing the effects of candidate genes in the population prior to their application in marker-assisted selection. It may also indicate that the ef-fect on YW attributed to this candidate gene reflects a seg-regating QTL or even a linked polymorphism in this gene rather than a direct effect of aGH AluI polymorphism. Bo-vineGHhas been mapped to position 65.7 cM on chromo-some 19 (Ihara et al., 2004). The hypothesis of a segregating QTL close to the bovineGHis not supported by the results reported in the literature, since the QTLs for growth or meat production traits where mapped to intervals that do not includebGH, as discussed in Casaset al. (2003). The hypothesis that the effects ofGHobserved in the pres-ent study might result from a differpres-ent polymorphism in this gene appears to be more acceptable, since other polymorphisms of this gene have been associated to growth traits in cattle (Tayloret al., 1998).
IGF-1had different effects on each trait studied, with positive substitution effects associated with the 225 bp al-lele on BW and with the 229 bp alal-lele on YW. Using the same animals as in the present study in a chromosome scan approach, Machadoet al. (2003) found evidence indicating the presence of a QTL controlling birth weight and another QTL influencing breeding value for yearling weight in the
IGF-1 chromosome region. The most likely positions of those QTLs were at 82.8 cM and 72.9 cM, respectively. Since the confidence interval for the position of the QTL in-cluded theIGF-1locus, located at 73 cM in the map used by the authors, the hypothesis that the QTL could be attributed toIGF-1could not be discarded. The 225 bp allele has been reported to be positively correlated to WW in Nelore cattle (Condeet al., 2000). In Hereford cattle, the substitution of a B allele (128 bp) by an A allele (130 bp) ofIGF-1had sig-nificant positive effects on direct and maternal EPDs for birth weight and 180-days gain from birth to weaning (Moodyet al., 1996). In the same study, direct EPDs for gain from weaning to yearling were shown to be negatively affected by the same allele. Since in that study different primers were used, it was not possible to establish a rela-tionship between the alleles described by those authors and the ones found in the present study.
The fact that the 225 bp allele increased BW, had no effect on WW and had a negative effect on YW indicates that the genetic correlation between birth weight and postnatal growth should not be attributed to the action of this locus. Selection against this allele has potential to in-crease the adult weight mean without increasing the inci-dence of dystocia.
The hypothesis of a QTL linkage effect rather than a direct effect ofIGF-1remains to be cleared. An influence of microsatellites within the promoter region of genes on gene regulation has been reported (Vaessenet al., 2001). Prolactin expression and growth of salt-challenged tilapia are associated with the presence of a microsatellite in the promoter region of that gene (Streelman and Kocher, 2002). Microsatellites in promoter regions are also associ-ated with the development of cancer (Denget al., 2002; Sakataet al., 2002; Stefanssonet al., 2002), with gene ex-pression in bacteria (Liuet al., 2002) and with germination control in plants (Carrariet al., 2001). On the other hand, there are several reports of evidence that QTLs in this re-gion of BTA 5 affect rib bone and dressing percentage in Brahman X Hereford sire progenies (Stoneet al., 1999). QTLs for fat depth, retail product yield, and USDA yield grade, were reported between 62 and 72 cM, interval that includes the IGF-1 locus, which is positioned at 74 cM (Iharaet al., 2004). QTLs for birth weight were described in crosses betweenBos taurusXBos indicusat approximately 90 cM of BTA 5 (Daviset al., 1998). Investigating growth and beef carcass fatness traits in an Angus x Brahman crossbreed, Kimet al. (2003) found a QTL in chromosome 5 for BW (48 cM) and YW (50cM). However, the results from SNP analysis of theIGF-1gene in Beefbooster lines M1 and M3 did not confirmIGF-1as the locus controlling these growth traits (Liet al., 2004).
The two candidate genes studied here revealed signif-icant effects on weight at different ages in Canchim cattle. From the breeding standpoint, the effect ofGHon the tradi-tional Canchim population and of the 229 bp allele of the
IGF-1locus seem to be the most favorable ones, since both result in an increase of YW without jeopardizing calving ease due to increase in birth weight.
The differences in genotype effects between popula-tions may suggest the effect of linked QTLs rather than of a direct effect in both loci.
Acknowledgements
This work was supported by grants from the Brazilian agencies FAPESP (2001/10036-5) and Embrapa (06.2002.711-03), and from CNPQ in the form of a scholar-ship to Andréa P. Pereira.
References
Bishop MD, Kappes SM, Keele JW, Stone RT, Sunden SLF, Hawkins GA, Solinas Toldo S, Fries R, Grosz MD, Yoo J and Beattie CW (1994) A genetic linkage map for cattle. Ge-netics 136:619-639.
Boyd RD and Bauman DE (1989) Mechanisms of action for so-matotropin in growth. In: Campion DR, Hausman GJ and Martin RJ (eds) Animal Growth Regulation. Plenum Pub-lishing Coorporation, New York, pp 257-293.
Breier BH (1999) Regulation of protein and energy metabolism by the somatotropic axis. Domest Anim Endocrinol 17:209-218.
Bryne PF and McMullen MD (1996) Defining genes for agricul-tural traits: QTL analyses and the candidate gene approach. Probe 7:24-27.
Caetano AR and Bowling AT (1998) Characterization of a microsatellite in the promoter region of theIGF-1gene in domestic horses and other equids. Genome 41:70-73. Carrari F, Frankel N, Lijavetzky D, Benech-Arnold R, Sanchez R
and Iusem ND (2001) The TATA-less promoter of VP1, a plant gene controlling seed germination. DNA Seq 12:107-114.
Casas E, Shackelford SD, Keele JW, Koohmaraie M, Smith TPL and Stone RT (2003) Detection of quantitative trait loci for growth and carcass composition in cattle. J Anim Sci 81:2976-2983.
Conde SB, Guimarães SEF, Euclydes RF, Silva LOC and Eucli-des Filho K (2000) Marcadores moleculares associados com crescimento em bovinos. Rev Bras Reprod Anim 25:485-486.
Davis SK, Hetzel DJS, Corbet NJ, Scacheri S, Lowden S, Renaud J, Mayne C, Stevenson R, Moore SS and Byrne K (1998) The mapping of quantitative trait loci for birth weight in a tropical beef herd. Proceedings 6thWorld Congress on
Ge-netics Applied to Livestock Production, Armidale, Australia Papers 26:441-444.
Deng G, Peng E, Gum J, Terdiman J, Sleisenger M and Kim YS (2002) Methylation of hMLH1 promoter correlates with the gene silencing with a region-specific manner in colorectal cancer. Br J Cancer 86:574-579.
Hossner KL, McCusker RH and Dodson MV (1997) Insulin-like growth factors and their binding proteins in domestic ani-mals. Anim Sci 64:1-15.
Ihara N, Takasuga A, Mizoshita K, Takeda H, Sugimoto M, Mizoguchi Y, Hirano T, Itoh T, Watanabe T, Reed KM, Snelling WM, Kappes SM, Beattie CW, Bennett GL and Sugimoto Y (2004) A comprehensive genetic map of the cattle genome based on 3802 microsatellites. 2004. Genome Res 14:1987-1998.
Kim JJ, Farnir F, Savell J and Taylor JF (2003) Detection of quan-titative trait loci for growth and beef carcass fatness traits in a cross betweenBos taurus(Angus) andBos indicus (Brah-man) cattle. J Anim Sci 81:1933-1942.
Kirkpatrick BW (1992) Identification of a conserved micro-satellite site in the porcine and bovine insulin-like growth factor-I gene 5’ flank. Anim Genet 23:543-548.
Li C, Basarab J, Snelling WM, Benkel B, Murdoch B, Hansen C and Moore SS (2004) Assessment of positional candidate genes myf5 and igf1 for growth on bovine chromosome five in commercial lines ofBos taurus. J Anim Sci 82:1-7. Liu L, Panangala VS and Dybvig K (2002) Trinucleotide GAA
re-peats dictate pMGA gene expression in Mycoplasma
gallisepticumby affecting spacing between flanking region. J Bacteriol 184:1335-1339.
Lucy MC, Hanser SD, Eppard PJ, Krivi GG and Collier RJ (1991) Genetic polymorphism within the bovine somatotropin (bST) gene detected by polymerase chain reaction and endonuclease digestion. J Dairy Sci 74:284.
Machado MBB, Alencar MM, Pereira AP, Oliveira HO, Casas E, Coutinho LL and Regitano LCA (2003) QTL affecting body weight in a candidate region of cattle chromosome 5. Genet Mol Biol 26:259-265.
Moody DE, Pomp D, Newman S and MacNeil MD (1996) Char-acterization of DNA polymorphisms in three populations of Hereford cattle and their associations with growth and ma-ternal EPD in line 1 Herefords. J Anim Sci 74:1784-1793. Regitano LCA, Azevedo JL, Vencovsky R, Packer IU, Barbosa
PF, Rosa AJM, Silva NA, Etchegaray MAL and Coutinho LL (1999) Selection for breed-specific growth hormone and
IGF-1 alleles in a synthetic beef cattle cross, Canchim. Genet Mol Biol 22:531-537.
Regitano LCA (2001) Extração de DNA para aplicação em reação de cadeia da polimerase. In: Regitano LCA and Coutinho LL (eds) Biologia Molecular Aplicada à Produção Animal. Em-brapa Informação Tecnológica, Brasília, pp 179-186. Rothschild MF, Messer LA and Vincent A (1997) Molecular
ap-proaches to improved pig fertility. J Reprod Fertil 52:227-236.
Sakata K, Tamura G, Endoh Y, Ohmura K, Ogata S and Motoya-ma T (2002) Hypermethylation of the hMLH1 gene pro-moter in solitary and multiple gastric cancers with microsatellite instability. Br J Cancer 86:564-567. SAS Institute Inc (1999) SAS/STAT User’s Guide: SAS Institute
Inc., Cary, NC, pp 549-640.
Schlee P, Graml R, Schallemberger E, Schams D, Rottmann O, Olbrich-Bludau A and Pirchner F (1994) Growth hormone and insulin-like growth factor-I concentrations in bulls of various growth hormone genotypes. Theor Appl Genet 88:497-500.
Sellier P (2000) Genetically caused retarded growth in animals. Domest Anim Endocrinol 19:105-119.
Snedecor GW and Cochran WG (1967) Statistical Methods.The Iowa State University Press, Ames, 593 pp.
Stear MJ, Pokorny TS, Muggli NE and Stone RT (1989) The rela-tionships of birth weight, preweaning gain and postweaning gain with the bovine major histocompatibility system. J Anim Sci 67:641-649.
Stefansson I, Akslen LA, MacDonald N, Ryan A, Das S, Jacobs IJ and Salvesen HB (2002) Loss of hMSH 2 and hMSH6 is fre-quent in sporadic endometrial carcinomas with micro-satellite instability: A population-based study. Clin Cancer Res 8:138-143.
Stone RT, Keele JW, Shackelford SD, Kappes SM and Koohmaraie M (1999) A primary screen of the bovine ge-nome for quantitative trait loci affecting carcass and growth traits. J Anim Sci 77:1379-1384.
Streelman JT and Kocher TD (2002) Microsatellite variation as-sociated with prolactin expression and growth of salt-challenged tilapia. Physiol Genomics 9:1-4.
Tambasco DD, Paz CCP, Tambasco-Studart M, Pereira AP, Alen-car MM, Freitas AR, Coutinho LL, Packer IU and Regitano LCA (2003) Candidate genes for growth traits in beef cattle
crosses Bos taurus X Bos indicus. J Anim Breed Genet 120:51-54.
Taylor JF, Coutinho LL, Herring KL, Gallagher Jr DS, Brenneman RA, Burney N, Sanders JO, Turner JW, Smith SB, Miller RK, Savell JW and Davis SK (1998) Candidate gene analysis ofGH1for effects on growth and carcass com-position of cattle. Anim Genet 29:194-201.
Tuggle CK and Trenkle A (1996) Control of growth hormone syn-thesis. Domest Anim Endocrinol 13:1-33.
Vaessen N, Heutink P, Janssen JA, Witteman JCM, Testers L, Hofman A, Lamberts SWJ, Oostra BA, Pols HAP and van
Duijn CM (2001) A Polymorphism in the gene for IGF-I. Di-abetes 50:637-642.
Weir BS (1996) Genetic data analysis: Methods for discrete popu-lation genetic data. 2nd edition. Sinauer Associates, Sunderland, 445 pp.
Yao J, Aggrey SE, Zadworny D, Hayes JF and Kühnlein U (1996) Sequence variations in the bovine growth hormone gene characterized by Single-Strand Conformation Polymor-phism (SSCP) analyses and their association with milk pro-duction traits in Holstein. Genetics 144:1809-1816.