Climate Change and Spatiotemporal
Distributions of Vector-Borne Diseases in
Nepal
–
A Systematic Synthesis of Literature
Meghnath Dhimal
1,2,3,4*
, Bodo Ahrens
2,3, Ulrich Kuch
41Nepal Health Research Council (NHRC), Ministry of Health and Population Complex, Kathmandu, Nepal, 2Biodiversity and Climate Research Centre (BiK-F), Senckenberg Gesellschaft für Naturforschung, Frankfurt am Main, Germany,3Institute for Atmospheric and Environmental Sciences (IAU), Goethe University, Frankfurt am Main, Germany,4Institute of Occupational Medicine, Social Medicine and Environmental Medicine, Goethe University, Frankfurt am Main, Germany
*meghdhimal@gmail.com
Abstract
Background
Despite its largely mountainous terrain for which this Himalayan country is a popular tourist
destination, Nepal is now endemic for five major vector-borne diseases (VBDs), namely
malaria, lymphatic filariasis, Japanese encephalitis, visceral leishmaniasis and dengue
fever. There is increasing evidence about the impacts of climate change on VBDs especially
in tropical highlands and temperate regions. Our aim is to explore whether the observed
spatiotemporal distributions of VBDs in Nepal can be related to climate change.
Methodology
A systematic literature search was performed and summarized information on climate
change and the spatiotemporal distribution of VBDs in Nepal from the published literature
until December2014 following providing items for systematic review and meta-analysis
(PRISMA) guidelines.
Principal Findings
We found 12 studies that analysed the trend of climatic data and are relevant for the study
of VBDs, 38 studies that dealt with the spatial and temporal distribution of disease vectors
and disease transmission. Among 38 studies, only eight studies assessed the association
of VBDs with climatic variables. Our review highlights a pronounced warming in the
moun-tains and an expansion of autochthonous cases of VBDs to non-endemic areas including
mountain regions (i.e., at least 2,000 m above sea level). Furthermore, significant
relation-ships between climatic variables and VBDs and their vectors are found in short-term
studies.
OPEN ACCESS
Citation:Dhimal M, Ahrens B, Kuch U (2015) Climate Change and Spatiotemporal Distributions of Vector-Borne Diseases in Nepal–A Systematic Synthesis of Literature. PLoS ONE 10(6): e0129869. doi:10.1371/journal.pone.0129869
Editor:Matthew Baylis, University of Liverpool, UNITED KINGDOM
Published:June 18, 2015
Copyright:© 2015 Dhimal et al. This is an open access article distributed under the terms of the
Creative Commons Attribution License, which permits unrestricted use, distribution, and reproduction in any medium, provided the original author and source are credited.
Data Availability Statement:All relevant data are within the paper.
Funding:The authors have no support or funding to report.
Taking into account the weak health care systems and difficult geographic terrain of Nepal,
increasing trade and movements of people, a lack of vector control interventions, observed
relationships between climatic variables and VBDs and their vectors and the establishment
of relevant disease vectors already at least 2,000 m above sea level, we conclude that
cli-mate change can intensify the risk of VBD epidemics in the mountain regions of Nepal if
other non-climatic drivers of VBDs remain constant.
Introduction
According to the latest report of the Intergovernmental Panel on Climate Change (IPCC), the
average warming of the global mean surface temperature was 0.85°C [0.65
–
1.06°C] over the
period of 1880 to 2012 [
1
]. Importantly, different trends of surface temperature warming at the
regional scale and the highest increase has been recorded over the last three decades in
moun-tains and mid-high latitudes of the northern hemisphere[
1
]. For example, the rate of warming
in the Himalayas has been reported to have been much greater (0.06°C/year) than the global
average in the last three decades indicating that the Himalayas are more sensitive and
vulnera-ble to global climate change than other areas of the earth [
2
]. Climate change affects human
health mainly by three pathways: (1) direct impacts by increasing the frequency of extreme
events such as heat, drought and heavy rainfall, (2) effects mediated through natural systems
such as disease vectors, water-borne diseases and air pollution, and (3) effects that are heavily
mediated by human systems such as occupational impacts, under-nutrition, and psycho-social
problems [
3
,
4
]. As the published literature continues to focus on the effects of climate change
in developed countries, the effects on the most-vulnerable populations residing in least
devel-oped and developing countries are underreported [
3
]. These poor or developing countries are
historically least responsible for greenhouse gas (GHG) emissions but most vulnerable to
cli-mate change impacts, and are also currently suffering the heaviest disease burden indicating an
“
ethical crisis
”
[
5
]. Several challenges for conducting climate change and health research in
developing mountainous countries have been reported. These include a lack of trained human
resources, financial resources, long-term data and information, and suitable methods that are
applicable to the local context [
6
]. Furthermore, the largest health risks will occur in
popula-tions that are most affected by climate sensitive diseases such as vector-borne diseases (VBDs)
and in those left behind by the economic growth [
4
].
many studies have predicted direct effects of climate change on malaria
[
14
,
15
,
18
,
19
,
20
,
21
,
22
,
23
], dengue [
24
,
25
,
26
] and leishmaniasis [
27
]. In spite of these
observa-tions and projecobserva-tions, there are reservaobserva-tions about the possibility to model the future
transmis-sion of VBDs under climate change scenarios, and several authors have pointed out the need
for understanding the epidemiology of VBDs using alternative hypotheses that are not climate
driven [
28
,
29
,
30
,
31
,
32
,
33
,
34
,
35
,
36
,
37
,
38
,
39
].
Although no single factor can fully explain the transmission of VBDs, climate change can
alter the geographical distribution of disease vectors and VBDs [
3
], for example, by rendering
previously endemic areas unsuitable and previously non-endemic areas suitable for their
exis-tence and reproduction [
40
,
41
,
42
]. As higher latitudes and altitudes are more sensitive to
cli-mate change and experiencing higher warming rates [
2
,
43
,
44
], a shift of species distributions
towards higher elevations has been predicted [
45
]. Several recent studies have shown an
increasing trend of the epidemic potential and length of the transmission season of VBDs in
temperate regions and tropical highlands under different climate change scenarios
[
14
,
18
,
19
,
24
]. Moreover, the IPCC concludes that local changes in temperature and rainfall
will continue to alter the distribution of disease vectors and the risk of VBDs [
4
], and that the
population mostly affected by climate-sensitive diseases and is deprived of participation in
eco-nomic growth will face the largest health risk [
4
,
46
]. However, heterogeneity in VBD
transmis-sion is observed at every spatial scale ranging from less than a kilometre to continents. This
heterogeneity is determined, for example, by the ecology and biogeography of the vectors, soil
types, urbanization, local adaptation to temperature, and host communities [
47
,
48
]. Therefore,
evidence generated at the global level may not be applicable at a local scale, and understanding
the spatiotemporal distribution of VBDs in an individual country is important.
Nepal is one of the most vulnerable countries with respect to climate change because it is
positioned in the southern rim of the so-called
“
Third Pole
”
of our planet (the
Himalaya-Hindu Kush mountain range and the Tibetan Plateau). It has a complex topography and a low
level of development [
49
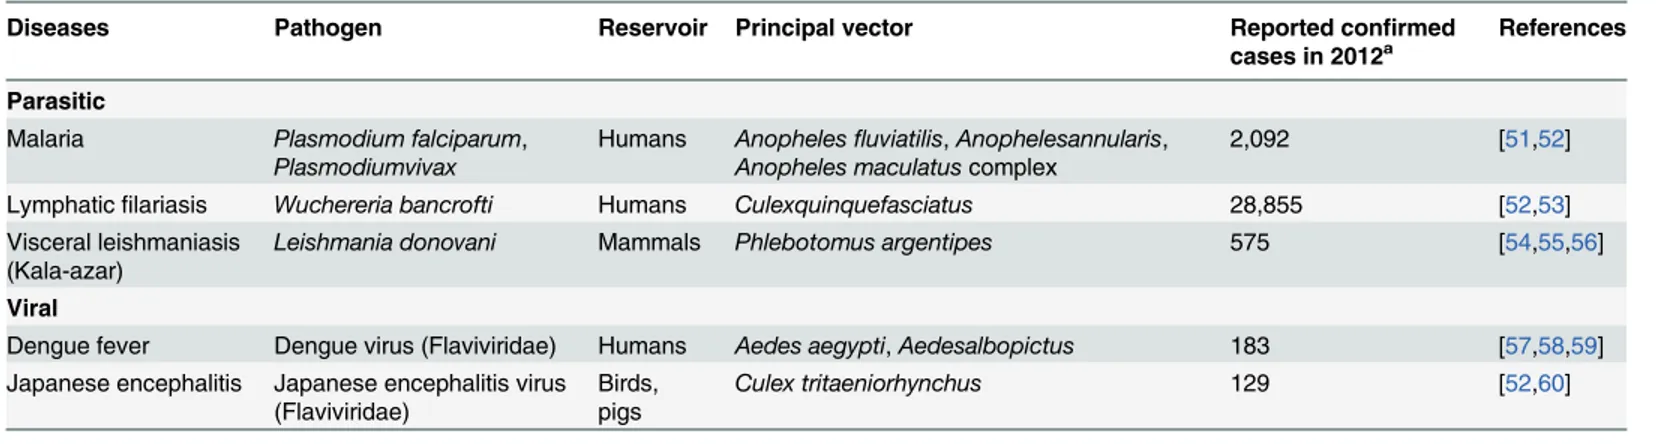
]. Despite its largely mountainous terrain, Nepal is afflicted with five
VBDs, namely malaria, lymphatic filariasis (LF), Japanese encephalitis (JE), visceral
leishmani-asis (VL) (also known as kala-azar) and dengue fever (DF)[
50
]. Most of the major VBDs
included in this study may be considered as neglected tropical diseases (NTDs). Their
charac-teristics in Nepal are provided in
Table 1
.
The Nepal National Adaptation Programme of Action (NAPA) to climate change has
iden-tified VBDs as one of the highest priority adaptation projects forthe health sector in Nepal
Table 1. Characteristics of vector-borne diseases in Nepal.
Diseases Pathogen Reservoir Principal vector Reported confirmed
cases in 2012a
References
Parasitic
Malaria Plasmodium falciparum,
Plasmodiumvivax
Humans Anophelesfluviatilis,Anophelesannularis, Anopheles maculatuscomplex
2,092 [51,52]
Lymphaticfilariasis Wuchereria bancrofti Humans Culexquinquefasciatus 28,855 [52,53]
Visceral leishmaniasis (Kala-azar)
Leishmania donovani Mammals Phlebotomus argentipes 575 [54,55,56]
Viral
Dengue fever Dengue virus (Flaviviridae) Humans Aedes aegypti,Aedesalbopictus 183 [57,58,59] Japanese encephalitis Japanese encephalitis virus
(Flaviviridae)
Birds, pigs
Culex tritaeniorhynchus 129 [52,60]
aReported cases to the Epidemiology and Disease Control Division [50].
bers of autochthonous cases of VBDs reported from non-endemic hilly and mountain regions
motivated us to conduct this review. By reviewing the published literature we wished to explore
whether these observed spatiotemporal distributions of VBDs can be attributed to climate
change. Thus, this article aimed to review the available literature on VBDs and climate change
to allow for an assessment of the likely impacts of climate change on the changing
spatiotem-poral distribution of VBDs in Nepal.
Methods
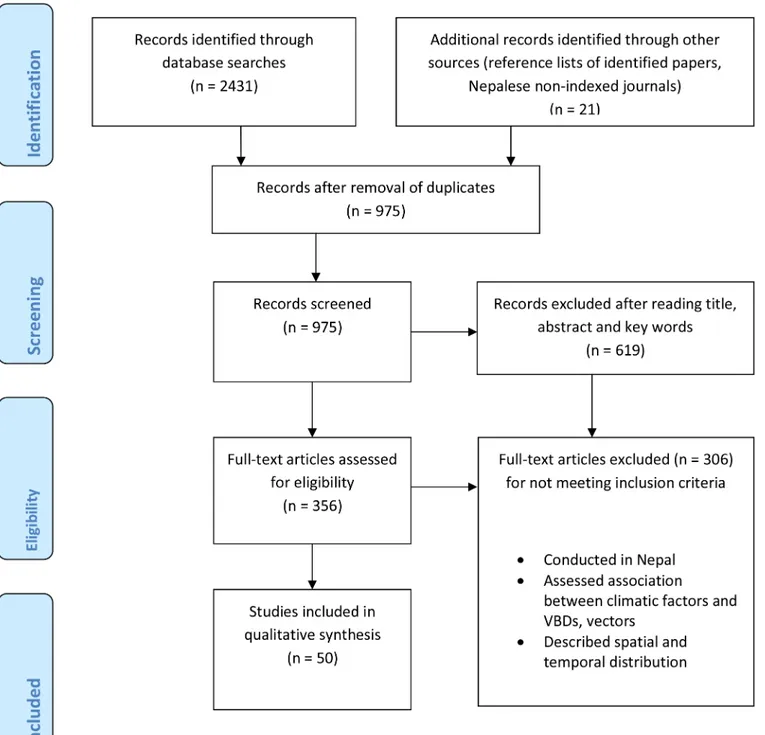
A systematic literature search was performed and summarized information on climate change
and the spatiotemporal distribution of VBDs in Nepal following providing items for systematic
review and meta-analysis(PRISMA) guidelines. We searched for peer-reviewed articles
pub-lished in English language before December2014 in the PubMed and Web of Science databases.
Besides, we searched for relevant journal articles in Google Scholar and retrieved government
reports from their web sites. We used the following search terms in title, abstract and keywords:
1. Nepal and
2. Climate, climate change, temperature, rainfall, precipitation, relative humidity, weather,
Aedes
,
Anopheles
,
Culex
,
Phlebotomus
, dengue, malaria, kala-azar, Japanese encephalitis,
visceral leishmaniasis, lymphatic filariasis, mosquito-borne diseases, VBDs.
We first screened
“
titles
”
,
“
abstracts
”
and
“
keywords
”
for relevant articles and then read full
text articles to evaluate them according to our inclusion criteria. Furthermore, the reference
lists of each selected research article were then evaluated using the snowball sampling
tech-nique if they had been missed in the electronic databases. Inclusion criteria for selecting studies
are listed below:
Inclusion criteria
1. Studies must include climatic variables (Rainfall, temperature and humidity) that analyse
the trend of climatic data and are relevant for the study of VBDs
2. Epidemiological studies dealing with the spatial and temporal distribution of disease vectors
and disease transmission and/or epidemiological studies assessing the association of VBDs
with climatic variables
3. Only studies published before December2014 and with a study area in Nepal
The selected papers were systematically reviewed and thematically analysed. Conference
pro-ceedings, viewpoint articles, review articles, project reports and theses were excluded. Given
the low number of studies meeting the inclusion criteria and their mostly descriptive nature, a
quantitative meta-analysis was not appropriate. Therefore, we alternatively summarized the
state of the art on climate change and the spatiotemporal distribution of VBDs in Nepal. The
spatio-temporal distributions of VBDs from the published literature was projected onto a map
of Nepal using GIS software.
Results
Literature search
We found 12 studies that analysed the trend of climatic data and are relevant for the study
of VBDs, 38 studies that dealt with the spatial and temporal distribution of disease vectors and
disease transmission. Among 38 studies, only eight studies associate climatic factors with
VBDs in Nepal. Among these eight studies, one dealt with malaria and VL, one with dengue
and LF, three dealt with malaria and one each with JE, LF and VL.
Fig 1. PRISM flow diagram of the literature search.
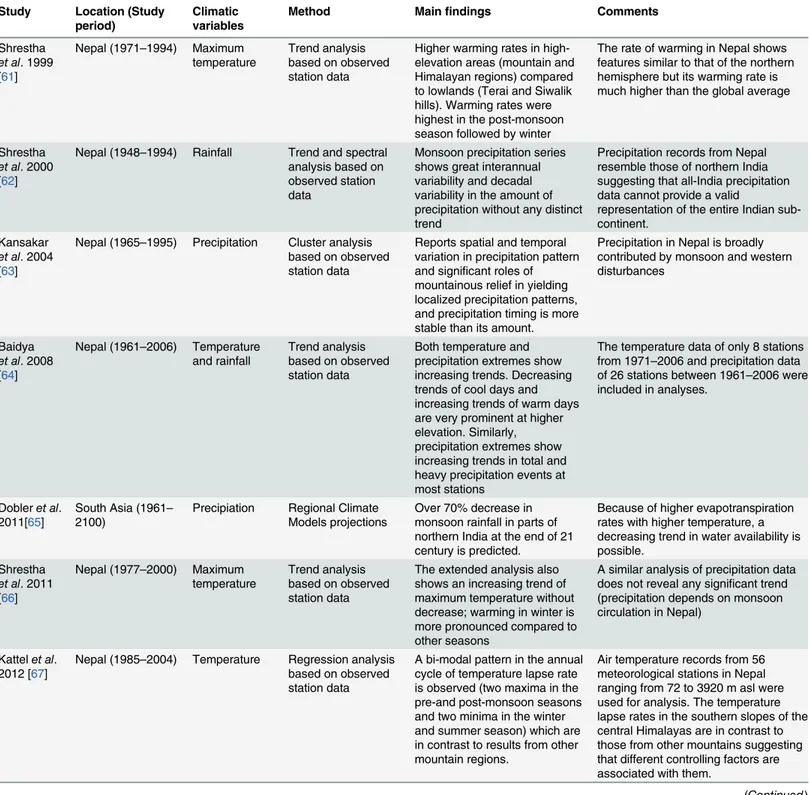
A summary of the main findings from the analysis of climatic variables is provided in
Table 3
. Similarly, a summary of the main findings of studies on the spatiotemporal
distribu-tion of VBDs and their associadistribu-tion with climatic variables is presented in
Table 4
. The trend of
confirmed cases of major VBDs except LF reported annually to the Epidemiology and Disease
Control Division (EDCD) of Nepal
’
s Ministry of Health and Population is presented in
Fig 2
.
This
Fig 2
shows declining trend of VBDs except dengue in Nepal especially in endemic areas
where diseases control programmes are intensified by the Government of Nepal with support
of external development partners. Despite these declining trends due to human interventions,
VBDs are expanded in new areas which were previously considered non-endemic.
Observed climate change in Nepal
Although analyses of observed temperature and precipitation data are still limited in Nepal,
cli-mate change effects are already occuring. Temperature data show a warming trend in Nepal.
This warming trend is influenced by maximum temperatures with higher warming rates in the
mountain regions compared to the lowlands of Nepal [
61
,
66
,
71
]. A recent study using the data
of 13 mountain stations of Nepal (1980
–
2009) reported that only the maximum and mean
tem-peratures are in an increasing trend without any changing trend of minimum temtem-peratures
[
69
]. In contrast, another study conducted in the Mustang district of Nepal
’
s mountain region
using data between 1987
–
2009 shows an increasing trend of both minimum and maximum
temperatures [
72
]. A general warming trend of all types of temperatures (minimum, maximum
and mean) is observed in Nepal with a higher warming rate in mountain and hill regions
com-pared to lowland (Terai) regions when the data of eight stations between 1971
–
2006 are
ana-lysed [
64
]. The annual cycle of temperature lapse rate shows a bi-modal pattern with two
maxima in the pre- and post-monsoon seasons as well as two minima in winter and summer.
This is completely different from other mountain regions suggesting different contributing
fac-tors in individual seasons[
67
]. Hence, the trend of temperatures, especially of minimum
tem-peratures, depends on the location of meteorological stations because of large micro-climatic
[
67
]. Precipitation does not show a distinct trend in Nepal. The analysis of precipitation data
from 78 stations all across Nepal (1948
–
1994) and sub-regional records (1959
–
1994) reveal
great interannual and decadal variability in precipitation but do not show a long-term trend
[
62
]. The analysis of data from 26 stations (1961
–
2006) shows an increasing trend of extreme
precipitation events in total and heavy precipitation at most stations [
64
]. A strong relationship
between rainfall and elevation in the pre-monsoon and post-monsoon is observed along the
Topics Full-texts retrieved Included in qualitative synthesisa
Climate change 65 12
Malaria 98 8
Lymphaticfilariasis 8 7
Visceral leishmaniasis (Kala-azar) 110 8
Dengue fever 27 9
Japanese encephalitis 45 11
Climatic factors and VBDs 8 8
aSome studies dealt with more than one diseases and their vector. Hence, the total number of
final studies included in the qualiatitive synthesis was 50 (Tables3and4).
Table 3. Summary of findings on analyses of climatic variables.
Study Location (Study
period)
Climatic variables
Method Mainfindings Comments
Shrestha et al. 1999 [61]
Nepal (1971–1994) Maximum temperature
Trend analysis based on observed station data
Higher warming rates in high-elevation areas (mountain and Himalayan regions) compared to lowlands (Terai and Siwalik hills). Warming rates were highest in the post-monsoon season followed by winter
The rate of warming in Nepal shows features similar to that of the northern hemisphere but its warming rate is much higher than the global average
Shrestha et al. 2000 [62]
Nepal (1948–1994) Rainfall Trend and spectral analysis based on observed station data
Monsoon precipitation series shows great interannual variability and decadal variability in the amount of precipitation without any distinct trend
Precipitation records from Nepal resemble those of northern India suggesting that all-India precipitation data cannot provide a valid
representation of the entire Indian sub-continent.
Kansakar et al. 2004 [63]
Nepal (1965–1995) Precipitation Cluster analysis based on observed station data
Reports spatial and temporal variation in precipitation pattern and significant roles of mountainous relief in yielding localized precipitation patterns, and precipitation timing is more stable than its amount.
Precipitation in Nepal is broadly contributed by monsoon and western disturbances
Baidya et al. 2008 [64]
Nepal (1961–2006) Temperature and rainfall
Trend analysis based on observed station data
Both temperature and precipitation extremes show increasing trends. Decreasing trends of cool days and increasing trends of warm days are very prominent at higher elevation. Similarly, precipitation extremes show increasing trends in total and heavy precipitation events at most stations
The temperature data of only 8 stations from 1971–2006 and precipitation data of 26 stations between 1961–2006 were included in analyses.
Dobleret al. 2011[65]
South Asia (1961– 2100)
Precipiation Regional Climate Models projections
Over 70% decrease in monsoon rainfall in parts of northern India at the end of 21 century is predicted.
Because of higher evapotranspiration rates with higher temperature, a decreasing trend in water availability is possible.
Shrestha et al. 2011 [66]
Nepal (1977–2000) Maximum temperature
Trend analysis based on observed station data
The extended analysis also shows an increasing trend of maximum temperature without decrease; warming in winter is more pronounced compared to other seasons
A similar analysis of precipitation data does not reveal any significant trend (precipitation depends on monsoon circulation in Nepal)
Kattelet al. 2012 [67]
Nepal (1985–2004) Temperature Regression analysis based on observed station data
A bi-modal pattern in the annual cycle of temperature lapse rate is observed (two maxima in the pre-and post-monsoon seasons and two minima in the winter and summer season) which are in contrast to results from other mountain regions.
Air temperature records from 56 meteorological stations in Nepal ranging from 72 to 3920 m asl were used for analysis. The temperature lapse rates in the southern slopes of the central Himalayas are in contrast to those from other mountains suggesting that different controlling factors are associated with them.
Study Location (Study period)
Climatic variables
Method Mainfindings Comments
Shrestha et al. 2012 [68]
Central Himalayas (1998–2008)
Rainfall Spatiotemporal variation analysis based on satellite data
A strong positive relationship between elevation and rainfall during the pre-monsoon season and two significant rainfall peaks during the summer monsoon season were found over the southern slope of the Himalayas; the primary peak along the Sub-Himalayas (~500–700 m asl) and the second peak along the Lesser Himalayas (~2,000–2,200 m asl)
Only data from the pre-monsoon and summer monsoon seasons were included in analyses; the highest altitude considered was 5,000 m asl.
Kattelet al. 2013 [69]
Nepal (1980–2009) Temperature Trend analysis based on observed station data
A statistically significant average warming trend with a prominent rise of maximum temperatures is found while minimum temperature trends show greater variability among stations
Only 13 mountain stations ranging from 1304–2566 m asl were included for analysis
Kulkarni et al. 2013 [70]
Hindu-Kush Himalayan (HKH) Region (1961– 2098) Temperature and rainfall Regional Climate Models projections
The model projections indicate significant warming throughout the HKH region towards the end of the 21st century. For 2011– 2040, temperature is projected to increase by 0.5–1°C; for 2040–2070, by 1–3°C and for 2071–2098, by 4–5°C. In contrast, precipitation projections indicate a declining trend of monsoon precipitation especially in the Central Himalayas between 2011–2070 compared to the baseline period 1961–1990
The high resolution regional simulations were generated using the regional climate model PRECIS and were validated using observedAPHRODITE precipitation data and NCEP/NCAR temperature data.
Qiet al. 2013 [71]
Mt. Qomalangma (Everest) Region in Nepal (1971–2009)
Temperature and precipitation
Trend analysis based on observed station data
A significant increase in annual mean temperature (0.025°C/ year) highly influenced by maximum temperature was found. Similarly, annual precipitation shows an increasing trend (4.77 mm/year) with concentration of
precipitation mainly in the monsoon period.
In contrast, the northern slope temperature rise is highly influenced by minimum temperature and precipitation is many times lower compared to the southern slope indicating a barrier effect of the Himalayas.
Aryalet al. 2014 [72].
Mustang, Nepal (1987–2009) Temperature and precipitation Regression analysis based on observed station data
Maximum and minimum temperature have increased over the years with a significant average increase of the mean annual temperature (0.13°C/ year). Similarly, precipitation has increased significantly (0.541 mm/year).
The significant snow melt perceived by local people might be due to combined effects of higher temperature and increased rainfall.
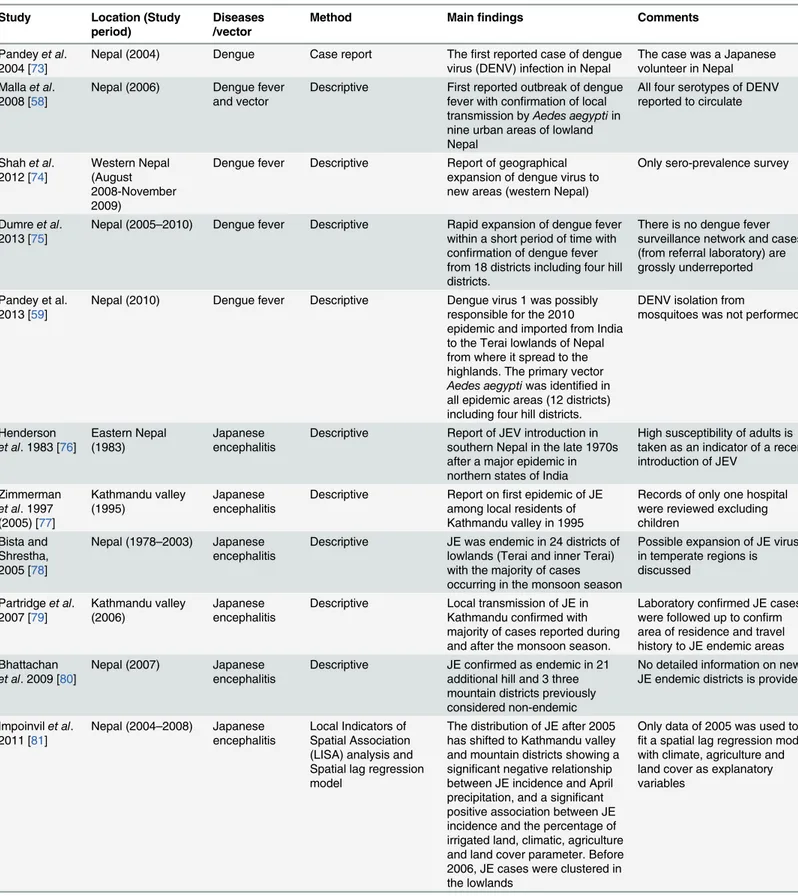
Table 4. Characteristics of studies on the spatiotemporal distribution of vector-borne diseases and their association with climatic variables.
Study Location (Study
period)
Diseases /vector
Method Mainfindings Comments
Pandeyet al. 2004 [73]
Nepal (2004) Dengue Case report Thefirst reported case of dengue virus (DENV) infection in Nepal
The case was a Japanese volunteer in Nepal Mallaet al.
2008 [58]
Nepal (2006) Dengue fever and vector
Descriptive First reported outbreak of dengue fever with confirmation of local transmission byAedes aegyptiin nine urban areas of lowland Nepal
All four serotypes of DENV reported to circulate
Shahet al. 2012 [74]
Western Nepal (August 2008-November 2009)
Dengue fever Descriptive Report of geographical expansion of dengue virus to new areas (western Nepal)
Only sero-prevalence survey
Dumreet al. 2013 [75]
Nepal (2005–2010) Dengue fever Descriptive Rapid expansion of dengue fever within a short period of time with confirmation of dengue fever from 18 districts including four hill districts.
There is no dengue fever surveillance network and cases (from referral laboratory) are grossly underreported
Pandey et al. 2013 [59]
Nepal (2010) Dengue fever Descriptive Dengue virus 1 was possibly responsible for the 2010 epidemic and imported from India to the Terai lowlands of Nepal from where it spread to the highlands. The primary vector Aedes aegyptiwas identified in all epidemic areas (12 districts) including four hill districts.
DENV isolation from
mosquitoes was not performed
Henderson et al. 1983 [76]
Eastern Nepal (1983)
Japanese encephalitis
Descriptive Report of JEV introduction in southern Nepal in the late 1970s after a major epidemic in northern states of India
High susceptibility of adults is taken as an indicator of a recent introduction of JEV
Zimmerman et al. 1997 (2005) [77]
Kathmandu valley (1995)
Japanese encephalitis
Descriptive Report onfirst epidemic of JE among local residents of Kathmandu valley in 1995
Records of only one hospital were reviewed excluding children
Bista and Shrestha, 2005 [78]
Nepal (1978–2003) Japanese encephalitis
Descriptive JE was endemic in 24 districts of lowlands (Terai and inner Terai) with the majority of cases occurring in the monsoon season
Possible expansion of JE virus in temperate regions is discussed
Partridgeet al. 2007 [79]
Kathmandu valley (2006)
Japanese encephalitis
Descriptive Local transmission of JE in Kathmandu confirmed with majority of cases reported during and after the monsoon season.
Laboratory confirmed JE cases were followed up to confirm area of residence and travel history to JE endemic areas Bhattachan
et al. 2009 [80]
Nepal (2007) Japanese encephalitis
Descriptive JE confirmed as endemic in 21 additional hill and 3 three mountain districts previously considered non-endemic
No detailed information on new JE endemic districts is provided
Impoinvilet al. 2011 [81]
Nepal (2004–2008) Japanese encephalitis
Local Indicators of Spatial Association (LISA) analysis and Spatial lag regression model
The distribution of JE after 2005 has shifted to Kathmandu valley and mountain districts showing a significant negative relationship between JE incidence and April precipitation, and a significant positive association between JE incidence and the percentage of irrigated land, climatic, agriculture and land cover parameter. Before 2006, JE cases were clustered in the lowlands
Only data of 2005 was used to fit a spatial lag regression model with climate, agriculture and land cover as explanatory variables
Study Location (Study period)
Diseases /vector
Method Mainfindings Comments
Thakuret al. 2012 [82]
Four mountain districts of Nepal (July-August 2010)
Japanese encephalitis
Generalized linear mixed modelling
Report of JE virus infections among pig populations in high-altitude mountain districts with decreasing risk of seropositivity with increasing elevation
Impact of climate change on the circulation of JE virus in mountain districts is discussed
Robertson et al. 2013 [83]
Nepal (2007–2011) Japanese encephalitis
Geographically weighted regression
Cases were positively associated with a high degree of landscape mixing and small-scale agriculture
A recent trend towards establishment of Japanese encephalitis in the Kathmandu valley and mountain districts was confirmed in this analysis Jung 1973 [53] Kathmandu (1972) Lymphatic
filariasis and vector
Descriptive Culex quinquefasicatus, the principal vector ofWuchereria bancroftiin Nepal, was recorded within the endemic zone of LF.
Study area was limited to Central Nepal
Scherchand et al. 2003 [84]
Nepal (2001) Lymphatic filariasis
Descriptive Epidemiological mapping of lymphaticfilariasis showed that 33 out of 37 districts were endemic including densely populated districts of Kathmandu valley (~1,400 m asl)
The highest altitude sampled was 1,400 m asl
Adhikariet al. 2008 [85]
Four districts of Nepal (Feb-July 2007)
Lymphatic filariasis
Descriptive The highest microfilaria infection rate and aysmptomatic cases were recorded in mountain districts compared to lowland and hill districts.
Entomological data were not collected
Pradhanet al. 1970 [51]
Mugu district (Gum Valley) (1969)
Malaria and vector
Descriptive Local malaria transmission along with malaria vectors were recorded above 1,800 m in Nepal. The malaria vector Anopheles maculatuswas recorded up to 3,100 m asl.
Malaria transmission was seasonal
Sakya 1981 [86]
Nepal (1978–1980) Malaria Descriptive Malaria cases were reported from 38 districts out of a total of 75 districts, including the Terai lowlands and hill districts mostly below 1,200 m asl.
Cases were detected under active malaria surveillance and follow-up of all confirmed cases was performed
Dahal 2008 [87].
Nepal (1978–2006) Malaria and Visceral leishmaniasis
Descriptive Malaria incidence has declined remarkably over the years but the number of districts where malaria is prevalent increased to 67. A positive relationship between rainfall and malaria cases with a certain time lag (1–2 months) is reported. Similarly, positive relationship between annual mean temperature and rainfall with Visceral leishmaniasis cases is reported
Only a few years monthly data were used to show an association of rainfall and malaria outbreaks. Only few years monthly data of Visceral leishmaniasis was used.
Bhandariet al. 2013 [88].
Jhapa district (1998–2009)
Malaria ARIMA Time series analysis
Significant positive correlations between the climatic variables temperature (minimum and maximum), rainfall and malaria cases were found. However, in time series analysis, climatic variables were not significant predictors of malaria incidence
Non-climatic variables were not included in time series analysis and climatic variables were not significant predictors
Table 4. (Continued)
Study Location (Study
period)
Diseases /vector
Method Mainfindings Comments
Dhimalet al. 2014 [89]
Nepal (2004–2012) Malaria Generalized linear models
Despite normal seasonality of rainfall and temperature during the study period, the incidence of annual confirmed malaria cases declined significantly in historical lowland high and moderate-risk districts. This coincided with the free distribution of long-lasting insecticidal nets (LLINs) suggesting that effective vector control interventions can outweigh the role of climate. However, the risk of malaria epidemics in highlands is predicted to increase due to climate change.
Malaria, non-malaria (Total outpatients visits per year, childhood diarrheal diseases and acute respiratory infection) and climatic data were analysed.
Dhimalet al. 2014 [23]
Kailali and Jhapa districts of Nepal (2004–2012)
Malaria Generalized additive mixed models
Strong relationship between monthly temperature and malaria incidence is reported. A 1°C increase in minimum and mean temperatures increased malaria incidence by 27% and 25%, respectively. Malaria hotspots persisted mostly in the same villages of Kailali district, whereas in Morang district malaria hotspots shifted to new villages after the introduction of LLINs.
A combined model with both climatic and non-climatic predictors was not developed and net effect of vector-control interventions and climatic factors is not known.
Kakchapati and Ardkaew, 2011[90]
Nepal (1998–2009) Malaria Negative binomial regression modelling
A decreasing trend in the incidence of malaria (1998– 2004), followed by a more moderate upward trend until 2008 is found. Zero malaria incidences occurred in six districts for over twelve years and higher incidences were reported among districts bordering India except Kavre district.
Only yearly malaria incidence was used without categorizing indigenous and imported cases, or malaria infections by parasite species
Peters and Dewar 1956 [91]
Central Nepal (1954–1955)
Vector Descriptive Secondary vector of dengue
(Aedesalbopictusand principal vector of lymphaticfilariasis (Culex quinquefasciatus) recorded to range from lowland to hill regions
Highest altitude district studied was Kathmandu
Joshiet al. 1965 [60]
Nepal (1956–1965) Vector Descriptive Principal vector of JE,Culex tritaeniorhynchus,first recorded in 1963 with distribution from lowlands to Kathmandu (around 1,350 m asl)
The highest altitude surveyed was 1400 m asl; survey confined to eastern and central Nepal only
Darsie and Pradhan 1990 [52]
Nepal (1950–1989) Vector Descriptive The principal vectors of lymphatic filariasis (Culex
quinquefasciatus), of Japanese encephalitis (Culex
tritaeniorhynchus)and the secondary vector of dengue virus (Aedes albopictus) were documented up to Kathmandu valley (1,350 m asl) in Nepal
The principal vector of dengue virus (Aedes aegypti)was not recorded in any survey
Study Location (Study period)
Diseases /vector
Method Mainfindings Comments
Darsieet al. 1994 [92]
Mustang district (1993)
Vector Descriptive Breeding ofAnopheles mosquitoes was recorded up to 3,738 m.
TheseAnophelesmosquitoes were not malaria vector
Gautamet al. 2009 [57]
Kathmandu (April-June 2009)
Vector Entomological survey First report of the dengue virus vectorAedesaegyptiin Kathmandu
Only larvae were recorded (in June)
Byanjuet al. 2013 [93].
Bhakatapur, Nepal (April-September 2011)
Vector Descriptive Lymphaticfilariasis vectors (Culex quinquefasciatus) reported above 2,000 m from Nagarkot with indoor higher than outdoor densities
No significant effects of month and climatic variables reported (but sampling only in warm months and method of data analysis is not explained in detail)
Dhimalet al. 2014 [94]
Nepal (September 2011-February 2012)
Vectors Generalized linear models
Significant effects of climatic factors (temperature, relative humidity, precipitation) on the abundance ofAedes aegyptiand Culex quinquefasciatusare reported
Culex quinquefasciatusis reported up to 2100 m asl and Aedes aegyptiup to 1310 m in Kathmandu valley.
Dhimal et al.2014 [95]
Eastern Nepal (2012–2013)
Vectors Longitudinal Entomological survey
The known malaria vectors in Nepal,Anophelesfluviatilis, Anopheles annularisand Anopheles maculatescomplex members were recorded from 70 to 1,820 m asl. Similarly, the vectors of chikungunya and dengue virus,Aedes aegyptiand Aedes albopictus, the vector of lymphaticfilariasis,Culex quinquefasciatus, and that of Japanese encephalitis,Culex tritaeniorhynchus, were found from 70 to 2,000 m asl in eastern Nepal. Furthermore, larvae of Anopheles,CulexandAedes species were recorded up to 2,310 m asl.
The maximum altitude covered in the survey was 2,500 m asl and relationship with climatic factors was not determined in this study.
Joshiet al. 2006 [96]
Khotang district 2006
Visceral leishmaniasis
Case study Autochthonous Visceral leishmaniasis case (10 yearl-old girl) from a Visceral leishmaniasis non-endemic district of eastern Nepal.
Referral case for diagnosis; the patient had no travel history to India or Visceral leishmaniasis endemic areas within Nepal.
Joshiet al. 2006 [54]
Nepal (1980–2003) Visceral leishmaniasis
Descriptive Increasing trend of Visceral leishmaniasis reported with majority of cases occurring during the rainy season and fewest during the winter.
Cased were confined to districts bordering the Indian state of Bihar
Pandeyet al. 2011 [97]
Doti district 2011 Visceral leishmaniasis
Case study Thefirst autochthonous case of Visceral leishmaniasis(13-year-old male) from a VL non-endemic hilly district of western Nepal.
Referral case for diagnosis; the patient had no travel history to India or Visceral leishmaniasis endemic areas within Nepal. Punet al.
2011[98].
Nepal (April 1999-March 2009)
Visceral leishmaniasis
Descriptive Increasing trend and geographic distribution of visceral
leishmaniasis at a referral hospital from a non-endemic district
No classification of cases into autochthonous and imported ones
Table 4. (Continued)
Study Location (Study
period)
Diseases /vector
Method Mainfindings Comments
Scharzet al. 2011[99]
Achham district, Nepal (2011)
Visceral leishmaniasis
Case study An autochthonous Visceral leishmaniasis case (17year-old woman) is reported from a Visceral leishmaniasis non-endemic hilly district of western Nepal.
Referral case for diagnosis; the patient had no travel history to India or Visceral leishmaniasis endemic areas within Nepal.
Punet al. 2013[100]
Nepal (September 2010-October 2011)
Visceral leishmaniasis
Descriptive Report of a series of locally transmitted autochthonous Visceral leishmaniasis cases from areas previously considered non-endemic, mostly in hill and mountain regions
Only referral cases in a tertiary care hospital in Kathmandu were included; the actual incidence of Visceral leishmaniasis in non-endemic areas can be expected to be many times higher
Uranwet al. 2013 [56]
Dharan, Sunsari district (2000–2008)
Visceral leishmaniasis
Outbreak investigation including case-control study
Report of urban transmission of Visceral leishmaniasis in Dharan city with a strongly clustered distribution
High chances of recall bias especially among control group; climatic variables not
considered in analysis.
doi:10.1371/journal.pone.0129869.t004
Fig 2. Trend of confirmed cases of vector-borne diseases in Nepal.Panels A, B, C and D show, respectively, the trend of confirmed malaria, dengue fever, visceral leishmaniasis and Japanese encephalitis cases reported to the Epidemiology and Disease Control Division, Department of Health Services, Ministry of Health and Population, Government of Nepal.
during the monsoon season whereas relatively large amounts of rainfall occur over higher
ele-vations during the pre-monsoon season [
68
]. Spatial and temporal variation in precipitation
pattern and significant roles of mountainous relief in yielding localized precipitation patterns
is reported in Nepal [
63
].
However, changes in the extreme events, consistent with climate change effects, are more
significnat in Nepal. A declining trend of cool days and inclining trend of warm days are
observed in the higher altitudes of Nepal [
64
]. The combined effects of increased temperature
and diminished snowfall followed by rapid shrinking of the majority of glaciers have already
resulted in a reduction of water available for drinking and farming in the mountain regions of
Nepal [
66
,
72
,
101
]. The precipitation extremes show an increasing trend in total and heavy
pre-cipitation albeit no systematic difference is observed in extreme prepre-cipitation trends beween
the highlands and lowlands [
64
].
The Hadley Centre's high-resolution regional climate model PRECIS (Providing Regional
Climates for Impact Studies) projects significant warming towards the end of the 21
stcentury
and a decrease in monsoon precipitation over the Central Himalayan region (which includes
Nepal) during the period 2011
–
2040 and an increase in seasonal rainfall during the period
2071
–
2098 compared to the baseline period (1961
–
1990) [
70
]. In contrast, other studies with
regional climate models such as COSMO-CLM project over 70% decrease in monsoon rainfall
in parts of northern India at the end of this century [
65
] and because of higher
evapotranspira-tion rates with higher temperature, a decreasing amount in water availability has also been
reported. The fifth assessment report of IPCC conclude that different climate models have
varying degree of success in simulating past mean state andclimate variability compared to
observed sations data and large uncertainities in climate change projecttions are reported as
estimated in multi-model ensembles (especailly for precipitation) [
1
]
Spatiotemporal distributions of vector-borne diseases in Nepal
conducted in the high-endemic malaria district of Jhapa [
88
]. However, non-climatic variables
were not included in the analysis in that study, and the climatic variables assessed were not
sig-nificant predictors of malaria incidence in time series analysis. Another recent study shows
that a1°C increase in minimum and mean temperatures increased malaria incidence by 27%
and 25%, respectively. The reduction in malaria incidence was 25% per one unit increase of
LLINs [
23
]. The spatiotemporal distribution of malaria in Nepal (1978
–
2012) is presented in
Fig 3
[
50
,
86
,
90
,
103
].
Dengue.
The first reported case of dengue virus (DENV) infection in Nepal was a Japanese
volunteer in 2004 [
73
], and the first local transmission of DENV in Nepal was confirmed at the
beginning of an outbreak in 2006 (August-November) in lowland urban areas of 11 districts
[
58
,
104
]. During this outbreak, the first record of the primary vectors of DENV,
Aedesaegypti
mosquitoes, and the presence of all four serotypes of the virus (DENV1-4) were reported [
58
].
Previously, no
Ae
.
aegypti
had been reported in Nepal, but the secondary vector of DENV,
Ae
.
albopictus
was known to have existed in the lowlands and hill regions including Kathmandu
(the capital city of the country located above 1,300 m asl) as early as the 1950s [
52
,
91
]. Since
the first DF outbreak in 2006, DENV and its vector
Ae
.
aegypti
have been rapidly expanding
across the country including the densely populated Kathmandu valley and mountain regions
of Nepal[
57
,
59
,
74
,
75
,
94
,
95
]. During an epidemic in 2010, 917 DF cases including five deaths
were reported[
50
]. During this outbreak, DF cases started to be recorded at the beginning of
August (monsoon season) in a hilly district (~360 m asl), rapidly spread in lowland Terai
Fig 3. Spatiotemporal distribution of malaria in Nepal (1978–2012).The active case detection of malaria in Nepal between 1978 and 1980 recordedautochthonous malaria cases from 38 districts of the Terai and hill regions (<1,200 m above sea level). Autochthonous malaria cases were recorded from 26 additional districts of Nepal between 1981 and 2012; these numbers also include malaria cases from mountain regions. The symbol (*) indicates that the classification of reported malaria cases, i.e., as autochthonous or imported, is not known.
m) in October with a peak in November (post-monsoon season) and diminished in
mid-December (winter season) [
59
]. The study of the 2010 epidemic also recorded
Ae
.
aegypti
in all
affected areas and provided data suggesting that DENV isolated from Nepalese patients was
phylogenetically close to Indian DENV pointing to an import of the virus from India.
Signifi-cant effects of the climatic factors temperature, rainfall and relative humidity, physiographic
region and month of collection on the abundance of adult
Ae
. a
egypti
were reported in a recent
study from central Nepal [
105
]. The spatiotemporal distribution of DF cases in Nepal in the
period 2006
–
2012 is shown in
Fig 4
[
58
,
59
,
75
,
104
].
Visceral leishmaniasis (VL).
In Nepal, VL cases were first recorded in 1980. At that time
confirmed cases were confined to lowland Terai districts of eastern and central Nepal that
border India
’
s state of Bihar, followed by records from 13 endemic districts and an increasing
trend of incidence until 2003 [
54
]. Despite a declining trend of VL incidence in Nepal after
2003, VL is now increasingly reported from districts classified as non-endemic amounting by
2009 to 47 out of the 75 districts of Nepal (albeit cases were not classified as indigenous or
imported) [
98
]. Although the disease was previously assumed to be confined to rural
house-holds with damp earthen floors and especially to poor families, autochthonous VL cases have
since 1997 also been reported among residents of the urban area of Dharan city with highly
clustered distributions [
56
]. Disease transmission in Dharan was confirmed by PCR
identifi-cation of both vector, the sand fly
Phlebotomus argentipes
, and parasite,
Leishmania
dono-vani
, inside town [
56
]. Moreover, series of autochthonous VL cases are now being reported
from new areas mostly in hill and mountain regions of Nepal which had previously been
con-sidered to be non-endemic for this disease [
96
,
97
,
99
,
100
]. A positive association of VL cases
with temperature and rainfall has been observed with reports of disease outbreaks 2
–
3
months after heavy rainfall in Nepal [
87
]. The abundance of the vector
P
.
argentipes
has also
been found to be positively correlated with the maximum temperature of the month of
collec-tion and negatively correlated with the precipitacollec-tion of previous months in both Nepal and
India [
106
]. The spatiotemporal distribution of VL cases in Nepal (1980
–
2011) is shown in
Fig 5
[
54
,
96
,
97
,
98
,
99
,
100
].
Japanese encephalitis (JE).
Infections with Japanese encephalitis virus (JEV) moved
northward in India and began to be seen in Nepal in the late 1970s [
76
] when epidemics
occurred in lowland districts bordering India in western (Rupendehi) and eastern Nepal
(Mor-ang) in 1978 [
78
]. The mosquito species
Culex tritaeniorhynchus
has been reported to be the
principal vector of JEV in many parts of Asia including Nepal [
52
,
81
]. It was first recorded in
Nepal in 1965 with a distribution ranging from the lowland to hill regions including
Kath-mandu valley [
60
]. Although most reported JE cases in Nepal were initially confined to 24
dis-tricts in the lowland Terai [
78
], JEV transmission is now established in hill and mountain
districts of Nepal, including Kathmandu valley, which were previously considered
non-endemic for this disease [
77
,
79
,
80
,
81
,
82
]. Moreover, there are reports of spatial cluster of JE
incidence with a shift from the Terai lowlands to hill and mountain regions after 2005 [
81
].
The risk of JE was also associated with paddy field configuration at the landscape level [
83
]. A
presence of mosquitoes in pig farms and their association with JE sero-positivity has been
reported from four mountain districts of Nepal [
82
]. A significantly positive association of JE
incidence with monthly temperature and the percentage of irrigated land, and a negative
asso-ciation with low precipitation has also been reported from Nepal [
81
]. The spatiotemporal
dis-tribution of JE cases in Nepal (1978
–
2012) is shown in
Fig 6
[
77
,
79
,
80
,
81
,
82
,
107
].
2001, LF was endemic in 33 out of 37 surveyed districts of Nepal. The majority of cases were
confined to an altitudinal range between 500
–
700 m asl, however, with a substantial number of
cases at altitudes between 900
–
1400 m asl[
84
]. A sentinel surveillance conducted in 2007
among 7,000 people residing in six districts of the lowland (Terai), hill and mountain regions
of Nepal reported the highest microfilaria infection rate (2.0%) in the mountain district of
Sid-hupalanchowk [
85
], suggesting a shift of LF transmission to the mountain region of Nepal
after the introduction of mass drug administration (MDA) programmes in lowland and hill
districts which had started in Parsa district in 2003. By 2013, six rounds of MDA had been
completed in 16 endemic districts and four, three, two and one round of MDA in 10 districts
each, and a gradual expansion of MDA reached 5 endemic districts covering 74% of the total
population at risk (N = 21,852,201) [
50
]. However, 61 out of 75 administrative districts have
already been reported as being LF endemic, and Nepal plans to cover the remaining six
endemic districts with MDA by 2014 and achieve
<
1% prevalence in all endemic districts by
2018 [
50
]. Previously,
Cx
.
quinquefasciatus
mosquitoes had been recorded in all endemic
dis-tricts ranging from 90 to 1,800 m asl[
102
], and recent studies report the distribution of
Cx
.
quinquefasciatus
up to at least 2,100 m (the highest sampled altitude in that study) in the
dis-tricts of Dhunche and Rasuwa which had previously been regarded as non-endemic for LF
[
94
], and above 2,000 m in Nagarkot of Bhaktapur district [
93
]. Moreover, significant effects of
the climatic factors temperature and relative humidity, physiographic region and month of
Fig 4. Spatiotemporal distribution of dengue fever cases in Nepal 2006–2012.Autochthonous dengue fever cases were recorded from ten districts ofNepal during the first outbreak in 2006. The travel history of dengue fever cases reported from Kathmandu in 2006 was not known. However local transmission of dengue virus and the presence of the primary dengue virus vectorAedes aegyptiwere confirmed from additional 10 districts of Nepal including Kathmandu between 2007 and 2012.
collection on the mean abundance of
Cx
.
quinquefasciatus
per (per trap) were found [
94
]. The
spatiotemporal distribution of LF in Nepal (2001
–
2012) is shown in
Fig 7
[
84
,
85
,
102
]
Discussion
The review of observed and future projections of climatic data show a conducive environment
for the transmission of VBDs in Nepal, especially in the highlands (mountains) which had
been assumed to be free from these diseases. Despite a decade-long armed conflict and political
instability in Nepal, there has been a substantial decline in the incidence of all major VBDs
except DF which has only emerged in Nepal since 2004. The presence of disease vectors and
reports of series of autochthonous cases of VBDs in hill and mountain regions of Nepal that
had previously been considered to be non-endemic suggests that the local transmission of
VBDs might be favoured by rising temperatures. However, the transmission of VBDs among
humans is more complex than mere temperature changes, and this fact has been extensively
reviewed [
9
,
28
,
33
,
34
,
39
,
108
,
109
,
110
,
111
]. One may also hypothesize that improvements in
die-sease surveillance and health care services, land use changes, population growth, globalization
in general, in particular international trade, tourism and travel, migration and other movement
of people, the expansion of road networks and the shipment of goods, unplanned urbanization
and improvements in livelihood and access to health care services, etc., could be responsible for
Fig 5. Spatiotemporal distribution of visceral leishmaniasis cases in Nepal (1980–2011).Before 2006, visceral leishmaniasis (VL) was endemic only in13 lowland districts of the Terai region bordering Bihar state, India. Between 2006 and 2011, autochthonous VL cases were reported from 11 additional districts mostly in the hills but including one in the mountains. Moreover, VL cases were reported from 25 additional districts but their origin (i.e., autochthonous or imported) is not known.
transmission of VBDs at altitudes above 2,000 m, which clearly stands against the conventional
logic that high altitude regions are free of VBDs because of cold temperature, strongly suggests
that global warming is playing a role in the observed transmission. Therefore, we discuss below
climate change and the spatio-temporal distribution of VBDs in Nepal in comparison with the
results of studies from other mountainous countries around the world.
A warming trend of annual mean temperatures is observed throughout the country
indicat-ing that climate change is already occurindicat-ingin Nepal. However, large spatial and temporal
varia-tion in the trends of minimum and maximum temperatures is observed across different
meteorological stations. The warming signal is clearer for maximum temperature with a more
pronounced warming in the mountains compared to the lowlands ofNepal. This is in sharp
contrast to the warming trend of the Tibetan Plateau where the minimum temperature is
increasing at a faster rate than the maximum temeprature [
112
,
113
,
114
]. but consistent with
the trend observed in the western Himalayas of India [
115
,
116
], indicating a role of the Indian
monsoon in the regulation of temperature through complicated feedback. Increasing trends of
both minimum and maximum temperatures with greater warming rates in higher elevations
have also been reported from the Rocky Mountains in Colorado, USA [
117
].
Precipitation is one of the major climatic factors affecting transmission of VBDs. The
absence of a distinct long-term trend in precipitation changes in Nepal despite increasing GHG
and strongly increasing aerosol concentrations in the region (especially through the
neighbour-ing countries India and China) might be explained by a moister but less intense monsoon
Fig 6. Spatiotemporal distribution of Japanese encephalitis cases in Nepal (1978–2012).Japanese encephalitis (JE) cases were recorded only from 24districts of the lowland Terai between 1978 and 2003 in Nepal. After the start of surveillance for acute encephalitis syndrome with the support of the World Health Organization (WHO) in May 2004, JE cases were reported from 40 additional districts including mountain regions between 2004 and 2012. Among these 40 additional districts, JE endemicity was confirmed for 27 districts including three mountain districts.
circulation [
65
]. Nepal
’
s precipitation is affected by two major air movements: the summer
monsoon which originates from the Bay of Bengal in the east, and the winter western
distur-bances which affect mostly the western parts of the country and result in snowfall in the
moun-tains. A large spatial variation in annual rainfall over Nepal, ranging from less than 150 mm to
more than 5,000 mm, is observed and is largely associated with the South Asian monsoon
[
118
]. About 80% of the annual precipitation occurs during the monsoon season
(June-Septem-ber) followed by the post-monsoon season (12.7%) [
118
]. A positive correlation has been
shown between the all-Nepal precipitation and the Southern Oscillation Index (SOI) series
sug-gesting a strong association between the El Niño Southern Oscillation (ENSO) and
precipita-tion fluctuaprecipita-tion in Nepal [
62
]. The all-Nepal precipitation records do not agree well with the
all-India precipitation record but resembles that of the northern part of India. This means that
the precipitation climatology of the Himalayan region and adjacent areas differs greatly from
the southern part of the Indian subcontinent. As a result, aggregated precipitation data from all
over India cannot provide a valid representation of the entire subcontinent [
62
]. Although the
regional climate models show an increasing trend of temperatures and no distinct trend in
pre-cipitation amount, most regional climate models report too warm temperatures in the northern
parts of India that are too high compared to the observations, and the amounts of precipitation
and its spatial distribution differ significantly between the regional climate models [
119
].
The observed declining trend of cool days and increasing trend of warm days in the higer
altitudes of Nepal [
64
] is consistent with the global trend [
43
,
44
]. However, a multi-country
Fig 7. Spatiotemporal distribution of lymphatic filariasis in Nepal (2001–2012).In 2001, lymphatic filariasis mapping using immunochromatographiccard tests in 37 districts of Nepal showed that LF was endemic in only 33 districts. Between 2002 and 2012, LF was confirmed as endemic in 60 districts of Nepal including mountain region districts.