T E C H N I C A L C O M M U N I C A T I O N
Design of a Dry Cover Pilot Test for Acid Mine Drainage
Abatement in Southern Brazil, Part II: Pilot Unit Construction
and Initial Monitoring
Anderson Borghetti Soares•Mario Valente Possa•Vicente Paulo de Souza•
Paulo Se´rgio Moreira Soares•Maria Cla´udia Barbosa•Mariluce de Oliveira Ubaldo•
Ana Vale´ria Freire Allema˜o Bertolino•Laura Simone Borma
Received: 23 February 2010 / Accepted: 9 September 2010 / Published online: 29 September 2010 Springer-Verlag 2010
Abstract Pyritic coal wastes produced by a coal
benefi-ciation plant in the state of Santa Catarina in Southern Brazil are acid generating. Here we report the second part of a study evaluating the use of a dry cover to minimize acid mine drainage generation and its release into the environment. This part encompasses the construction and initial monitoring of an experimental pilot-scale unit. Local clays and ash from a power station were used as cover materials. Monitoring started in October 2007 and will extend for at least 4 years. Initial results of the dry cover system constructed using compacted locally available clay and ash look promising. The pH of the drainage ranged from 6.0 to 7.0, within the legal limits for discharge into the environment.
Keywords Acid mine drainageCapillary barrier
Dry coverPyriteWater flow
Introduction
Coal wastes exposed to the atmosphere can have adverse environmental impacts. Rainwater that percolates through the coal waste can leach contaminants into the ground and surface waters (CETEM 2001). One of the alternatives in mitigating this environmental impact is the use of a dry cover, which can be made out of different materials (Borma et al.2002,2003; Cabral et al.2000; Heineck et al.
2003; Ubaldo2005) to minimize the water and air flux into the wastes. The use of dry covers on mining wastes has been widely reported in the literature (Adu-wusu and Yanful2006; Ayres et al.2002,2005; MEND2001; Simms and Yanful 1999; Waugh and Smith 2004; Yanful et al.
2006). The selection of a cover material is usually based on its physical–chemical and geotechnical characteristics, its availability near the area where the cover will be applied and local climate conditions. A comprehensive project for field assessment of a dry cover performance should encompass a three—step design as follows (O’Kane et al.
2002):
• Step 1: Investigation program of the available materials in the area (sampling program, field characterization, laboratory test program).
• Step 2: Design and numerical modeling of the dry cover;
• Step 3: Pilot test at the site to monitor the cover performance in field conditions.
A project to evaluate the performance of the dry cover solution for abatement of acid mine drainage (AMD) generated in coal waste piles has been developed in a mining area (Forquilhinha), in the state of Santa Catarina, in Southern Brazil, as a partnership between the Centre for Mineral Technology (CETEM), a Brazilian Ministry of
A. Borghetti Soares (&)M. V. PossaV. P. de Souza P. S. M. Soares
Center for Mineral Technology, Brazilian Ministry of Science and Technology, Rio de Janeiro, Brazil
e-mail: aborghetti@cetem.gov.br
M. C. BarbosaM. O. Ubaldo
Federal University of Rio de Janeiro—COPPE/UFRJ, Rio de Janeiro, Brazil
A. V. F. A. Bertolino
State University of Rio de Janeiro (UERJ), Rio de Janeiro, Brazil
L. S. Borma
National Institute for Space Research, S. Jose´ dos Campos, Brazil
Science and Technology Research Centre, and the Car-bonı´fera Criciuma S.A., a Brazilian coal mining company. Steps 1 and 2 have been previously reported (Borghetti Soares et al.2009). The present technical communication refers to Step 3, which is the construction of the experi-mental pilot unit; the instrumentation and monitoring procedures used and some preliminary results are pre-sented. As previously reported, we decided to use bottom ash from a local power station as a cover material, after evaluating this possibility with numerical modeling and laboratory and field tests (Borghetti Soares et al. 2009; Souza et al.2007; Ubaldo 2005). Others have previously suggested the use of bottom ash as dry cover material (Borma et al.2002,2003; Heineck et al.2003).
The Experimental Pilot Unit
The experimental pilot unit comprised: a 3 m high embankment with four experimental cells (Borghetti Soares et al.2009) where different covers were applied; a laboratory for physical chemical analysis; and a weather station. The cells were built to study the behavior of three different types of dry covers designed based on the previ-ous laboratory and field tests and numerical simulations (Borghetti Soares et al.2009). The Soilcover software was used for the numerical simulations (GeoAnalysis 2000; Wilson 1990; Wilson et al. 1994). One cell was kept uncovered as a reference. Sensors were installed in each layer to measure suction (granular matrix sensor, 253 model, Watermark, range 0–200 kPa), water content (TDR, CS616 model, Campbell Scientific, range 0–100% volu-metric water content) and temperature (T108 model, Campbell Scientific, range 5–95C). Figure1 shows a schematic view of the four cells and the location of the sensors. The four cells were:
Cell 1: waste with no cover;
Cell 2: waste, covered with a layer of mixed waste
(0.3 m thick);
Cell 3: waste covered with a three-layer configuration.
Each layer is 0.3 m thick. The first layer is mixed waste, the second layer is compacted clay, and the third is organic soil; and
Cell 4: waste covered with a five-layer configuration.
Each layer is 0.3 m thick. The first layer is mixed waste, the second is compacted ash (capillary barrier), the third is compacted clay, the fourth is compacted ash (capillary barrier), and the fifth is organic soil.
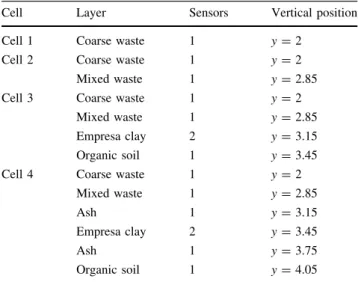
Fifteen instruments of the same type were installed, totaling 45 sensors connected to a data logger. A rain gauge was installed to record rain precipitation. Table1 shows
the amount of each type of instrument and their position in each cell. All sensors were installed vertically at the center of the cells (horizontal position, x=0). Data are down-loaded by internet connection.
The experimental pilot unit is shown in Fig.2. The pilot experiment started in October 2007 and is scheduled to run for at least 4 years. A cylindrical lysimeter was installed within the excavation so that the rainwater that percolates through the wastes could be collected at the bottom and sent to a sampling well. The software SEEP/w (Geo-slope International Ltda1998) was used to define the position of the lysimeters inside the cells so that not be disturbed the water flow in the waste (Borghetti Soares et al. 2009). Figure3 shows a cross section of the embankment with cells 3 and 4.
A weather station was installed to collect data on pre-cipitation (rain gauge), wind (speed and direction), relative humidity, atmospheric pressure, and temperature. A labo-ratory for physical–chemical analysis (pH, oxidation– reduction potential, electrical conductivity, dissolved oxygen) was built adjacent to the cells. Water samples are collected and analyzed Fe, Fe??
, Fe???
, Al, Mn, SO4
-, acidity, Cu, Zn, As, Ba, Ca, Hg, Pb, Ni, Se. The cells are actually phenomenological models of a waste-cover system and were designed so that a water balance could be per-formed, as follows:
(a) Water volume at the bottom of the cells: The drainage system for water collection was designed as two separate pipelines. The first one collects the water that flows to the bottom of the lysimeter and sends it to a 5 m deep sampling well. At the sampling well, the water volume is measured and sampled for chemical and physical–chemical analysis. The second pipeline collects the water volume that percolates out of the lysimeter and sends it to a tank.
(b) Runoff: Channels were built on the perimeter of the cells so that the runoff can be collected and directed by the pipelines to a tank. The runoff volume is periodically measured and sampled for physical– chemical analysis.
(c) Water storage: Water content sensors are being used to measure the water storage in each layer of the cover.
(d) Precipitation: Precipitation data are obtained from rain gauges.
Building of the Experimental Pilot Unit
A preliminary survey at the site chosen for construction revealed a superficial water table. An embankment was then designed and built to install the cells. Clay available on site was used to build the embankment, which was compacted by trucks. The excavations inside of the embankment were subsequently filled with coarse waste.
The sidewalls of the excavations were layered with a geosynthetic liner to prevent leakage of the percolate and consequent soil contamination. The lysimeters, polypro-pylene cylindrical tanks (2 m high and 2 m in diameter and bottom sealed) were placed at the center of the excavation. The in situ dry unit weight of the materials was adjusted to a previously determined value. The four excavations were filled with non-compact coarse waste (dry unit weight=1.35 t/m3). In cells 2, 3, and 4, mixed wastes
Datalogger
Meteorological
Well
station
Embankment
Cell 2 Cell 1
Cell 4 Channels
2 Cell 1
Cell 3
Reservoir (at the bottom of the cells) reservoir
Laboratory
reservoir (runoff)
Fig. 2 View of the pilot unit (mining area, Forquilhinha, Brazil)
SAMPLING WELL
CELL 4 CELL 3
PVC PIPELINE COLLECTION
TANK
PVC PIPELINE RUN-OFF COLLECTION
EMBAMKMENT EMBANKMENT EMBAMKMENT
ORGANIC SOIL
NATURAL SOIL
NATURAL SOIL
NATURAL SOIL
NATURAL SOIL
EMBANKMENT LYSIMETER
WASTE
WATER LEVEL ORGANIC SOIL
CLAY
WASTE
CHANNEL
LYSIMETER
PVC PIPELINE
BOTTOM ASHES “MIX WASTE” “MIX WASTE”
CLAY
Fig. 3 Cross section of the embankment with cells 3 and 4 Table 1 Number and vertical position (in m) of the temperature, suction, and water content sensors in the cells
Cell Layer Sensors Vertical position
Cell 1 Coarse waste 1 y=2
Cell 2 Coarse waste 1 y=2
Mixed waste 1 y=2.85
Cell 3 Coarse waste 1 y=2
Mixed waste 1 y=2.85
Empresa clay 2 y=3.15
Organic soil 1 y=3.45
Cell 4 Coarse waste 1 y=2
Mixed waste 1 y=2.85
Ash 1 y=3.15
Empresa clay 2 y=3.45
Ash 1 y=3.75
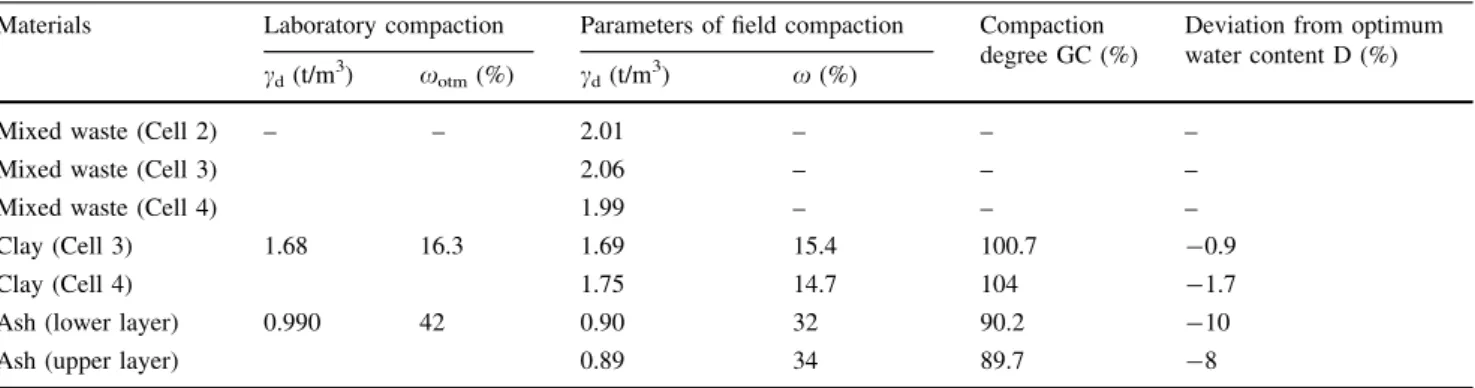
were compacted as 0.30 m layers (dry unit weight= 2.00 t/m3), with a vibratory plate. Cover materials, ash and clay, were disposed with compaction control on top of the mixed waste (cells 3 and 4), as 0.3 m thick layers. The materials were compacted with a rammer (clay) and a vibratory plate (ash). Compaction control was based on the field water content and dry unit weight (ABNT1986a) and by laboratory compaction tests (ABNT 1986b). Table2
shows the field and laboratory compaction parameters for each material used.
The ash (lower layer) was compacted at about 30% of gravimetric water content because at this percentage, the unsaturated hydraulic conductivity of the ash is smaller than that of the clay for the same suction. Furthermore, the dry unit weight of the ash does not change significantly with its water content (Ubaldo2005).
Organic soil was applied on top of the cover materials in cells 3 and 4. This non-compacted layer was used to protect and minimize erosion and evaporation from inner layers.
Monitoring Procedures
Data on suction, water content, and temperature of the layers (waste and soil), climate (precipitation, relative humidity, air temperature, atmospheric pressure, wind velocity and direction velocity), and water volumes (flow into waste and run-off) have been collected periodically at the experimental pilot unit.
The water volume that flows to the bottom of the all lysimeters is measured daily. Monthly water samples (from each lysimeter) are collected and physical–chemical data (pH, electrical conductivity, oxidation–reduction potential, and dissolved oxygen) as well dissolved metals are deter-mined. The runoff volumes of each cell are collected and measured after a rainfall event.
Data collected at each sensor installed in the layers (suction, water content, and temperature) are collected at
30 min intervals and stored in a data logger and down-loaded periodically by internet connection. Data such as temperature, relative humidity, rain precipitation, atmo-spheric pressure, and wind velocity and direction are recorded automatically from the weather station at 30 min intervals.
Initial Results
The following figures show some preliminary results for the experimental pilot unit. Figure4 shows the pH, con-ductivity, and temperature in 2008 for the four cells. We observed in cell 3, where the dry cover was constructed using a layer of compacted clay, and cell 4, where the dry cover contained layers of compacted clay and ash, that the water pH was nearly 7.0. On the other hand, the pH of the water collected from both cells 1 and 2, where no soil covers were used, was less than 3.0. These results are in agreement with conductivity and temperature data when these same pairs of cells are compared. Conductivity is an index of the flow of electrical current in a substance and was higher for water samples from cells 1 and 2 than for cells 3 and 4 (Fig.5). Likewise, in cells 1 and 2, the
Table 2 Compaction results
Materials Laboratory compaction Parameters of field compaction Compaction degree GC (%)
Deviation from optimum water content D (%) cd(t/m3) xotm(%) cd(t/m3) x(%)
Mixed waste (Cell 2) – – 2.01 – – –
Mixed waste (Cell 3) 2.06 – – –
Mixed waste (Cell 4) 1.99 – – –
Clay (Cell 3) 1.68 16.3 1.69 15.4 100.7 -0.9
Clay (Cell 4) 1.75 14.7 104 -1.7
Ash (lower layer) 0.990 42 0.90 32 90.2 -10
Ash (upper layer) 0.89 34 89.7 -8
cddry unit weight;xotmoptimum water content;xfield water content (before compaction);GCcompaction degree (cdfield/cdlaboratory)
0 1 2 3 4 5 6 7 8
Jan-08 Feb-08 Mar
-08
Apr
-08
Ma
y-08
J
un-08 Jul-08 Sep-08 Oct-08 No
v-08
Dec-08
pH
Cell 1 Cell 2 Cell 3 Cell 4
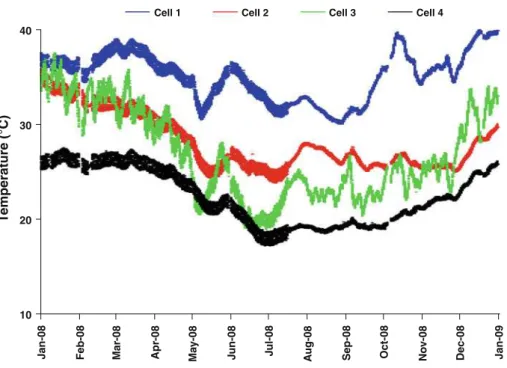
temperature of the coarse wastes was higher than in cells 3 and 4 (Fig.6). The oxidation reactions that generate AMD are exothermic and the higher temperatures indicate that such reactions are occurring. We observe that temperatures are higher in cell 1 (waste with no cover) and lower in cell 4 (cover with a capillary barrier).
Data on rainfall and on water content of the layers are necessary to quantify the annual and seasonal water bal-ance of the cells. Figure7 shows the 2009 monthly pre-cipitation, which is typical for the region. The highest precipitation occurs from September to March with peaks in January, February, and September. The lowest precipi-tation occurs from April to August with minimum values in May, June and July.
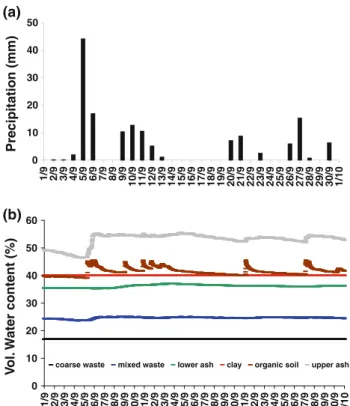
Figure8a shows rainfall in June 2008. As precipitation occurs, water content in cell 4 (Fig.8b) increases in the upper layers of the cell (ash and organic soil). This
behavior is controlled by the initial water content of the layers, by the saturated hydraulic conductivity of the materials, and by the rainfall intensity. The water content of the clay layer remained 100% saturated (clay-saturated volumetric water content is 40%) and the water content of the layers that underlie the clay layer did not change sig-nificantly during or after rainfall events. High saturation level corresponds to negligible oxygen diffusion into the waste (Cabral et al.2000; Yanful1993).
The volume of water collected at the bottom of each lysimeter is measured regularly. Figure9 shows the cumulative volume of water in each lysimeter until the first half of 2009. The cumulative volume of water in the lysimeters in cells 3 and 4 (the cells covered with com-pacted clay and comcom-pacted clay and ash) was less than that for cells 1 and 2, reflecting the performance of the com-pacted clay layers in reducing the amount of rainwater that reach the waste.
0 10 20 30 40 50 60 70
Jan-08 Feb-08 Mar
-08
Apr
-08
Ma
y-08
J
un-08 Jul-08 Sep-08 Oct-08 No
v-08
Dec-08
CE (mS/cm)
Cell 1 Cell 2 Cell 3 Cell 4
Fig. 5 Conductivity over time
10 20 30 40
Jan-08 Feb-08 Mar
-08
Apr
-08
Ma
y-08
J
un-08 Jul-08
A
ug-08
Sep-08 Oct-08 No
v-08
Dec-08 Jan-09
T
emperature (°C)
Cell 1 Cell 2 Cell 3 Cell 4
Fig. 6 Temperature on the top of the lysimeters in coarse waste
0 50 100 150 200 250 300
Jan
uar
y
Februar
y
Mar
c
h
April Ma
y
J
une Ju
ly
A
ugust
September
October
No
vember
December
Precipitation,
mm
Concluding Remarks
This paper describes the construction and initial monitoring of a pilot unit to evaluate the performance of a dry cover to mitigate AMD being generated by coal wastes. The initial results have shown that the dry cover systems with com-pacted clay as a capillary barrier and with bottom ash as an alternative cover material are effective in reducing AMD generation. Data being collected will support the interpre-tation of the water balance, water flow, and geochemistry involved in AMD generation. The experiment is subjected to weather conditions that vary annually so a conclusive
assessment on the performance of the different dry covers can only be reached after an adequate monitoring period. The pilot project is scheduled to last a minimum of 4 years. Then, the results of the experimental unit will be used to engineer a cover system that can be used to prevent AMD in southern Brazil. The experience obtained in the project will be also potentially applicable to mitigate AMD in other Brazilian mining areas.
Acknowledgments The authors thank the Brazilian Ministry of Science and Technology and Carbonı´fera Criciu´ma S.A for all the support that they have given to this experiment.
References
ABNT (1986a) Solo—Determinac¸a˜o da Massa Especı´fica Aparente in Situ com o Emprego do Frasco de Areia. NBR 7185, Rio de Janeiro, Brazil
ABNT (1986b) Solo—Ensaio de Compactac¸a˜o. NBR 7182, Rio de Janeiro, Brazil
Adu-wusu C, Yanful EK (2006) Performance of engineered test covers on acid-generating waste rock at Whistle Mine, Ontario. Can Geotech J 43:1–18
Ayres BK, O’Kane M, Christensen D, Lanteigne L (2002) Construc-tion and instrumentaConstruc-tion of waste rock test covers at Whistle Mine, Ontario, Canada. Proceedings 9th international conference on tailings and mine waste. Fort Collins, CO, pp 163–171 Ayres BK, Lanteigne L, O’Kane M (2005) Design and construction of
the backfilled pit cover system at Whistle Mine, Canada: a case study. Proceedings international conference on mining and the environment, Skelleftea
Borghetti Soares A, Ubaldo MO, Souza VP, Soares PSM, Barbosa MC, Mendonc¸a RG (2009) Design of a dry cover pilot test for acid mine drainage abatement in southern Brazil. Part 1: material characterization and numeric modeling. Mine Water Environ 28(3):219–231
Borma LS, Mendonc¸a RMG, Souza VP (2002). Processo de Mitigac¸a˜o da Formac¸a˜o de Drenagens A´ cidas Utilizando Coberturas Secas. Projeto Ba´sico da Unidade Piloto e da Instrumentac¸a˜o, Avaliac¸a˜o Preliminar dos Custos de Instalac¸a˜o e Operac¸a˜o de piloto, RT 2002-038-00, Technical report for SIECESC, Rio de Janeiro, Brazil, p 126 (in Portuguese) Borma LS, Mendonc¸a RMG, Souza VP, Soares PSM (2003)
Utilizac¸a˜o de cinza no contexto da reabilitac¸a˜o de a´reas de minerac¸a˜o de carva˜o. Proceedings of the 5th Brazilian Congress on Environmental Geotecnics. CD ROM, Porto Alegre, Brazil (in Portuguese)
Cabral A, Racine I, Burnotte F, Lefebvre G (2000) Diffusion of oxygen through a pulp and paper residue barrier. Can Geotech J 37(1):201–217
CETEM (2001) Projeto Conceitual para Recuperac¸a˜o Ambiente da Bacia Carbonı´fera Sul Catarinense, vol I, RT/33/2000, Technical report for SIESCEC, vol I, II e III. Rio de Janeiro, Brazil (in Portuguese)
GeoAnalysis (2000) SoilCover. Unsaturated soils group, Dept of Civil Eng. University of Saskatchewan, Saskatoon
Geo-slope International LTDA (1998): SEEP/W for finite elements seepage analysis, user’s guide. Version 4.2, Canada
Heineck KS, Consoli NC, Bica AVD, Flores JAA (2003) Utilizac¸a˜o de Cinzas de Carva˜o Visando sua Aplicac¸a˜o como material Geote´cnico. Proceedings of the 5th Brazilian Congress on
0 10 20 30 40 50
1/9 2/9 3/9 4/9 5/9 6/9 7/9 8/9 9/9
10/9 11/9 12/9 13/9 14/9 15/9 16/9 17/9 18/9 19/9 20/9 21/9 22/9 23/9 24/9 25/9 26/9 27/9 28/9 29/9 30/9 1/10
Precipitation (mm) (a) (b) 0 10 20 30 40 50 60
1/9 2/9 3/9 4/9 5/9 6/9 7/9 8/9 9/9
10/9 11/9 12/9 13/9 14/9 15/9 16/9 17/9 18/9 19/9 20/9 21/9 22/9 23/9 24/9 25/9 26/9 27/9 28/9 29/9 30/9 1/10
V
ol.
W
ater content (%)
coarse waste mixed waste lower ash clay organic soil upper ash
Fig. 8 aRainfall in September 2008;bWater content of layers in cell 4 in September 2008
0 2000 4000 6000 8000 10000 12000 14000 16000 18000 20000 22000
1/3/08 1/4/08 1/5/08 1/6/08 1/7/08 1/8/08 1/9/08
1/10/08 1/11/08 1/12/08 1/1/09 1/2/09 1/3/09 1/4/09 1/5/09 1/6/09
Cumm
ulative v
olume of water (l)
Cell 1 Cell 2 Cell 3 Cell 4
Environmental Geotecnics, CD ROM, Porto Alegre, Brazil (in Portuguese)
MEND (2001) Dry covers. Mend Manual 5.4.2d Prevention and Control. In: Tremblay GA, Hogan CM (eds), vol 4. p 155–232 O’Kane MA, Ayres BK, Christensen D, Meiers G (2002)
CANMET-CETEM manual on cover system design for reactive mine waste. Report 689-01 prepared for CANMET-CETEM, June 2002 Simms PH, Yanful EK (1999) Some Insights into the performance of
an experimental soil cover near London, Onta´rio. Can Geotech J 36:846–860
Souza VP, Soares PSM, Possa MV, Santos MDC, Dalmina LB, Mello MC, Ubaldo MO, Borghetti Soares A, Trindade RBE, Bertolino AVFA, Borma LS, Mendonca RG, Almeida JR, Krebs ASJ, Schneider CL, Schneider CH (2007) Otimizac¸a˜o do processo de gerac¸a˜o de energia ele´trica a partir do carva˜o e recuperac¸a˜o ambiental das a´reas degradadas pela minerac¸a˜o, (internal CETEM research report)
Ubaldo MO (2005) Uso de Cinza de Carva˜o na Composic¸a˜o de uma Cobertura de Rejeitos de Minerac¸a˜o, MSc Dissertation, COPPE/ UFRJ, RJ, Brazil, p 150
Waugh WJ, Smith GM (2004) Monitoring the performance of an alternative cover using caisson lysimeters. Proceedings of WM’04 Conference, Tucson, AZ, USA
Wilson GW (1990) Soil evaporative fluxes for geotechnical engi-neering problems. PhD Thesis, University of Saskatchewan, Saskatoon, Canada
Wilson GW, Fredlund DG, Barbour SL (1994) Coupled soil-atmosphere modeling for soil evaporation. Can Geotech J 31:151–161
Yanful EK (1993) Oxygen diffusion through a soil cover on sulfidic mill tailings. J Geotech Eng ASCE 199(8):1207–1228 Yanful EK, Bell AV, Woyshner MR (2006) Design of a composite