Location Based on Open gis
Technology and Data
Cornel Ghiţă
Institute of World Economics, Romania [email protected]
This article presents the architecture, features, and operating mode of a dss (Decision Support System) aiming to assist entrepreneurs and man-agers in the process of location decision making. The research assem-bled concepts derived from theory, findings of empirical studies, together with open gis (Geographical Information System) software and data, and modelled them into a dss software tool, according to an original method-ology and design. The users are guided step-by-step to input information on their businesses into the dss (industry, preferences for land-use areas and facility types, weights of key location factors), and are returned two sets of results: one based on own options, and another one aggregate for the industry they operate in. The results consist in the top five locations for the user’s firm, as well as for the industry, depicted both in a graphical report (map) and a text report (explanation of results).
Key Words:decision support system for business location, open-source gis software, metropolitan areas
jel Classification:c88, d80
Introduction
Nowadays, a variety of geographical information systems are available; among them the most notorious are the electronic maps provided by In-ternet search services, such as Google, Yahoo!, Bing, etc. Their aim is to find locations, addresses, and provide information for navigation from point A to point B.
This paper subscribes to the global trend of evolving to knowledge economy and knowledge management systems (Galandere-Zile and Vi-nogradova 2005, 179–196). The advances of computer and communica-tion technology bring a massive amount of informacommunica-tion and knowledge, just a few clicks away. Accordingly, there is a huge amount of open gis data and open-source gis software available to be turned into valuable business information. While extensively used in other fields, gis data are underused in business management.
The dss currently applies to metropolitan areas. It is restricted only by the territory included in its geographical database. This means it can eas-ily be extended to other metropolitan areas by adding the appropriate ge-ographical information in the system. The dss software tool is targeted to metropolitan areas and builds upon empirical findings (Ghiţă, Scarlat, and Magano 2013; Ghiţă et al. 2013), obtained in two European metropoli-tan areas, respectively Bucharest – Romania, and Porto – Portugal. This paper is dedicated to moving forward from the empirical findings, pre-viously published, to unfolding the architecture, features and operating mode of the dss, in the form of a software tool built upon this knowl-edge.
The goal of the research was to create a dss for business location, which could be rapidly implemented. Accordingly, it was empirically tested and implemented in the author’s residential region – Bucharest, belonging to a transitional economy – Romania, where such a tool would be beneficial for the business environment. In the same time, the dss was conceived as relevant and extendable to metropolitan areas in general, so it had to be empirically tested in another metropolitan area, such as Porto – Portugal, which was the host of the author’s doctoral internship.
The dss was conceived as an open system, i. e. to attract real estate owners or agencies, and cluster-organization, interested in advertising their offer and identity, to input information into the dss, information that could add value for the users. For example, a user might be inter-ested not only in receiving top five locations, but also in finding available facilities in the areas and being able to contact owners, or adhering to cluster organisations.
research. Then, the following section is dedicated to a thorough descrip-tion of the dss, reinforced by the results obtained by an it-Software firm using the dss. The article concludes with the discussion of results, high-lighting the main features of the dss, the benefits brought to business environment, including the dss limitations, and development perspec-tives.
Business Location Concepts Derived from Literature
The dss developed upon several relevant concepts derived from litera-ture, in relation to places: land-use, attractiveness (appeal), accessibility, cost of space, and agglomerations of enterprises.
The father of location theory, von Thünen has developed a still-stan-ding theory ofland use(Thünen and Hall 1966). According to him, ho-mogenous economic activities coagulate in concentric circles around the town centre (market). Depending on the maximum cost they afford to pay for land (rent, price) and the cost of transport to the market, they chose to locate closer or farther from the town centre. Nowadays, land-use is more than a design shaped by economic factors; it is reinforced by institutional factors (land became object of urban and landscaping plan-ning).
Raicu and Popa highlighted two interrelated concepts in relation to places –attractivenessandaccessibility(Raicu and Popa 2009, 7–13). Ac-cording to them, the transport action from the initial area (origin) is in-duced by the attraction exerted by a utility located in another area (desti-nation), and the attractiveness increases proportionally with the number of convergent utilities. Conversely, accessibility is a constraint to attrac-tiveness, as attraction cannot trigger transport without the existence of a proper infrastructure. Although the two concepts are interrelated, they must be measured separately, asaccessibility is a feature of the transport system(the infrastructure’s role is crucial) and not directly related to the dynamic of commuting needs, while attractiveness is the motivation for commuting. Another consequence of the interplay between the two con-cepts is thenumber of potential visitors,in terms of pedestrian or road traffic in a given area.
transport cost is covered by the previous-mentioned concept of accessi-bility, according to the real estate websites surveyed, there is a lot of vari-ability in the cost of space. This varivari-ability can have three main compo-nents: distance to the central business district (Alonso 1964), the quality of endowments (utility), and the image and representativeness of the area (prestige) (Reijmer and van Noort 1999).
Another key concept used in the research is the agglomerations of industry-related enterprises. While Alfred Marshall was the pioneer of the concept of positive externalities within industrial districts (Marshall 1920), Michael Porter has the merit of a deeper insight into the clus-ter phenomenon, capturing both thecooperationandcompetitivenature of relations between enterprises located within the cluster (Porter 1998, 197–287).
Research Methodology
The goal of the research was to provide not merely a web-based gis soft-ware tool, but a fulldecision support system (dss)designed to help start-ups or relocating enterprises to find suitable operating sites, according to their needs. Thus, the software tool embedded the theoretical and empir-ical knowledge gained in a research undertaken between 2010 and 2013, including data inputs from users, accumulated with every location sim-ulation cycle stored in the dss database.
In a broad perspective, the dss integrates four components: 1. Own approach to the location problem of enterprises;
2. Results of a questionnaire-driven study performed to track the lo-cation behaviour of enterprises (Ghiţă et al. 2013);
3. Participants (entrepreneurs, real estate bidders, cluster organiza-tions, and software tool administrators);
4. The gis software tool itself.
In a strict sense, according to Daniel J. Power, decision support sys-tems constitute a distinct class of information syssys-tems, consisting in computer-based interactive systems or subsystems, designed to help deci-sion makers use communications technologies, data, documents, knowl-edge and/or models to identify and solve problems, in order to complete decision making process (Power 2004, 2015–31).
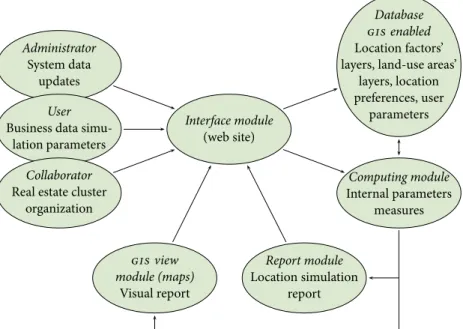
Administrator
System data updates
User
Business data simu-lation parameters
Collaborator
Real estate cluster organization
Interface module
(web site)
Database gis enabled
Location factors’ layers, land-use areas’
layers, location preferences, user
parameters
Computing module
Internal parameters measures
gis view module (maps)
Visual report
Report module
Location simulation report
figure 1 Web gis Software Tool: Basic Concept
knowledge gained in all stages of research (theoretical research, empiri-cal studies, own study based on questionnaires), and models (by simulat-ing the possible options, indicators measursimulat-ing variants, calibration, and selecting the best option).
Moreover, the dss operates on an infrastructure consisting of hard-ware and softhard-ware, including a gis-enabled database.
The research uses the concept ofmicro-locationto describe own ap-proach, namely the precise identification of suitable operating sites, in small and dense business territories, such as metropolitan areas.
The chosen assessment method of location factors is the factor rat-ing method,which is the most used method for valuing location options (Heizer and Render 2013), thanks to its versatility that makes possible to include a wide variety of factors. This method is actually a location adop-tion of the mathematical weighted sum method.
If required by user, the dss offers the possibility to render separate re-sults for theback-officelocation, defined as the place in which the com-pany operates manufacturing, services and/or storage, andfront-office lo-cation, defined as the place where the commercial operations are per-formed (including contact with customers) and also, in most cases, top management. This differentiation is based on the fact that earlier empir-ical findings in the metropolitan areas, referenced above, reveal a differ-ence between back-office and front-office, in terms of location behaviour. The site identification process is performed at two zoom levels: land-use area,that refers to a functionally compact territory assigned to a cer-tain land-use (e. g. residential area, industrial area, business park, etc.), andfacility type,that refers to a specific site in the area (e. g. office build-ing, individual commercial space, villa, etc.).
The questionnaire-driven study investigated thelocation behaviour of enterprisesin two metropolitan areas – Greater Porto Metropolitan Area (Portugal) and Bucharest-Ilfov Region (Romania). The questionnaire was designed to be applicable to metropolitan areas in general. The results of this study served as a starting point in determination of location factors matrix, weighted by industry, which was embedded afterwards into the dss software tool.
Participantsinclude people who contribute to the decision support sys-tem by information inputs. dss is designed as an open syssys-tem, by attract-ing partners interested in promotattract-ing their offers and brands (e. g. real es-tate agents or facility owners, who lease business sites). There are four types of dss software access accounts with different privileges and inter-faces, corresponding to the categories of participants who can input data: administrator account, user account (entrepreneur), real estate collabo-rator and cluster organisation collabocollabo-rator.
publicly under the same license (i. e. open and free of charge). The base map data were extracted from the free repository and rebuild inside the dss database.
Own contribution to the gis database consisted in adding data to the system, obtained primarily through remote sensing method, or initial data analysis and processing. An example of remote sensing was the iden-tification of the real estate web sites that offered business accommodation. Then, by using the Street View function in Google Maps, most of the busi-ness parks in the area were identified (as their precise location was hidden to the public on the real estate web site), and then were drawn as poly-gons and introduced into geospatial database. An alternative way that has not been used at this stage of investigation is the digital footprint of the population, which can be a source for estimating potential visitors flow.
The basic gis objects were further refined into layers according to the dss software tool logic, by appropriate database queries: geometric in-tersections, joins, splits, and mixed queries.OpenStreetMapdatabase was enriched by new defined data (over 300 polygons) saved in 20 new ta-bles. Also, for data processing and extraction were created 7 functions, 187 views (sql templates, saved as independent entities into the database) and a procedure for updating basic gis data.
The Architecture of the dss
The result of this research – the dss – was modelled into a gis software tool, designed to assist entrepreneurs and managers in the location deci-sion making. The logic and functionalities of the dss software tool are described thoroughly in this section, according to the modular structure depicted in Figure 1.
web interface module
This information is very technical and supplying even more details is beyond the scope of this paper. However, the main point is that several software components are involved in the process of rendering interactive maps on the website, and all the components are open-source and free of charge.
user data form
The user data input process consists of the following phases:
1. Edit previous simulation/new simulation – the user can either re-view one of her/his existing location simulation or launch a new one; 2. Fill in user’s input data form:
• Stage 1 – fill in: a name for the simulation, industry, and number of employees (estimate for first year after location);
• Stage 2 – specify which activities are subject to the location de-cision (back-office, front-office, or both). Only if the answer is ‘both’ an additional section is automatically activated, respec-tively a question whether back-office and front-office would be located on the same site or in different sites. Depending on the answer to this question, the form resumes with a single column of responses or two (one for the back-office and one for front-office);
• Stage 3 – choose land-use area, and facility type (multiple checks allowed);
• Stage 4 – choose type of the real estate offer: building vs. land, rent vs. sell. Also, in this stage, location factors are given weights according to user’s needs (total must be 100);
3. Rendering two sets of results (one set based on user’s own simula-tion, and one set based on the other users’ simulations in the same industry).
land-use areas’ gis layers
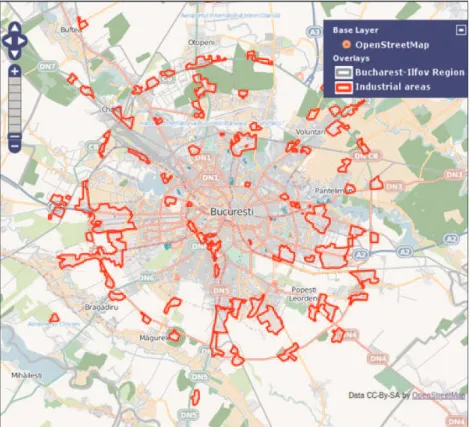
Land-use areas are polygons delineating an area with a specific function-ality. The types of areas used in the software are:
• Industrial/Warehouse Area:an area for industrial and/or warehouse use;
• Business Park:compact area with several modern office buildings; • Traditional Trade Area:high streets and avenues renowned for
figure 2 Land-Use Layer: Industrial Areas
• Science and Technology Park:area specializing in high technology fields (it, research, electronics, telecommunications, etc.);
• Urban Residential:e. g. residential zone within the city of Bucharest and the eight surrounding towns in Ilfov county (excluding land-use areas specified above);
• Rural Residential:within villages, having residential use;
• Rural Non-Residential:rural – outside localities – excluding special areas that businesses are not allowed in: forests, public infrastruc-ture etc.
An example of such an area layer is depicted in Figure 2. Areas are delineated according to theprinciple of covering the entire region of study, with no overlaps.
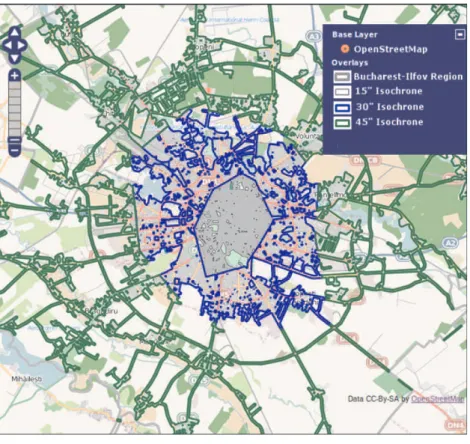
location factors’ gis layers
layers correspond to real ground objects, such as a highway or a public transportation node, surrounded by a buffer (proximity) area. Layers are ordered hierarchically by a scoring scale of 1 to 10 points.
The software uses the following location factors:
1. Freight accessibility – road:measured in terms of availability and cess speed. This factor takes into account the constraints to the ac-cess of trucks over 5 tones capacity (e. g. heavy trucks are restricted to drive in the inner city of Bucharest unless a prohibitive tax is paid), the category of road (affecting the speed and direction of travel), and type of locality – urban/rural (affecting access to markets). As an ex-ample to explain how factor scoring works, this factor’s set of layers, with the corresponding scores, are presented below:
• 10 points layer – Main access route (highway access, express road – outside truck restricted area);
• 8 points layer – Urban – main road (outside truck restricted area); • 7 points layer – Rural – secondary road (county road);
• 5 points layer – Urban – secondary street (outside truck restricted area);
• 4 points layer – Urban – main street (inside truck restricted area); • 3 points layer – Rural – peripheral road;
• 2 points layer – Urban – secondary street (inside restricted area); 2. Freight accessibility – railway: measures the possibility of access to the rail network, given that access can be done only at stations and platforms (industrial and warehouse areas with access to rail trans-port);
5. Potential visitors – road traffic:relates to access and speed to areas, taking into account population density, road class and crossroad rank in relation to the road network;
6. Potential visitors – footfall traffic: covers pedestrian traffic areas. It considers proximity to traffic generators, such as public trans-port stations/stops, leisure areas, main urban-residential crossroads, pedestrian crossings, commercial network concentration areas; 7. Cost of space:price/rent level, which follow similar spatial trends.
Polygon boundaries were made according to reports from the real estate market, and hierarchy of administrative units in Ilfov county (administrative territory of towns and villages);
8. Cluster-like behaviour:targets areas with a high density of companies in the same industry or connected industries;
9. Lower competition level:targets areas with a low density of compa-nies in the same industry (applies only to industries with spatial competition behaviour, such as retail, hotels and restaurants, finan-cial services, personal services, etc.).
Similar to the defined land-use areas, the layers belonging to the same factor are bounded by the same principles: to cover the entire territory, but not overlap, with a single exception, that is for the factor ‘potential visitors – footfall traffic’ where overlaps are allowed (stacking of layers adds to the factor intensity).
Figure 3 serves as a graphical representation of factors’ different inten-sity levels, depicted by the three gis layers belonging to the factor ‘Pas-senger accessibility – individual vehicle.’
computing module
As described in the above section, each factor selected by user in the data input form (so called key factor) has a set of layers, each layer consisting of multiple polygons. Also, the user fills in a relative weight for the selected factors, in a way that she/he considers appropriate for the business. The rule is that all weights must totalize 100.
figure 3 Isochrones Layers: Assessing Factor ‘Passenger Accessibility-Individual Vehicle’
Mathematically, this module iterates allmultiple array combinations, where each array is a factor and the elements of the array are factor’s gis layers (except for gis layers of the factor ‘potential visitors – footfall traf-fic’ which are allowed to overlap and thus each layer is considered inde-pendently). Not all the key factors are included, but only those that meet the following two conditions:
• Factor isselected (weighted) by userin the input data form;
• Factor’s gis layersintersect land-use gis layersselected by user in the input data form.
as well, that is, embodiments combining a number of elements less than the number of arrays. This model is repeated for each selected land-use area.
Calculation of the score for each combination variant is made by the following relation:
W =
n
i=1pi
n
i=1Pmaxi
×100 (1)
Wherenis the number of arrays (selected factors),piis the score of the layer of factoriincluded in the combination, andPmaxiis the maximum score for factori(i. e. score of the highest score layer of the factori).
If there is no intersection between the land-use layer and the factor layers included in the combination, the combination is not feasible, so model skips to the following possible combination. When first feasible combination is identified, it becomes the first (best) location result. The algorithm is continued until it finds the top five location results (having the highest score, and feasible).
location reports module
This module handles the location results computed after completing user input phase. The results are displayed both in a graphical display (gis map) and a text display (report), including map’s legend. The report in-cludes information on the top five location results, and how their scores are calculated.
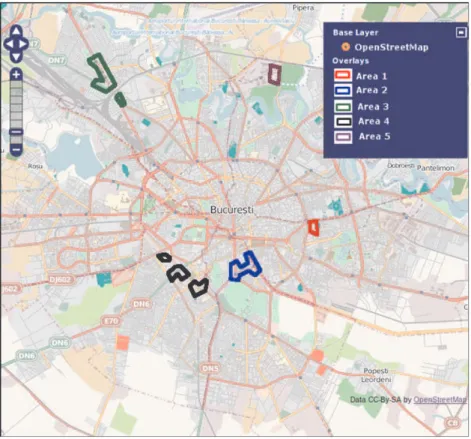
The software tool offers two sets of results. Thefirst set of resultsis based on user own options. Thesecond set of resultsis based on the aggregate simulations of the other users in the same industry. The only difference is that for the second set the land-use layers are also weighted by users’ choices. In the first set of results, even if multiple land-use layers are se-lected they are considered equal, because there is only one location simu-lation. As an example, Figure 4 and the text report below, depicts the first set of results obtained by anit-Software Firmfor the location of back-office.
figure 4 Graphical Report Example for an it Software Firm – Back Office
both back-office and front office. Alongside the graphical report, the dss provides the text report, which contains a review of the selections made by the user, the scores of the top five location results, as well as the cal-culations of these scores. For the same example of theit Software Firm – Back Office,the text report has the following structure:
User Options Summary
1. Industry: it-Software 2. Selected land-use areas:
• Industrial/Warehouse Area • Business Park
• Science and Technology Park • Urban-Residential
• Rural-Residential
• 10: Passenger accessibility – individual vehicle • 20: Passenger accessibility – public transport • 20: Potential visitors – road traffic
• 30: Cost of space • 20: Cluster-like area
4. Distinct locations for back-office and front-office
Top 5 Location Results
Out of a hypothetical total of 100 points (if all factors overlap at highest intensity) the following scores were calculated:
1. Area 1: 62 points
• Land-use area: Industrial/Warehouse Area • Factors:
– Passenger accessibility – individual vehicle: 10 points – Passenger accessibility – public transport: 20 points – Potential visitors – road traffic: 20 points
– Cost of space: 12 points 2. Area 2: 61 points
• Land-use area: Urban-Residential • Factors:
– Passenger accessibility – individual vehicle: 10 points – Passenger accessibility – public transport: 20 points – Potential visitors – road traffic: 16 points
– Cost of space: 15 points 3. Area 3: 61 points
• Land-use area: Urban-Residential • Factors:
– Passenger accessibility – individual vehicle: 7 points – Passenger accessibility – public transport: 20 points – Potential visitors – road traffic: 16 points
– Cost of space: 18 points 4. Area 4: 59 points
• Land-use area: Industrial/Warehouse Area • Factors:
– Cost of space: 15 points 5. Area 5: 59 points
• Land-use area: Industrial/Warehouse Area • Factors:
– Passenger accessibility – individual vehicle: 7 points – Passenger accessibility – public transport: 10 points – Potential visitors – road traffic: 16 points
– Cost of space: 6 points – Cluster-like area: 20 points
The maximum score that can be obtained by a location result is 100 points (100), but this is an ideal score that may be achieved only if all factors were selected, and they all stack at their maximum intensity over the selected land-use layer.
Discussion of Results
gis software tools cover many fields (weather, transport, land-use devel-opment plans, etc.). Though, business management field has little support based on gis technologies. The research presented in this paper aims to cover that gap.
The decision support system (dss) for the location of enterprises is in-tended to be applicable to all metropolitan areas. The geographical cov-erage can be extended by including gis data from other areas.
The dss integrates state-of-the-art gis technologies, i. e. latest ver-sions of gis open-source software and data. The basic gis data were obtained fromOpenStreetMap.The results of the dss are open to public and free of charge, having the obligation of being rendered under the same conditions as the basic data obtained from OpenStreetMap.
The research addresses the issue of location by building a decision support system that integrates four broad components: an approach to the business location of smes derived from theory and applied studies; a questionnaibased study on the location behaviour and related re-sults; participants (software administrator, users and interested partners to popularize their offer or identity, from real estate or cluster bodies); a software tool for business location (the decision support system itself).
The research approach falls within the termmicro-location,namely the precise identification of suitable operating sites for a certain business.
The dss provides the user with three lists of options:key location fac-torsthat may be selected and weighted (totalizing 100),land-use areas, andfacility types.At current stage, the dss does not offer information on facilities within the top location areas rendered, as it has not yet included real estate collaborators, whose role would be to detail facility offers. The prospective real estate collaborators are supposed to supply geo-tagged information on facilities by filling in their real estate offer forms. At that point those data will be embedded into the dss, thus location results will provide links to the real estate offers falling within the result areas.
The dss providestwo sets of results– one based on user’s own options, and another one (aggregate) based on all other users in the same indus-try. This offers users a means of comparing her/his options and results to other relevant ones. The dss can provide distinct results forback-office andfront-office,according to user’s option. The results are rendered di-rectly into the web browser (the software is web-based), including a gis report (map) and a text report with thorough explanations on options and results, as well as a map legend.
Users can enter a new simulation or revise an existing one. With each new simulation or review, the dss database is updated, so the industry results become more relevant. Moreover, the software includes an exe-cutable procedure for updating basic gis data contained in the dss, to newOpenStreetMapdatabase updates.
The problem of measuring the intensity of location factors in the differ-ent areas of the study region is very complex. For example, for calculating accessibility or attractiveness intensity, neither the origin nor the desti-nation points are known. Theoretically, any user can place the business anywhere, according to available options. Therefore, factor’s intensity is a relative measure, paying the maximum score to polygons where the in-tensity is the highest and lowering scores for polygons which have lower factor intensity.
In geometric delineation of the land-use areas, the principle used was thatareas do not overlap but cover the entire territory.The same principle was applied to the layers belonging to the same factor.
Paris, Amsterdam, Rotterdam, Moscow, and Istanbul, or from other con-tinents than Europe were not included. Also, each country or metropolis has its specificity in terms of economy, demography, culture, etc.
This research analysed the behaviour of firms and not the needs or expectations of customers or employees about the business location. It started from the premise that the location of economic activity is a con-sequence of the reaction of firms to the needs of potential customers. As such subjective factors both from the customer perspective – buyers’ be-haviour, preferences (Borgers and Timmermans 1986, 25–31), (Naumann 1995) and from the entrepreneur’s perspective – attachment to his na-tive place, aspirations, social life (Figueiredo, Guimaraes, and Woodward 2002, 341–61), (Stam2007, 27–50), were only indirectly addressed.
The set of key location factors used, combined with the specific fea-tures of land-use areas, offer a great flexibility in handling users’ prefer-ences. However, depending on the characteristics of each business, there may be factors which are not addressed individually, but could decisively influence the location decision.
Regarding further development of the dss, there isa quantitative di-rection– geographical expansion and aqualitative direction– evaluation and treatment, where appropriate, of basic geospatial data, adding new data and involving real estate and cluster collaborators.
The dss provides benefits to users (entrepreneurs and managers), such as reducing search time, site assessment, connecting with real es-tate bidders, structuring and prioritizing their location key factors and preferences, increasing their business awareness, quantifying their needs, and providing comparison with other users in the same industry (receive feedback from industry trends).
Acknowledgments
This paper has been financially supported within the project entitled ‘Hori-zon 2020 – Doctoral and Postdoctoral Studies: Promoting the National Interest through Excellence, Competitiveness and Responsibility in the Field of Romanian Fundamental and Applied Scientific Research,’ contract number posdru/159/1.5/S/140106. This project is co-financed by Euro-pean Social Fund through Sectoral Operational Programme for Human Resources Development 2007–2013. Investing in people!
References
Borgers, A., and H. J. P. Timmermans. 1986. ‘City Centre Entry Points, Store Location Patterns and Pedestrian Route Choice Behaviour: A Mi-crolevel Simulation model.’Socio-Economic Planning Sciences20 (1): 25–31.
Figueiredo, O., P. Guimaraes, and D. Woodward. 2002. ‘Home-Field Ad-vantage: Location Decisions of Portuguese Entrepreneur.’ Journal of Urban Economics52 (2): 341–61.
Galandere-Zile, I., and V. Vinogradova. 2005. ‘Where Is the Border be-tween an Information System and a Knowledge Management System?’ Managing Global Transitions3 (2): 179–96.
Ghiţă, C., C. Scarlat, J. Freitas Santos, and A. Correia de Barros. 2013. ‘Busi-ness Micro-Location: Factors, Preferences and Indicators to Assess the Influence Factors.’Management and Production Engineering Review4 (2): 25–36.
Ghiţă, C., C. Scarlat, and J. Magano. 2013. ‘Business Location: Mindset or Decision of Economics and Industrial Engineering?’Scientific Bulletin, Series D: Mechanical Engineering75 (1): 269–86.
gistutor.com. N. d. ‘Configuring GeoServer Proxy for Public and Remote Data Access.’ http://www.gistutor.com/geoserver/21-intermediate -geoserver-tutorials/38-configuring-geoserver-proxy-for-public -and-remote-data-access.html
Heizer, J., and B. Render. 2013.Operations Management.Engelwood Cliffs, nj: Prentice Hall.
Marshall, A. 1920.Principles of Economics.London: Macmillan.
Naumann, E. 1995.Creating Customer Value.Cincinnati, oh: Thomson. O’Sullivan, D., A. Morrison, and J. Shearer. 2000. ‘Using Desktop gis for
the Investigation of Accessibility by Public Transport: An Isochrone Approach.’ International Journal of Geographical Information Science 14 (1): 85–104.
Paganotti, S. N. d. ‘Generate an Isochrone Map Using Google Maps Api.’ http://sandropaganotti.com/generate-an-isochrone-map-using -google-maps-api/.
Porter, M. 1998. ‘Clusters and Competition: New Agendas for Companies, Governments, and Institutions.’ InOn Competition,197–287. Boston, ma: Harvard Business School Press.
Postgis Project. 2012. ‘Postgis 2.0 Manual.’ http://postgis.net/docs/ manual-2.0/.
Power, D. J. 2004. ‘Decision Support Systems: From the Past to the Future.’ Paper presented at the Americas Conference on Information Systems, New York, 6–8 August.
Reijmer, I., and E. van Noort. 1999.Location Choice of smes.Zoetermeer: eim Smal Business Research and Concultancy.
Stam, E. 2007. ‘Why Butterflies Don’t Leave: Locational Behavior of En-trepreneurial Firms.’Economic Geography83 (1): 27–50.
Postgresql. 2012. ‘Postgresql 9.1.8 Documentation.’ http://www .postgresql.org/docs/9.1/static/docguide.html.
von Thünen, J. H., and P. Hall. 1966.Von Thünen’s Isolated State.London: Pergamon.