On The Use Data Reduction
Algorithms for Real-Time Wireless Sensor Networks
Andre L.L. de Aquino1, Carlos M.S.
Figueiredo1 2, Eduardo F. Nakamura1 2,
Antonio A.F.
Loureiro1,
Ant6nio
Otaivio
Fernandes1, Claudionor J.N. Coelho Jr.1
1
Department of Computer Science,
Federal University of Minas Gerais, Belo Horizonte, MG, Brazil
Email:
{alla,mauricio, nakamura, loureiro, otavio}@dcc.ufmg.br2
FUCAPI
-Research and
Technological Innovation Center, Manaus, AM, Brazil
Abstract
This work presents the design of real-time applications
for wireless sensor networks (WSNs)by usinganalgorithm
based on data stream to process the sensor data. The
pro-posed algorithm is based on sampling techniques applied
to datahistograms created from original data streams
ac-quired by sensor nodes. As a result, the algorithmprovides asample oflognitemstorepresent theoriginal data stream
of n elements. In this work, we show how to use the data
reduction algorithm in real-time WSN design.
1. Introduction
Despite thepotential of their applications, wireless sen-sornetworks (WSNs)[1]haveseveralresourcerestrictions,
suchas low computationalpower, reducedbandwidth, and
limitedenergy source. For these networks, there are two
main types ofapplications: monitoring and actuating
ap-plications [6,7]. Manyof theseapplications have real-time deadline requirements, for example, military, surveillance
system, biometric sensors, and intrusion detection [3, 8].
Real-time solutions for WSNs are often based on existing
protocols, for example, network and link layers[3,5]. There
areworks which addressdesign solutions suchas
architec-tures or models to apply real-time in WSN [8]. None of
these proposals consider application aspects such as data
quality orapplicationrequirements. Inthiswork,weshow
real-time application design for algorithms that consider
dataquality aspects.
In some applications for WSNs, datausually arrives in anonline fashion, isunlimited, and there isnoorderinthe
arrival of data to be processed. Data with these features
arecalled datastreams [10]. Due tothe constraints of sen-sornetworks, sendingalargeamountof datacantake alot
of time. As aconsequence, ahigh delay willprobablynot
meetreal-time requirements ofagivenapplication.
There-fore,we mustprovide techniquesto control theamountof
datathrough the network and itsconsequentdelay.Inorder
todothis, manydatastreamtechniques thatcanbe usedin
WSNs. Inthiswork, we use asampling data stream
tech-niquetoreduce the data traffic.
General research in data stream algorithms tries to
es-tablish lower bounds for datastream algorithm classes or
presentspecificapplications thataremodeled by using data
stream algorithms [2, 10]. In WSNs, the network can be
consideredas adistributed database where some functions
(e.g. maximum, minimum, and average) are computed
in-network or they use the resources available at a
sen-sor database and apply them to extract management
in-formation from the WSN, such as energy and location of
nodes [4, 9]. Current sensor databases are notsuitable for
WSNs, since nodes have too few resources and real-time
aspects are notconsidered.
Inthiswork,weshowareal-timeapplication design for
WSNs when data reduction algorithms are applied. The
algorithm reduction presented is based in sampling tech-niques. Weevaluate thedelay metric for data delivery ver-sustheimpact of thesamplesizeonthe dataquality. Simu-lation results reveal that by using the designguidelines the
real-time deadlines are met and the networkrequirements
canbe reduced while keeping limited dataquality.
More-over, results show the efficiency of the proposed reduc-tionalgorithmby extending the network lifetime and
reduc-ing the delay without losingdata representativeness. The
proposed algorithm can be very useful to design
energy-efficient and time-constrainedsensornetworks.
This work isorganizedasfollows.InSection2,weshow howtodesign real-timesensornetworkapplications by
us-ing datastreamsalgorithms. Next,inSection
3,
wepresentthe data reduction algorithmfor summarizing sensor
2. Design of Real-Time WSN
Applications
This section discussesreal-time applicationdesign based
on data reduction algorithms, in our case, a data stream
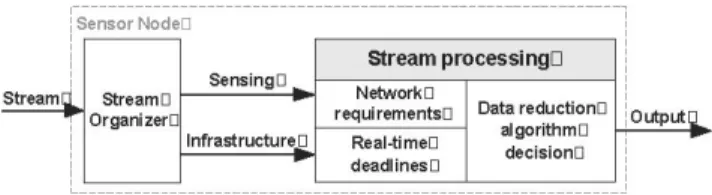
basedalgorithm. InFigure 1,we presentthe desired
behav-ior of the data stream considering real-time requirements.
Oncea sensornode receivesadatastreamfrom thewireless
medium the data stream is classified by the Stream orga-nizer, and theStream processingchooses thesample sizeor
particular algorithm for generating the sample. The blocks
aredetailedasfollows:
applications usually use probabilistic methods to treat the
data and haveno communication acknowledgment. These
aspectshide theuseof hardreal-time. Inthedesign ofasoft
real-time system, we mustknow the delaybehavior of the
data for eachsolution being used. In our case,thedeadline
requirements of the applications canbe met by the stream
algorithmsortheadoptedsample size; and (iii)Data
reduc-tiondecision: inthelast stepof thedesign, the decision of the bestsolution to treat the stream input depends on the network requirements,deadlines, and data quality. This de-cisioncanbeon-lineorindesign level. The dataquality is important because the reductionmaydegrades the data.
3. Data Reduction
Algorithm
The data reductionproblemtoattend the design of Sec-tion2,canbe statedasfollows:
Figure 1. Real-time stream application.
The first design phase is the organization of the streams
generatedinthesensornetwork,Stream organizer. Thiscan
be doneaccordingtothefollowing classification: Sensing is themostnaturalstream. It representsthe sensed datainthe
network and its transmissionmodel dependsonthe network
communication type. In this case, we generally maintain
the data values. Infrastructure is usedto supportnetwork
functions such as routing, data fusion, and data
compres-sionalgorithms. Forexample, the data being forwardedin
theroutingprocess canbe consideredas adata streamand beprocessed by adata stream algorithm. In thiscase, the
use oforiginal data depends on the application. For each
stream type we have a different treatment and deadlines.
In a real-time application design, the Stream organizer is responsible for identifying the data streamusing the infor-mation of received data. This fact allows thestream tobe properly processedtoattendreal-time requirements.
In the seconddesign phase, Stream processing, agiven
stream executesthree streamprocessing functions: (i)
Net-work requirements: there are different sensor network
re-quirements(scalability,energy,packetloss,delay, and
qual-ity of data). These requirementsareusedtodecide the best
reduction solution tobe used in the network. This occurs
because the reduction may lead to different outputs with
different "data qualities"; (ii) Real-time deadlines: to use
deadlines in a sensor network, we mustconsider hard and
softreal-time applications: Hardreal-timeapplications are
typicallyfound wheninteractingat alow level witha
phys-ical hardware, inembedded systems. Softreal-time
appli-cationsaretypicallyfound when there is aneedtoperform
some concurrent access to adatastoragefrom different pro-cesses. In sensornetworks, it is common the use of soft
real-time because the environment is notcontrolled. The
Problem Statement: Given a sensorstream, we
want to meet WSN requirements by reducing
data traffic (by using techniques based on data
streams) and assuring a minimum data quality
thatallowstoreduceenergyconsumption and
de-lay.
Thisproblem canbe further assessedby answering the
following questions: (i) Time limits: What are the time limits for real-time datastream applications in sensor
net-works? In real-time design, we must determine the time
limits ofour solutions. In general, alower bound can be
determinedby the shortest path between source and sink
nodesconsideringonlyonedatastreamofagiven size. One
stream canbe usedtopreventtheinfluence of other network characteristics suchasrouting stack saturation; (ii)Data
re-duction and dataquality: How can weevaluate thequality
of theprocessed data? Due tonetworklimitations and data characteristicsonly samplesof the datastream canbesent.
Thus,we mustevaluateifthe reduced data isrepresentative.
Toperform this evaluationwe can usestatistictests toknow whether theoriginalsensor streamand thesampledone are
equivalent, andalso comparethe distance between the av-erage of their data values; and (iii) Project requirements: Can the desired behavior of data streamapplications,
con-sidering real-time requirements presented in Section 2, be
achieved? To make it possible we need to know the
be-havior of theproposed solution regarding all requirements
addressedin Streamprocessing. FortheStream organizer,
weonly identifythepackettype. Inthiswork,weattend the
Streamprocessingrequirements by usingouralgorithm.
Thesampling based data streamalgorithm is motivated
by the problem stated above. The data reduction will be
achieveby sampling the original data. This solution aims
Algorithm 1: Pseudo-code of thesampling algorithm. Data: stream[n]-window of original data stream
Result: sample[m]-sample set resulted
1 begin
2 Sort(stream)
3 widthClass<-"Histogram class width"
4 first <- stream[O]
5 numElemColStream O- 0
6 indexO-0
7 j -O
8 fori -0ton -do
9 if stream[i] > f irst + widthClass or i n 1 then
10 numElemColSample
<-[m X numEl emColStreaTm 11 whilenumElemColSample > 0 do
12 index <-"Random elementinthehistogramclass"
13 numElemColSample
numElemColSample -1
14 sample[] [- jstream[index]
15 -iJ+1
16 end
17 numElemColStream O- 0
18 first -- stream[i]
19 end
20 numElemColStream<-numElemColStream +1
21 22 23 end
end
Re- -sort( sample) {accordingto theoriginalorder};
Our sampling-based algorithm provides a solution that
al-lows the balance between best data quality and network
re-quirements. The sample size canvary, but itmustbe
rep-resentative to attend the data similarity requirement.
Ac-cordingtonetworkrequirements, we can settheamountof
samples betweenlognandn. Thus, itcanattend thequality requirementsinrelationtothe networkrequirements.
The sampling algorithmcanbe divided into the
follow-ing steps: (i) Build a histogram of thesensor stream; (ii)
Create a sample based on the histogram obtained before.
To createsuchasample, werandomly choose the elements of eachhistogramclass, respecting the sample size and the class frequencies of the histogram. Thus, theresulting
sam-ple will be represented by thesamehistogram; and (iii) Sort the data sample accordingtoits order intheoriginal data.
Thepseudo-code of thesampling algorithm is givenin
Al-gorithm 1.Wealso considern asthe number ofelementsin
theoriginal datastream,andm astheadoptedsample size.
Analyzing the Algorithm 1 wehave: Line2 executes in
(n
logn).
Lines 11-16 define the inner loop thatdeter-mines the number of elements at each histogram class of
the resulting sample, which takes
0(m)
steps. Lines8-21 define the outer loop in which the input data is read
and the sample elements are chosen. Because the inner
loop is executed only when condition in line 9 is
satis-fied, the overall complexity of the outer loop is
0(n)
+0(m)
=O(n
+m)
since wehave an interleavedexecu-tion. ConsidernumClass the number of histogram
classes,
numElemColStreami
and numElemColSamplIe,re-spectively,thecolumnsinoriginalandsampledhistograms, where0 < i < numClass. Basically, beforeevaluating
the condition ofline6,
nTumElemColStreami
is countedand ntm-lass interactions are executed. Whenever this
condition is satisfied,
numElemColSamplei
isbuilt andm interactions are executed(loop 11-16). Inorder numClass
tobuild thecomplete histogram, we must coverall classes
(nTumClass), then we have nTumClass x ( nl+m±7) =
n+ m.Line22 re-sortsthesampleinO(m log m). Thus, the overallcomplexity is 0(nlogn)+0(n+m)+
O(mlog m) = O(n log n), sincem < n. Thespace
com-plexity isO(n +m) = O(n) becausewe storetheoriginal
data stream and the resulting sample. Since every source
nodesends itssamplestreamtowards the sink, the
commu-nicationcomplexity isO(mD),where D is thelargestroute (inhops)inthe network.
4.
Algorithm Evaluation in Real-Time Design
Fromthe design phases showedinSection2 inorderto
analyze the data reduction behavior in real-time
environ-ment, weconsider fouraspects: (i)Stream organizer: We useonlyonetype of datastreamarriving sensing; (ii)
Sen-sornetworkrequirements: Weanalyze theenergybehavior
using our solution because energy is the most import
as-pectofWSNs; (iii) Real-time deadlines: Weanalyze the de-lay limits forourdata reductionsolution and observe which
deadlines canbe supported by our solution; and (iv)Data
reduction decision: We analyze the data quality behavior
foroursolution and discuss about the project decision from theresults combination.
Theevaluation of thealgorithms is basedonthe follow-ingassumptions: (i) Simulation: Weperformourevaluation
through simulations andusethe NS-2 (Network Simulator
2) version 2.30. Each simulated scenariowasexecuted with
33 random topologies. At the end, for each scenario we
plot theaveragevalue with95% of confidence interval; (ii)
Network topology: We use a tree-basedrouting algorithm
calledEF-Tree [11] as theroutingprotocol, thedensity is keptconstant, and all nodes have the samehardware
con-figuration. Toanalyze onlytheapplication, thetreeisbuilt just once,before the traffic starts; (iii) Streamgeneration: The streams usedby the nodes are always the same, fol-lowinganormal distribution, where the valuesarebetween
[0.0;
1.0],
and the generation periodicity is 60s. The sizeof the data packet is 20 bytes. For larger samples, these
packets arefragmented bythesources andre-assembledat
the reception; and (iv) Evaluatedparameters and stream
size:Wevaried the number ofnodes, streamsize, and
num-ber of nodesgenerating data. Foreachevaluatedparameter we analyzed the application and network behaviorby
us-ingsamplesizesofn andlogn. Allparametersusedinthe simulationsarepresentedinTable 1.
Inorderto evaluate the dataquality by distribution
Table 1. Simulation parameters.
Parameter Values Parameter Values
Network size Varied with density Simulation time 5000s Queue size Varied with stream Traffic start I000s
Sourcelocation Random Trafficend 4000s
Number of sources 1, 5, 10, 20 Streamperiodicity 60s Number of nodes 128,256, 512, 1024 Sinklocation 0, 0 Stream size (n) 256, 512, 1024, 2048 Radio range (m) 50 Sample size log n,n/2,n Bandwidth(kbps) 250
usetheKolmogorov-Smirnovtest(K-S test) [12]. Thistest
evaluates if two samples have similar distributions, and it
is not restricted tosamples followinganormal distribution. Moreover, asthe K-Stest only identifies ifthesample dis-tributions aresimilar, it is also importanttoevaluate the
dis-crepancyof the valuesinthe sampledstreams, i.e., ifthey stillrepresenttheoriginal stream. Toquantify this
discrep-ancy (Data Error) we compute the absolute value of the
largest distance between theaverageof theoriginal data and thelowerorhigher confidence interval values(95%) of the
sampled data average, Data Error = Max{ luwervalue
Generateavgl
highervale-
Generateavg }, where the pair(lowervalue;
highervalue)
is the confidence interval of data sample and Generateavg is theaverageoforiginal data.In thefollowing, weshow the simulation results of the
datareductionalgorithmtoaddress thedesign requirements forreal-time applications.
DEADLINE BEHAVIOR. An important issue to be
considered when evaluating real-time requirements is the
possible time limits of each sample size of data streams.
These time limitscanbevery difficult todetermine dueto
the possible dynamic conditions during the network
oper-ation, such as different number ofsources, data sizes, and
topologies. Thus, weperformed this study by considering
theamountof data sent inthe network andby changing the
samplesizes.
In order to do this,
weconsiderannetwork
with a fixed size of 256 Table 2. Time limits
nodes, running thetree- stre n n log n
based routing infras- 256 0.62 0.36 0.11
512 1.12 0.67 0.11
tructure, and only one 1024 1.98 1.19 0.11 source of data generat- 2048 3.70 1.94 0.11
ing streamswith
differ-entsizes. We usethelowestaveragedelayobtainedthrough
simulations by considering random topologies and a tree
with the minimum number ofhops between the nodes. The
delayis determinedby measuring the time between the first datapacketsentby the source and thelast packet received by the sink, i.e., it is the time for a stream to be entirely
receivedby the sink. Table 2summarizes the time
limits,
in seconds, for our data reduction algorithm using
differ-entsamplestrategies and the considered data stream sizes.
These limits are used in the Real-Time Deadline module
present in Section 2 to help innetwork decision when our
solution is applied in a real-time environment. So, ifthe deadline requirementmetthis time limits our solutioncan
be usedinthereal-timeapplication.
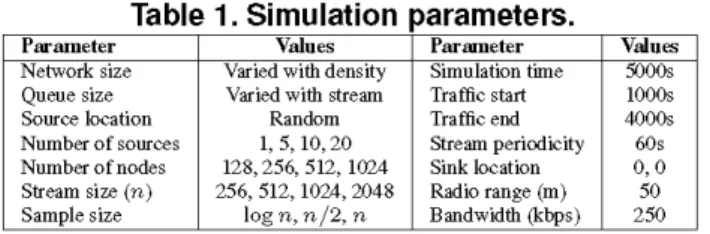
A moredetailed evaluationof thedelayperformance is presented in Figure 2. This evaluation considers the delay of the entire networkto delivery adatapackettothe sink.
Inthisevaluation, we usedifferentsample sizes (lognand
) and the complete sensor stream (n). These cases are
analyzed with different network scenarios by varying the
networksize, the amount of generated data at the source,
and the number ofsources.
We observeinallcasesthat when the sample size is
di-minishedthedelay diminishes accordingly. Thelogn
sam-ple is the best result because the number of elements in
packet has a little increased. Analyzing the figures
sepa-rately, whenthe number of nodes varies (Figure 2(a)), the delay variesalittle. Thisoccursbecauseonlyone sourceis used, and both the size of thesensor streamand the network density didnotchange. Inthis scenario, the logn sample
hasless impactonthedelay.
When the size of the sensor streamvaries (Figure 2(b)),
we canobserve theimpact ofoursolutionsinthedelay. The lognsample has the best performanceinallcases,and the delay doesnot varywhenthesample size increases. In the
lognsample, thisoccursbecause the number ofelementsin
packet is increasedonlywhenweincrease thesensor stream
size (256, 512, 1024, 2048). The other results (samples of
2 and
n)
haveworseperformances
because the number of packets is increasedproportionallywhen thesensorstream-ingsize is increased.
When the number of nodesgenerating data varies
(Fig-ure2(c)), thesampleoflognhave the bestperformance for allcases. Thisoccursbecause, inthisscenario,more
pack-ets arepassing through the network when we increase the
number of nodes generating data. Each source using the
sampleoflogn usesonly onepacket (the packet size isno
more than 20bytes) to send its data to the sink. For the
otherresults (samplesofn' and
n)
eachsourcenode gener-ates morethan oneapplicationpacket,overloadingthenet-work, andcausing delay. These results are close to time
limits showedinTable 2.
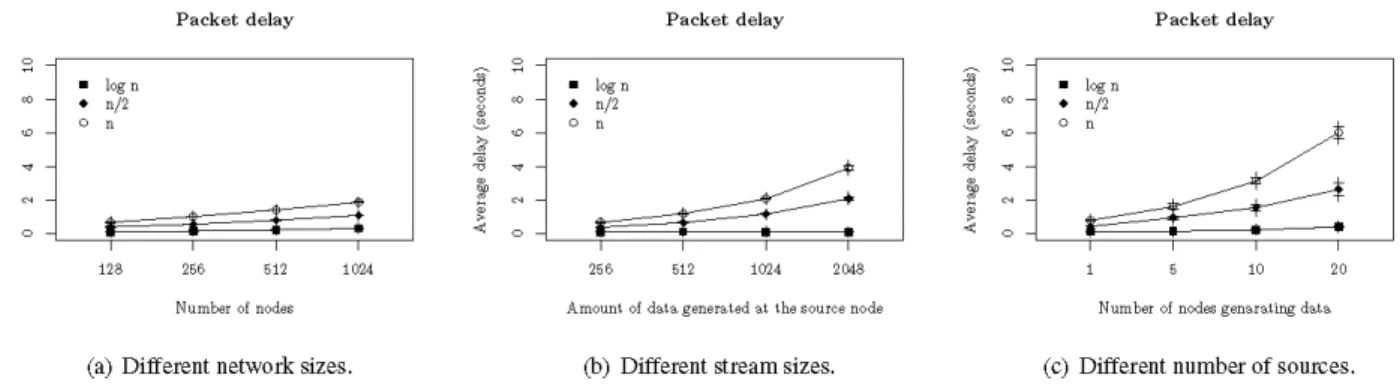
ENERGY BEHAVIOR. This evaluation considers the
energyconsumption of the entire networktodeliveryadata
packet to the sink. Again, we use different sample sizes
(logn and n) and the complete sensor stream (n). These
cases areanalyzedwith different network scenariosby
vary-ing the networksize, the amount ofgenerated data at the
source, and the number ofsources. Accordingtothedelay
behavior, as a result when the sample size
decreases,
theconsumedenergydecreases for the same reasonthatdelay
behavior. Again,thesameeffect of the number of node
Packet delay
7 * log n
0 - * n/2
o n
-5
128 256 512 1024
Number ofnodes
(a) Different networksizes.
Packet delay
7 * log n
* n/2
On
256 512 1024 2048
Amount of data generated at the source node
(b) Different stream sizes.
Packet delay
7r logn
s 5 n/2
Onn
1 5 10 20
Numberof nodesgenarating data
(c) Differentnumberof sources.
Figure2.Average delay.
of nodes generating data (Figure 3)vary we canobserve the
impactontheenergy whenour solution is used. In the all
cases,thesample lognhas the best performance. These
re-sults are usedin theSensorNetworkRequirementmodule
presentin Section 2tohelp deciding when the application needstosaveenergy.
Energyconsumption
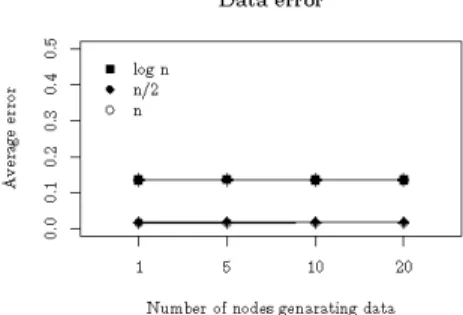
errorisconstant, since the data lost is small. The greatest error occurswhenwe use asmallersample size but the data
similarity is kept.
Vertical distance inKS-test
10 20
Number ofnodesgenaratingdata
1 10 20
Number of nodesgenaratingdata
Figure 3. Total energyconsumption.
DATA QUALITY BEHAVIOR. Here, we presentthe impact ofour solutionby evaluating the data quality. The
sampling solution looses information inits process,
there-fore it isimportanttoevaluateitsimpactonthe dataquality.
Again, the impact of the sampling solution is made through the K-S testand theaverage error. Like the network
eval-uation, we usedifferent samplesizes(lognand )and the
completesensor stream(n) indifferent network scenarios. We varythe network size, theamountof data generated at
thesource,and the numberofsources. Here,weshowonly
the number of sources result because in all scenarios we
have thesamebehavior.
Figure 4 shows the similarity between the original and sampledstreamdistributions. The difference between them is called ks-diff. The results show that when the sample size is decreased theks-diff increases. Because the datastreams
are generated between [0.0; 1.0], ks-diff is 20% for logn
sample sizes, and ks-diffis 10% for n sample sizes. The
Figure4. K-S distance.
We also evaluate the data quality through the
discrep-ancybetween the original and sampledstreamaverage
val-ues (Figure 5). This error we call data-error. Like the
ks-diff, when thesample size decreases, the data-error
in-creases. However, data-error is 10% for samplesoflogn,
and data-error is almostzeroforsamplesof . Again, the
erroris constant for the same reason of the ks-diff. How-ever animportant observation is that the data-error is the
samefor
samples
of andn.Therefore,
ifwewant tokeep
the maximum dataquality, considering thedata-error, we cansendonly samples of n. These results areused in theDataReductionDecisionmodulepresentedinSection 2 for
help in decision about the data quality when the application
requirequalityindataprocessing.
Insummary, whenwe analyze the combination of data
quality, network behaviorand deadlines in the Data Reduc-tion Decisionmodule, presentedinSection2, weconclude
that: (i) the sample oflogn reduces the energy
consump-tion anddelayby reducingtheamountof databeing
trans-mitted.However, the data quality is affectedinthe distribu-tionsimilarity (20%) andaveragediscrepancy (10%). But
* logn * n/2
O n
rS'.
X .
.~
* logn * n/2
o n +
E + +4
~~~~I t
Dataerror
1 10 20
Number of nodesgenaratingdata
Figure 5. Averageerror.
thisquality maybeacceptable in WSNs applications when
the network restrictions are strong; (ii) the sample of n is interesting when the application priority is theaverage
dis-crepancy (near zero); and (iii) it is interesting not to use ouralgorithm (sample of n) whenwehavetokeep thesame
dataquality similarity andwedonothavetoworryabout the
WSN restrictions. The resultsanswerthequestions Data
re-duction and dataqualityandcanbeappliedtotheproblem
addressed in Section 3.
5.
Conclusion
In real-time wireless sensor networks applications, a
veryimportant requirement is the timetodeliver such data
streams to the sink, and, as discussed in this work, the
amount of data in transit through these constrained
net-works hasagreatimpactonthedelay. Thus, weproposed
and evaluatedabased datastreamalgorithm thatuses a
sam-pling over ahistogram techniquetoreduce datatraffic, and consequently the delay andenergyconsumption. This work
representsawaytodeal withenergyand time constraintsat
theapplication level,as acomplementary viewtosolutions thattreatthisprobleminlower network levels.
The results show theefficiency of the proposed method by extending the network lifetime since data transmis-sion demands lots ofenergy andreducing the delay
with-outlosing data representativeness. Suchatechniquecanbe
veryusefultoachieveenergy-efficient and time-constrained
sensor networks ifthe application is not so dependent on
the dataprecisionorthe networkoperates inexception
situ-ation(e.g., fewresources remaining orurgent situation de-tection). Moreover, the proposed methodmeetsthedesign requirements in real-time WSNs.
As future work, we intend to better evaluate the
pro-posed technique by considering other network scenarios, andmatchingtheproposed application-level solution with lower-level ones, for example, by considering some
real-time-enabled routing protocol. We also planto apply the proposed methodtoprocessdata streamsalong the routing
task. Thus,notonly the data from a sourceis reduced, but
similar data from differentsourcesis also reduced, resulting
ina moreenergy-efficient solution.
References
[1] I. F. Akyildiz, W. Su, Y. Sankarasubramaniam, and
E.Cayirci. A survey on sensornetworks. IEEE
Commu-nicationsMagazine, 40(8): 102-114, August 2002.
[2] L.S. Buriol, D. Donato, S. Leonardi, andT. Matzner.
Us-ing datastreamalgorithms for computing properties of large graphs. In Workshop on Massive Geometric Data Sets
(MASSIVE'05), Pisa, Italy,June 9 2005.
[3] T. H. Chan, C. K. Ki, and H. Ngan. Real-timesupportfor
wirelesssensornetworks. Unpublished,2005.
[4] J.Ledlie, C.Ng, D.A. Holland,K.-K. Muniswamy-Reddy,
U. Braun, and M. Seltzer. Provenance-aware sensordata
storage. In1stIEEEInternationalWorkshoponNetworking Meets Databases(NetDB), April2005.
[5] H. Li, P. J. Shenoy, and K. Ramamritham. Scheduling
com-municationinreal-timesensorapplications. In IEEE
Real-Time and Embedded Technology and Applications
Sympo-sium -(RTAS'04), pages 10-18, Toronto, Canada, 25-28 May 2004. IEEE,IEEEComputer Society.
[6] A.Lins, E. F.Nakamura, A. A.Loureiro,and C. J. Coelho
Jr. Beanwatcher: A toolto generate multimedia monitor-ing applications for wireless sensornetworks. InA. Mar-shall and N. Agoulmine, editors, Management of Multime-dia Networks andServices, volume 2839 of Lecture Notes inComputer Science,pages128-141, Belfast,Northern Ire-land, September 2003. Springer-Verlag Heidelberg. [7] A.Lins,E. F.Nakamura,A. A.Loureiro,and C. J. Coelho Jr.
Generating monitoring applications for wireless networks. InProceedings of the 9th IEEEInternational Conference
onEmerging TechnologiesandFactoryAutomation (ETFA
2003), Lisbon, Portugal, September2003.
[8] C. Lu, B. M. Blum, T. F Abdelzaher, J. A. Stankovic,
and T. He. Rap: Areal-time communication architecture for large-scale wireless sensor networks. In IEEE Real TimeTechnologyandApplications Symposium-(RTAS'02),
pages55-66, SanJose, CA, USA,24-27September2002. IEEE,IEEEComputer Society.
[9] S. R. Madden, M. J. Franklin, J. M. Hellerstein, and W.Hong. Tinydb: Anacquisitional queryprocessing sys-temfor sensornetworks. ACM Transactions onDatabase
Systems (TODS), 30(1):122-173,March 2005.
[10] S.Muthukrishnan. Data streams: Algorithms and
applica-tions. In 4th ACM-SIAMSymposiumonDiscretealgorithms,
Baltimore, Maryland, 2003.
[11] E. F.Nakamura, F G.Nakamura,C. M. S.Figueredo, and
A. A. F. Loureiro. Usinginformation fusiontoassist data dissemination in wirelesssensornetworks. Telecommunica-tionSystems, 30(1/2/3):237-254,November 2005.
[12] S. Siegel and J. N. John Castellan. Nonparametric Statis-ticsforthe Behavioral Sciences. McGraw-HillCollege,2nd editionedition, January1988.
* logn * n/2
o n