vulgare
L.)
Fei Dai1, Long Qiu1, Lingzhen Ye1, Dezhi Wu1, Meixue Zhou2*, Guoping Zhang1*
1Department of Agronomy, Zhejiang University, Hangzhou, China,2Tasmanian Institute of Agricultural Research, University of Tasmania, Launceston, Tasmania, Australia
Abstract
Background: Endogenous phytase plays a crucial role in phytate degradation and is thus closely related to nutrient efficiency in barley products. The understanding of genetic information of phytase in barley can provide a useful tool for breeding new barley varieties with high phytase activity.
Methodology/Principal Findings:Quantitative trait loci (QTL) analysis for phytase activity was conducted using a doubled haploid population. Phytase protein was purified and identified by the LC-ESI MS/MS Shotgun method. Purple acid phosphatase (PAP) gene was sequenced and the position was compared with the QTL controlling phytase activity. A major QTL for phytase activity was mapped to chromosome 5 H in barley. The gene controlling phytase activity in the region was named asmqPhy.The geneHvPAP awas mapped to the same position asmqPhy, supporting the colinearity betweenHvPAP aandmqPhy.
Conclusions/Significance:It is the first report on QTLs for phytase activity and the results showed thatHvPAP a, which shares a same position with the QTL, is a major phytase gene in barley grains.
Citation:Dai F, Qiu L, Ye L, Wu D, Zhou M, et al. (2011) Identification of a Phytase Gene in Barley (Hordeum vulgareL.). PLoS ONE 6(4): e18829. doi:10.1371/ journal.pone.0018829
Editor:Zhanjiang Liu, United States of America
ReceivedJanuary 30, 2011;AcceptedMarch 10, 2011;PublishedApril 21, 2011
Copyright:ß2011 Dai et al. This is an open-access article distributed under the terms of the Creative Commons Attribution License, which permits unrestricted use, distribution, and reproduction in any medium, provided the original author and source are credited.
Funding:The project was supported by China Natural Science Foundation (30971719) and "Australia China Collaboration on Barley Germplasm" funded by Grains Research and Development Corporation of Australia. The funders had no role in study design, data collection and analysis, decision to publish, or preparation of the manuscript.
Competing Interests:The authors have declared that no competing interests exist.
* E-mail: [email protected] (MZ); [email protected] (GZ)
Introduction
Phytic acid, myo-inositol 1, 2, 3, 4, 5, 6-hexakisphosphate (InsP6), is a principle storage form of phosphorus (P) and inositol in cereal grains, and it is an effective polyanionic chelating agent [1]. Phytate deposition plays an important role in storage and homeostasis of both P and some other mineral nutrients during grain development and maturation [2]. However, phytic acid has been termed as an ‘‘anti-nutrient’’ because of its direct or indirect ability in binding minerals. Thus, phytic acid altered the solubility, functionality, digestibility and absorption of mineral nutrients, which significantly restrict the bio-availability of mineral nutrients in feed [3,4]. Reduction of phytate levels or increase in phytase activity in plant seeds is an alternative strategy for improving nutrient efficiency in animal production [5].
Phytase (myo-inositol hexaphosphate hydrolase) hydrolyses phytic acid to myo-inositol and inorganic phosphate. Sandberg and Anderson [6] found that endogenous phytase in wheat bran played a crucial role in phytate degradation in the stomach and small intestine of humans. Moreover, phytate was degraded during food processing by enhancing natural phytase activity or by phytase pretreatment of legume and cereal grains [7]. Hence, the enhancement of endogenous phytase activity of cereal grains could improve the bioavailability of mineral nutrients in cereals [8,9,10]. Phytases are also considered as environment-friendly enzymes, by avoiding the additional supply of exogenous phosphate and reducing the phosphate pollution from agricultural animal waste [11,12].
Phytases are widespread in nature, and relatively higher phytase activities have been reported in cereals, such as rye, wheat and barley [5,13]. There are three groups of phytases based on the catalytic mechanism, i.e. histidine acid phosphatases or acid phosphatases,b-propeller phytases, and purple acid phosphatases (PAPs) [11,14]. According to the position of their initial hydrolysis of phytate, phytases can also be classified as 3-phytases, 6-phytases or 5-phytases [11,15]. Two main types of phytase have been identified in plants, acid phytase and alkaline phytase, with a pH optimum around pH 5 and 8, respectively [5]. Most of the purified phytases belong to the acidic ones, such as those from oat [16], maize [17] and faba beans [18]. Two types of phytases have been identified from 4-day-old barley seedlings. One phytase (P2) was identified as a constitutive enzyme, whereas the other one (P1) was induced during germination [13]. Several cDNAs encoding a group of enzymes with phytase activity in barley and wheat were cloned and characterized. They were named as multiple inositol phosphate phosphatases (MINPPs), all were acid phytase [19].
germinating soybean, which showed a high degree of sequence similarity to PAPs, named as GmPHY. The enzyme displayed optimal pH at 4.5–5.0. However, not all PAPs exhibit phytase activity and not all of these enzymes effectively utilized phytate as a substrate. In these cases, PAPs play an auxiliary role in the degradation of phytate [22].
Barley is an important food crop in many countries, as well as a basic material in both brewing and the feed industries [24,25]. Many efforts have been made to improve phytase activity or reduce phytate concentration in edible tissues [2,3,6,23]. Our previous studies showed that the phytic acid content in barley is greatly affected by both genetic and environmental factors [26], and phytase activity differed greatly among genotypes [27]. Therefore it is possible for us to reduce phytic acid content in barley products through improving phytase activity in grains.
This study aimed at identifying QTLs controlling phytase activity using a doubled haploid population; purifying and characterizing phytase proteins; and clarifying the relationship between the gene in the QTL region and different isoforms of purple acid phosphatase (PAP) gene.
Materials and Methods
Plant materials
A barley population consisted of 177 doubled haploid (DH) lines from a cross between Yerong and Franklin [28]. Franklin is an Australian two-rowed malting barley, and Yerong is an Australian six-rowed feed variety.
Plant growth and sample preparation
The DH lines and parents were grown in four different environments. The first field trial was conducted at the farm of Zhejiang University, Huajiachi campus (ZUH), Hangzhou, China, in 2008–2009 growing seasons, with local-field management. The second and third field trials were conducted at ZUH in 2009–2010 growing seasons with two levels of nitrogen application. According to our previous report [29], 180 kg ha21and 120 kg ha21N was applied for High-Nitrogen (HN) and Low-Nitrogen (LN) treat-ments, respectively. Fifty percent of N as base fertilizer was applied before sowing, and twenty-five percent of N as urea was applied at booting and heading stage, respectively. All genotypes were sown in early November with adjacent plots in the field and each genotype consisted of 2-m-length row with 0.25 m between rows. Other field management was the same as applied locally. The fourth field trial was conducted at Forthside Vegetable Research Station (FVRS), Tasmania, Australia in 2007–2008 growing season. Each line was grown in a 2-m row plot with 0.4 m between rows. All agronomic management methods, including fertilization, weed and disease control, were in accordance with local practice.
Harvested grains were stored in a cool room at 4uC and were mixed and milled to pass through a 0.5 mm screen before analysis.
Phytase activity assay
Phytase activity was analyzed according to the method reported previously [27,30]. Phytic acid sodium salt hydrate (Sigma P0109 from rice) was used as substrate. For quick measurement, the liberated phosphorus was determined spectrophotometrically (700 nm) with Varioskan Flash Multimode Reader (Thermo Fisher Scientific, Waltham, MA, USA) in 96-well plates. The phytase activity was expressed as the amount of liberated inorganic phosphorus from sodium phytate solution at pH 5.5 and 37uC (1 unit = 1mmol?min21).
QTL analysis
A genetic linkage map of Franklin/Yerong DH population was comprised of 496 DArT and 28 microsatellite markers [28]. QTLs were analyzed using the software package MapQTL5.0 [31]. QTLs were first analysed by interval mapping (IM). The closest marker at each putative QTL identified using interval mapping was selected as a cofactor and the selected markers were used as genetic background controls in the approximate multiple QTL model (MQM) of MapQTL5.0. Logarithm of the odds (LOD) threshold values applied to declare the presence of a QTL were estimated by performing the genome wide permutation tests with at least 1000 permutations of the original data set for the trait. Two LOD support intervals around each QTL were established, by taking the two positions, left and right of the peak, that had LOD values of two less than the maximum, after performing restricted MQM mapping which does not use markers close to the QTL. The percentage of variance explained by each QTL (R2) was obtained using restricted MQM mapping implemented with MapQTL5.0.
Protein purification
Protein was extracted and purified according to previous reports [32,33] with some modification. Five-hundred grams of barley flour (Franklin) was extracted with 2-L sodium acetate buffer (200 mM, with 5 mM Dithiothreitol, pH 5.0) for 1 h (stirred vigorously). The homogenate was centrifuged at 10000 g for 15 min, and the supernatant was collected for further concentration and enzyme activity measurements. The crude extract was used for ammonium sulfate precipitation at 50%–80% saturation and centrifuged at 10000 g for 15 min. The pellet was resuspended in 50 mM sodium acetate buffer (pH 5.0, with 20 mM CaCl2) and then dialyzed against the same buffer without CaCl2overnight. Insoluble material was removed by centrifugation.
The enzyme was further purified by chromatographic proce-dures. All chromatography was carried out on a compact liquid chromatography system (A¨ KTA primary plus, GE Healthcare, Sweden), sequentially with a cation-exchange column (HiTrap CM FF, 5 ml, GE Healthcare, Sweden), and a gel filtration column (HiPrep Sephacryl S-200 H, 16/60 mm, GE Healthcare, Sweden) following the manufacturers’ instructions. The protein solution filtrated through 0.22mm membrane was loaded onto a cation-exchange column at a flow rate of 5 mL min21 that was equilibrated with 100 ml of pH 5.0 50 mM sodium acetate buffer (SAB). The column was rinsed with 100 mL of SAB and subsequently eluted by applying a linear gradient of 0 to 500 mM NaCl in the buffer (100 mL) at the same flow rate. The fractions containing phytase activity were pooled and concentrated using an Amicon Centrifugal Filter Unit (Millipore, Bedford, MA, USA). The concentrated protein solution filtrated through 0.22mm membrane was then loaded onto a gel filtration column equilibrated with same buffer containing 150 mM NaCl. Protein was eluted at a flow rate of 0.5 mL min21 and the fractions containing phytase activity were pooled. The purified protein was concentrated and stored at280uC for further assays.
Eluted proteins were separated on one-dimensional 10% (w/v) SDS-PAGE and visualized by silver staining method [34]. A protein molecular weight standard was run in parallel to estimate the approximate molecular weights of the proteins separated.
Protein identification
against theHordeum vulgareprotein database at NCBI (http://www. ncbi.nlm.nih.gov) using the SEQUEST algorithm incorporated into the BioWorks software (Version 3.2, Thermo Finnigan, San Jose, CA, USA).
Protein determination
The protein content of the extracts was measured using a Bradford assay Kit (Bio-Rad Labs, Hercules, CA, USA) according to manufacturer’s instructions, with bovine serum albumin as standard.
DNA extraction, PCR amplification, and sequencing Total genomic DNA was extracted from barley seedlings using Universal Genomic DNA Extraction Kit Ver.3.0 (TaKaRa Bio, Tokyo, Japan) as described previously [36]. Based on the cDNA sequences of Purple Acid Phosphatase retrieved from the NCBI database (HvPAP a: FJ974003 and HvPAP b: FJ974005, direct submitted by Dr. Dionisio in Aarhus University, Denmark), PCR primers were designed with the Primer 5.0 (File S1). Each 25ml amplification reaction consisted of 2.5ml 106TransTaqHiFi Buffer
I (200 mM Tris-HCl (pH 8.4), 200 mM KCl, 100 mM (NH4)2SO4, 20 mM MgCl2), 2ml 2.5 mM dNTPs, 2ml 10mM primers, 0.5ml 5 unitml21
ofTransTaqpolymerase High Fidelity (Beijing TransGen Biotech, Beijing, China), and 1ml 50 ng of genomic DNA. All amplifications were performed on a DNA Engine Dyad thermal cycler (Bio-Rad Labs, Hercules, CA, USA). After the PCR product was purified, DNA sequencing was performed on an ABI 3730XL sequencer following the manufac-turer’s instructions (Applied Biosystems, Framingham, MA, USA). All results were conducted with two independent PCR products which have been deposited in the GenBank at NCBI (JF274704, JF274705).
Statistical analysis
Each measurement was carried out with at least three replications. Statistical analysis was carried out by SPSS v13.0
for windows (SPSS Inc, Chicago, Illinois, USA).
Results
Phytase property of Yerong and Franklin
The phytase activity of Yerong and Franklin was determined after 0.5, 1.0, 1.5, 2.0 and 2.5 h incubation with substrate. Phytase in Franklin flour showed significantly higher activity after 1.0 h incubation. In contrast, incubation time had less effect on the phytase activity of Yerong flour (Fig. 1). The greatest difference in phytase activity between Franklin (1167.4 U?kg21) and Yerong
(565.2 U?kg21) was found after 1 h incubation, thus this protocol
was used in all further determinations.
To determine the similarity of phytase performance from Yerong and Franklin, mixed flour samples were prepared in different ratios (File S1). The predicted values of phytase activity were calculated according to the proportion of Yerong and Franklin. As shown in File S1, phytase activity of the mixed samples showed very close correlation with predicted values, suggesting the phytase in both Yerong and Franklin had similar performance in phytate degradation.
Phenotypic variation among the DH lines of Franklin/ Yerong
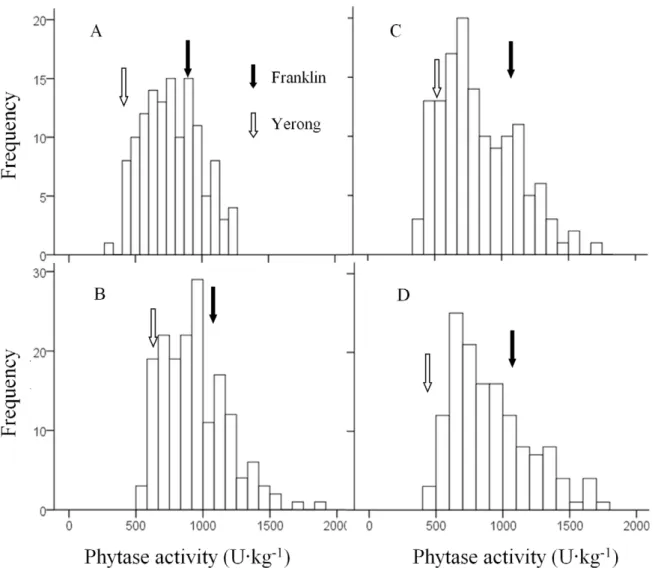
The distributions of phytase activity of the DH lines were shown in Fig. 2. Normal distributions were found for the samples from all different sites or treatments with no significant skewness and
kurtosis. Transgression beyond the parental values was observed in all four sites or treatments. The coefficients of variation were similar among different sites or treatments (27.7, 25.9, 34.7 and 32.4 for ZUH, FVRS, ZUH-HN and ZUH-LN, respectively). The average phytase activity of DH lines were 774.1 U?kg21,
940.3 U?kg21, 825.9 U?kg21and 910.0 U?kg21for ZUH, FVRS,
ZUH-HN and ZUH-LN, respectively. Samples from FVRS showed significantly higher phytase activity than those from other sites/treatments. High N treatment caused a significant reduction in phytase activity.
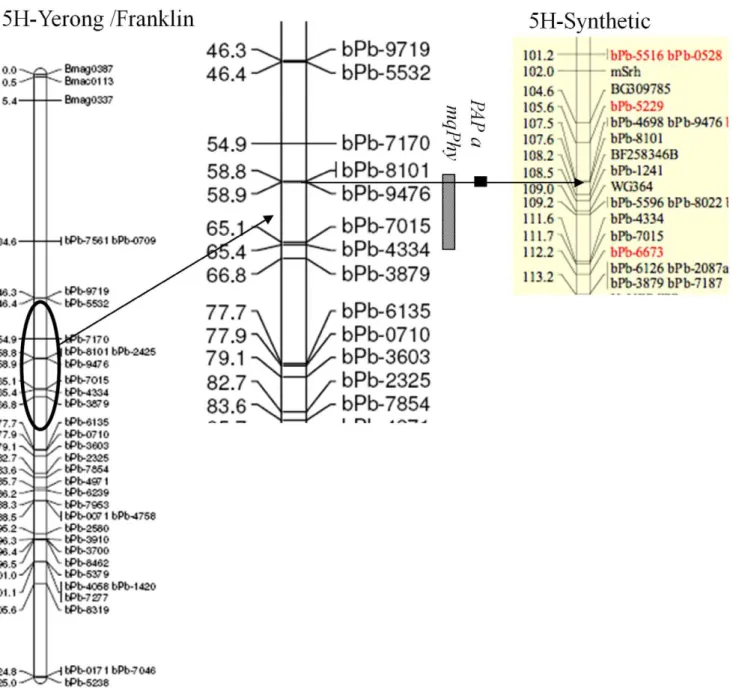
Identification of QTLs associated with phytase activity One QTL controlling phytase activity in barely grains was found on chromosome 5 H in both ZUH (qPhy1.1) and ZUH-HN (qPhy3.1) trials (Table 1) with the nearest marker being bPb-4334 and bPb-9476, respectively. The two-lod support intervals for the QTL detected in both trials were 58–67 cM. Two QTLs (qPhy2.2, and qPhy4.2) were identified in the other two trials. The major QTL was located at the same position as that identified in the ZUH and ZUH-HN trials, with the same 2-lod support intervals and bPb-9476 being the nearest marker. The minor QTL identified from both FVRS and ZUH-LN was located on chromosome 1 H with the 2-lod support intervals being around 44–76 cM. The major QTL identified from all the trials explained 30–47% of the phenotypic variation, indicating that the QTL in 5 H may be attributed to a gene controlling phytase activity in barely grains. This gene in the region was named as mqPhy
(Table 1).
Purification and identification of phytase
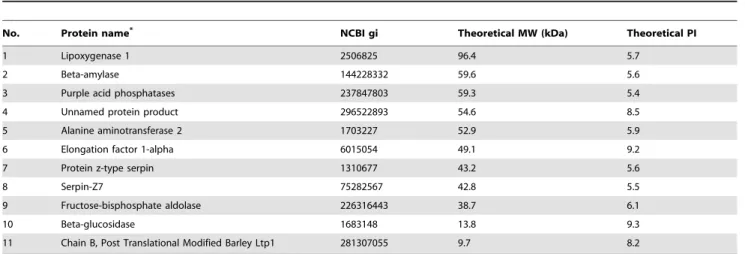
Phytase was purified from barley grains using three consecutive purification steps: selective precipitation with ammonium sulfate (50%–80%), a cation-exchange and a gel filtration column chromatography. The purification procedures of protein samples are illustrated in File S1. The phyase activity of the protein fraction at each step was determined with phytate as substrate. The fractions containing phytase activity were combined and used in the next steps. After the three-step purification, the phytase protein had been purified approximately 100-fold with an overall recovery of 10.1%, exhibiting a specific phytase activity of 3084.7 mU mg21protein (File S1).
The purified phytase solution (PPS) was fractionated by one-dimensional SDS-PAGE (10%). Two large polypeptide bands were detected by silver staining (File S1), approximately 60 and 45 kDa, respectively. The results suggested that there were Figure 1. Effect of incubation time on phytase activity in Yerong and Franklin flours.
several other proteins with similar properties as phytase in PPS. Thus LC-MS/MS spectrometry method was employed to indentify the proteins in PPS. The results showed that there were 11 groups of protein in the sample (Table 2). Interestingly,
only one group of protein, identified by MASS spectrometry method (No. 3 in table 2), showed phytase activity according to NCBI protein database (http://www.ncbi.nlm.nih.gov), which was named as purple acid phosphatase (PAP).
Figure 2. Frequency distribution for phytase activity in a DH population of Yerong/Franklin.A: the farm of Zhejiang University, Huajiachi campus (ZUH) in 2008–09 gorwing season; B: Forthside Vegetable Research Station (FVRS) in 2007–08 growing season; C and D: ZUH in 2009–10 growing season with High-Nitrogen (HN) and Low-Nitrogen (LN) application, respectively.
doi:10.1371/journal.pone.0018829.g002
Table 1.QTLs for phytase activity in the DH population of Yerong/Franklin.
Site/Treatment QTL Chr. Marker intervals Nearest marker Position (cM) LOD R2(%)
ZUH qPhy1.1 5 H 58–67 bPb-4334 65.4 9.78 29.5
FVRS qPhy2.1 1 H 44.8–76 bPb-9334 56.6 2.95 4.8
qPhy2.2 5 H 58–66 bPb-9476 58.9 17.45 35.0
ZUH-HN qPhy3.1 5 H 58–66 bPb-9476 58.9 20.58 46.6
ZUH-LN qPhy4.1 1 H 44–60 Bmag0090 51.6 5.2 8.7
qPhy4.2 5 H 58–66 bPb-9476 58.9 19.41 41.9
Marker intervals are 2-lod support intervals around each QTL; the position is that of the nearest marker; R2means percentage genetic variance explained by the nearest marker; FVRS: Forthside Vegetable Research Station; ZUH: farm of Zhejiang University, Huajiachi campus; HN and LN: High-Nitrogen and Low-Nitrogen application, respectively.
Sequencing and gene structure ofHvPAP aandHvPAP b
A NCBI database search revealed the presence of several cDNA for PAPs in barley. There are four isoforms of PAP genes in barley;HvPAP a, HvPAP b1 and b2, and HvPAP c. HvPAP c
supposed to be expressed in chloroplasts. Thus, cDNA ofHvPAP aandHvPAP bwas selected for whole genome analysis (File S1). Since the primers used for sequencing both HvPAP b1 and b2 were the same, we will only use the term HvPAP b for both
HvPAPb1 and b2 in this paper. The sequences of bothHvPAP a
and HvPAP b were obtained from NCBI database. Polymerase chain reaction (PCR) primers were designed based on these cDNA sequences (File S1). Sequence data of Yerong and Franklin were obtained from three (P1–1, P1–2 and P1–3) and two (P2–1 and P2–2) DNA fragments amplified using separate PCR reactions for HvPAP a and HvPAP b, respectively. Those two PAP genes in barley were highly homologous. Exon 2, 4 and 5 of
HvPAP aand exon 2, 5 and 6 ofHvPAP bshared the same length (Fig. 3). The exon 3 of HvPAP ashared the same length as the combination of exon 3 and 4 ofHvPAP b, which was separated by intron 3 ofHvPAP b.
The whole length of 2285 bp genomic DNA sequences of Franklin forHvPAP awas assembled (Genebank: JF274704), which consisted of five exons separated by four introns (Fig. 3). Six single nucleotide polymorphisms (SNPs) in the coding region were found between Yerong and Franklin (Fig. 3). All six base substitutions detected in the coding region were synonymous for the candidate genes in this study. More diversity was found in non-coding regions including SNPs and Indels between Yerong and Franklin (File S1).
A partial length of 1950 bp genomic DNA sequence forHvPAP bwas assembled (Genebank: JF274705), without the first 21 and last 95 bp of cDNA. Six exons were separated by five introns for
HvPAP bin the present results (Fig. 3). It seems that theHvPAP b
gene is highly conserved in barley. Nucleotide sequence between Yerong and Franklin was identical, except for a synonymous SNP which was identified in exon 1 (Fig. 3).
Physic mapping ofHvPAP aandHvPAP b
P1–4 primer, designed according to a SNP in exon3 ofHvPAP a
with a G/C substitution, was used to genotype 83 DH lines randomly selected from the Franklin/Yerong DH population, and P2–3 primer, designed according toaSNP in exon1 ofHvPAP b
with a T/C substitution, was used to genotype 117 DH lines from the same population (File S1, Fig. 4). No PCR product was obtained from Franklin for HvPAP a, and no HvPAP b from Yerong. HvPAP b was mapped to the chromosome 3 H at a position of 54.1 cM, proximal to marker Bmag0006.HvPAP awas mapped to the chromosome 5 H at position of 58.9 cM, proximal to marker bPb-9476 (Fig. 5), which was at the same position as the main QTL for phytase activity (mqPhy). The results of physical mapping provide the clear evidence to support the colinearity between theHvPAP aandmqPhy.
Discussion
Phytases are widespread in nature, including microbes, plants and animal tissues. Various phytases have been isolated from plants, mainly grouped to acid phytase based on their pH optima, with an optimal pH at 4.5–6.0 [5,37]. Some plant phytases are found to be purple acid phosphatases, and displayed optimal pH at 4.5–5.0 [23]. Phytases that catalyse the step-wise release of phosphate from phytate in plants usually show a very broad substrate specificity and a rather high affinity for phytate [5,38]. It is suggested that phytases with broad substrate specificity are better suited for animal nutrition purposes than phytases with narrow substrate specificity [39]. A widely used method for estimation of phytase activity is to incubate the sample with phytate and estimate the phytase activity by determining released inorganic phosphorus, which can also be performed on crude extracted phytases [8,27,30,40]. This method was employed in all the experiments in the current study.
Barley germplasm showed a wide genetic variation in phytase activity [27]. Based on our previous screening results, two barley genotypes, Yerong and Franklin, were used in the present study. Franklin showed much higher phytase activity than Yerong (Fig. 1). The results from samples with different ratios of Yerong and Franklin flours (File S1) showed that no other factors affected the phytase performance in barley grains when phytate was used as substrate. Different trial sites and/or N treatment also showed significant effects on phytase activity. High N treatment showed significant reduction in phytase activity, which may be related to the higher average protein content (86.8 mg?g21) caused by the
higher rate of N application compared to the average protein content of 77.4 mg?g21 where a low rate of N was applied.
Samples from FVRS showed the highest phytase activity, which
Table 2.Proteins identified by the LC-MS/MS analysis in purified phytase solution.
No. Protein name* NCBI gi Theoretical MW (kDa) Theoretical PI
1 Lipoxygenase 1 2506825 96.4 5.7
2 Beta-amylase 144228332 59.6 5.6
3 Purple acid phosphatases 237847803 59.3 5.4
4 Unnamed protein product 296522893 54.6 8.5
5 Alanine aminotransferase 2 1703227 52.9 5.9
6 Elongation factor 1-alpha 6015054 49.1 9.2
7 Protein z-type serpin 1310677 43.2 5.6
8 Serpin-Z7 75282567 42.8 5.5
9 Fructose-bisphosphate aldolase 226316443 38.7 6.1
10 Beta-glucosidase 1683148 13.8 9.3
11 Chain B, Post Translational Modified Barley Ltp1 281307055 9.7 8.2
may be due to the low protein content of the grains [41]. The low phosphorus content in Forthside soil which has very high P fixing capacity could also cause an elevated phytase activity as phytase is used to maintain adequate available P for growth of the plants with P deficient [42].
There have been no reports on QTLs controlling barley phytase activity (Gramene, http://www.gramene.org/qtl/). In the current study, a major QTL of phytase activity with high LOD score was identified in all four different sites/treatments. This QTL was located on chromosome 5 H with 2-LOD support intervals of 58– 67. The gene controlling phytase activity was named asmqPhy. The position of this gene was at an equivalent position of 97.9 on the consensus map [43] (Fig. 5). A minor QTL on barley chromosome 1 H was also found in FVRS and ZUH-LN (Table 1), both sites showing low grain protein content. Since there is no significant correlation between phytase activity and protein content in barley grains [27], the small effect QTL in chromosome 1 H may be involved in low-level-N response. Further research is needed to clarify the effect of nitrogen application on phytase gene expression and enzyme activity. The small effect QTL could also be responsible to the transgressive segregation of progeny lines with higher or lower phytase activity than either parent being observed in different sites and/or N treatments. The additive effects from different QTLs could be beneficial in developing high phytase activity lines in barley.
Several phytases have been isolated from oat, spelt, maize, and barley [13,16,17]. One of them (P2) was identified as a constitutive enzyme, whereas the other one (P1) was induced during germination in barley [13]. The major difficulty encountered in phytase purification especially from plant sources is the separation of phytase from contaminating nonspecific acid phosphatases [44]. Since acid phosphatases are not capable of degrading phytate, the test of phytase activity is usually done with phytate as a substrate
[13], which was used in the present study. Even though the purified phytase showed relative high activity (File S1), only a limited amount of phytase protein was obtained and it was still contaminated with several other proteins in PPS according to the SDS-PAGE examination (File S1). The MASS results showed that there were several groups of proteins (e.g. protein No. 2 named beta-amylase and No. 5 named alanine aminotransferase) with similar MW and PIto the phytase in PPS (Table 2). Only one group of proteins, purple acid phosphatase (PAP), which has phytase activity according to NCBI protein database (Table 2) was identified in this study, indicating that PAPs may play an important role as phytase in barley. The results are different from those previously reported by Dionisio,et al.[19], who suggested that the MINPPs should constitute an important part of the endogenous phytase potential in barley.
Purple acid phosphatases (PAPs) catalyze the hydrolysis of a wide range of activated phosphoric acid monoesters, diesters and anhydrides [45]. The adaptation of PAPs to degrade phytate may be a unique case in plants, although not all PAPs exhibit phytase activity [37]. Some PAP members can hydrolyze phytate to release inorganic phosphorus to be used in the germination of seed and pollen [33]. Several PAPs with phytase activity have been identified in soybean, tobacco andArabidopsis[21,23,33].
A NCBI database search revealed the presence of several cDNA for PAPs in barley. Similar cDNA sequences are also available for wheat,Arabidopsis, rice and maize. However, there is no report on the structure and location of PAPs in barley. In the current study, cDNA ofHvPAP aandHvPAP bwas selected for whole genome analysis (File S1). Seven base substitutions were detected in the coding region which was synonymous for the two candidate genes, indicating that the difference of phytase activity between Yerong and Franklin may be attributed to the expression of those two genes instead of protein structure. Further studies are Figure 3. Gene structure and diversity ofHvPAP aandHvPAP bin barley, with exons (boxes), introns (thin lines) and SNPs (arrows) found between Yerong and Franklin.Those two genes were based on the sequences of Franklin. ForHvPAP a(Genebank: JF274704), the length of intron 2 and 3 was 105 and 109 bp for Yerong, respectively. The synonymous substitutions ofHvPAP awere CAC/CAT, TAC/TAT, TCA/TCG, GAA/ GAG, ACG/ACC and GTT/GTC from left to right for Franklin/Yerong, respectively. ForHvPAP b(Genebank: JF274705), only part of exon1 and exon6 was sequenced for both cultivars with the synonymous substitution being CCT/CCC for Franklin/Yerong.
doi:10.1371/journal.pone.0018829.g003
currently underway to determine the gene expression of PAPs in barley.
The comparison of DNA sequences from the two parent varieties revealed only one single nucleotide substitution ofHvPAP b(Fig. 4). Similar results were found when comparing six barley genotypes, including three Tibetan annual wild barleys, with only one SNP in exon 1 and other two in non-coding region (data not shown). Mapping of this SNP was located in barley chromosome 3 H, which didn’t co-locate with any QTLs controlling phytase activity found in this study.HvPAP awas mapped to chromosome 5 H and at the same position where themqPhycontrolling phytase activity was located (Fig. 5).
In conclusion, a gene controlling phytase activity in barley was mapped to chromosome 5 H, and the phytase protein was purified
from barley grains and identified as PAPs. Moreover, the gene
HvPAP awas mapped to the same location. The current results will be helpful for barley breeders in developing new barley varieties with high phytase activity.
Supporting Information
File S1 Supporting figures and tables. (DOCX)
Author Contributions
Conceived and designed the experiments: FD. Performed the experiments: FD LQ LY DW. Analyzed the data: FD MZ. Contributed reagents/ materials/analysis tools: FD. Wrote the paper: FD MZ GZ.
Figure 5. Quantitative trait loci (QTLs) identified for plant phytase activity in the DH population of Yerong/Franklin.This figure is for chromosome 5 H (Li et al., 2008). Part of synthetic map (Alsop et al., 2011) was added to the right for comparison. Arrows point out the position of closest DArT markers formqPhyandHvPAP agenes in two different maps.
References
1. Kumar V, Sinha AK, Makkar HPS, Becker K (2010) Dietary roles of phytate and phytase in human nutrition: A review. Food Chemistry 120: 945–959. 2. Ockenden I, Dorsch JA, Reid MM, Lin L, Grant LK, et al. (2004)
Characterization of the storage of phosphorus, inositol phosphate and cations in grain tissues of four barley (Hordeum vulgare L.) low phytic acid genotypes. Plant Science 167: 1131–1142.
3. Bilgicli N, Elgun A, Turker S (2006) Effects of various phytase sources on phytic acid content, mineral extractability and protein digestibility of tarhana. Food Chemistry 98: 329–337.
4. Rickard SE, Thompson LU (1997) Interactions and biological effects of phytic acid. Antinutrients and Phytochemicals in Food 662: 294–312.
5. Konietzny U, Greiner R (2002) Molecular and catalytic properties of phytate-degrading enzymes (phytases). International Journal of Food Science and Technology 37: 791–812.
6. Sandberg AS, Andersson H (1988) Effect of dietary phytase on the digestion of phytate in the stomach and small intestine of humans. Journal of Nutrition 118: 469–473.
7. Greiner R, Konietzny U (2006) Phytase for food application. Food Technology and Biotechnology 44: 125–140.
8. Bergman EL, Autio K, Sandberg AS (2000) Optimal conditions for phytate degradation, estimation of phytase activity, and localization of phytate in barley (cv. Blenheim). Journal of Agricultural and Food Chemistry 48: 4647–4655. 9. Brune M, Rossanderhulten L, Hallberg L, Gleerup A, Sandberg AS (1992) Iron
absorption from bread in humans: Inhibiting effects of cereal fiber, phytate and inositol phosphates with different numbers of phosphate groups. Journal of Nutrition 122: 442–449.
10. Larsson M, RossanderHulthen L, Sandstrom B, Sandberg AS (1996) Improved zinc and iron absorption from breakfast meals containing malted oats with reduced phytate content. British Journal of Nutrition 76: 677–688.
11. Rao DECS, Rao KV, Reddy TP, Reddy VD (2009) Molecular characterization, physicochemical properties, known and potential applications of phytases: an overview. Critical Reviews in Biotechnology 29: 182–198.
12. Vats P, Banerjee UC (2005) Biochemical characterisation of extracellular phytase (myo-inositol hexakisphosphate phosphohydrolase) from a hyper-producing strain of Aspergillus niger van Teighem. Journal of Industrial Microbiology & Biotechnology 32: 141–147.
13. Greiner R, Jany KD, Alminger ML (2000) Identification and properties of myo-inositol hexakisphosphate phosphohydrolases (Phytases) from barley (Hordeum vulgare). Journal of Cereal Science 31: 127–139.
14. Tye AJ, Siu FKY, Leung TYC, Lim BL (2002) Molecular cloning and the biochemical characterization of two novel phytases from subtilis 168 and B-licheniformis. Applied Microbiology and Biotechnology 59: 190–197. 15. Cosgrove DJ (1970) Inositol phosphate phosphatases of microbial origin. Inositol
phosphate intermediates in the dephosphorylation of the hexaphosphates of myo-inositol, scyllo-inositol, and D-chiroinositol by a bacterial (Pseudomonas sp.) phytase. Australian Journal of Biological Sciences 23: 1207–1220. 16. Greiner R, Alminger ML (1999) Purification and characterization of a
phytate-degrading enzyme from germinated oat (Avena sativa). Journal of the Science of Food and Agriculture 79: 1453–1460.
17. Laboure AM, Gagnon J, Lescure AM (1993) Purification and characterization of a phytase (myo-inositolhexakisphosphate phosphohydrolase) accumulated in maize (Zea mays) seedlings during germination. Biochemical Journal 295: 413–419.
18. Greiner R, Muzquiz M, Burbano C, Cuadrado C, Pedrosa MM, et al. (2001) Purification and characterization of a phytate-degrading enzyme from germinated faba beans (Vicia faba var. Alameda). Journal of Agricultural and Food Chemistry 49: 2234–2240.
19. Dionisio G, Holm PB, Brinch-Pedersen H (2007) Wheat (Triticum aestivum L.) and barley (Hordeum vulgare L.) multiple inositol polyphosphate phosphatases (MINPPs) are phytases expressed during grain filling and germination. Plant Biotechnology Journal 5: 325–338.
20. Cashikar AG, Rathinam K, Rao NM (1997) Biochemical characterization and subcellular localization of the red kidney bean purple acid phosphatase. Plant Physiology 114: 907–915.
21. Lung SC, Leung A, Kuang R, Wang Y, Leung P, et al. (2008) Phytase activity in tobacco (Nicotiana tabacum) root exudates is exhibited by a purple acid phosphatase. Phytochemistry 69: 365–373.
22. Olczak M, Morawiecka B, Watorek W (2003) Plant purple acid phosphatases-genes, structures and biological function. Acta Biochimica Polonica 50: 1245–1256.
23. Hegeman CE, Grabau EA (2001) A novel phytase with sequence similarity to purple acid phosphatases is expressed in cotyledons of germinating soybean seedlings. Plant Physiology 126: 1598–1608.
24. Baik BK, Ullrich SE (2008) Barley for food: characteristics, improvement, and renewed interest. Journal of Cereal Science 48: 233–242.
25. Zhou MX (2008) Barley production and consumption. In: Zhang GP and Li CD, eds. Genetics and improvement of barley malting quality. The Springer Press, 1–17.
26. Dai F, Wang JM, Zhang SH, Xu ZZ, Zhang GP (2007) Genotypic and environmental variation in phytic acid content and its relation to protein content and malt quality in barley. Food Chemistry 105: 606–611.
27. Dai F, Qiu L, Xu Y, Cai SG, Qiu BY, et al. (2010) Differences in Phytase Activity and Phytic Acid Content between Cultivated and Tibetan Annual Wild Barleys. Journal of Agricultural and Food Chemistry 58: 11821–11824. 28. Li HB, Vaillancourt R, Mendham N, Zhou MX (2008) Comparative mapping
of quantitative trait loci associated with waterlogging tolerance in barley (Hordeum vulgare L.). Bmc Genomics 9.
29. Wang JM, Chen JX, Dai F, Wu FB, Yang JM, et al. (2007) Protein fractions in barley grains as affected by some agronomic factors and their relationships to malt quality. Cereal Research Communications 35: 129–140.
30. Centeno C, Viveros A, Brenes A, Canales R, Lozano A, et al. (2001) Effect of several germination conditions on total P, phytate P, phytase, and acid phosphatase activities and inositol phosphate esters in rye and barley. Journal of Agricultural and Food Chemistry 49: 3208–3215.
31. Van Ooijen JW, Kyazma BV (2004) MapQTLH5 Software for the mapping of quantitative trait loci in experimental populations. Wageningen, The Netherland. 32. Hubel F, Beck E (1996) Maize root phytase-Purification, characterization, and localization of enzyme activity and its putative substrate. Plant Physiology 112: 1429–1436.
33. Kuang RB, Chan KH, Yeung E, Lim BL (2009) Molecular and Biochemical Characterization of AtPAP15, a Purple Acid Phosphatase with Phytase Activity, in Arabidopsis. Plant Physiology 151: 199–209.
34. Wray W, Boulikas T, Wray VP, Hancock R (1981) Silver staining of proteins on polyacrylamide gels. Analytical Biochemistry 118: 197–203.
35. He P, He HZ, Dai J, Wang Y, Sheng QH, et al. (2005) The human plasma proteome: Analysis of Chinese serum using shotgun strategy. Proteomics 5: 3442–3453.
36. Qiu L, Wu DZ, Shafaqat A, Cai SG, Dai F, et al. ( 2011) Evaluation of salinity tolerance and analysis of allelic function of HvHKT1 and HvHKT2 in Tibetan wild barley. Theoretical and Applied Genetics 122: 695–703.
37. Lei XG, Porres JM, Mullaney EJ, Brinch-Pedersen H (2007) Phytase: source, structure, and application. In: Polaina J, Maccabe AP, eds. Industrial Enzymes: Structure, Function and Applications. New York: Springer. pp 505–529. 38. Vohra A, Satyanarayana T (2003) Phytases: Microbial sources, production,
purification, and potential biotechnological applications. Critical Reviews in Biotechnology 23: 29–60.
39. Wyss M, Brugger R, Kroenberger A, Remy R, Fimbel R, et al. (1999) Biochemical characterization of fungal phytases (myo-inositol hexakisphosphate phosphohydrolases): Catalytic properties. Applied and Environmental Microbi-ology 65: 367–373.
40. Centeno C, Viveros A, Brenes A, Lozano A, Cuadra Cdl (2003) Effect of several germination conditions on total P, phytate P, phytase, acid phosphatase activities and inositol phosphate esters in spring and winter wheat. Journal of Agricultural Science 141: 313–321.
41. Wang JM, Yang JM, McNeil D, Zhou MX (2010) Mapping of quantitative trait loci controlling barley flour pasting properties. Genetica 138: 1191–1200. 42. Kouas S, Debez A, Plassard C, Drevon JJ, Abdelly C (2009) Effect of phosphorus
limiting on phytase activity, proton efflux and oxygen consumption by nodulated-roots of common bean (Phaseolus vulgaris). African Journal of Biotechnology 8: 5301–5309.
43. Wenzl P, Li HB, Carling J, Zhou MX, Raman H, et al. (2006) A high-density consensus map of barley linking DArT markers to SSR, RFLP and STS loci and agricultural traits. Bmc Genomics 7.
44. Konietzny U, Greiner R, Jany KD (1995) Purification and characterization of a phytase from spelt. Journal of Food Biochemistry 18: 165–183.