* Corresponding author. Tel: 09122442633
E-mail addresses: [email protected] (M. A. Afsharkazemi) © 2012 Growing Science Ltd. All rights reserved. doi: 10.5267/j.msl.2012.02.006
Contents lists available atGrowingScience
Management Science Letters
homepage: www.GrowingScience.com/msl
Applying fuzzy analytic network process in quality function deployment model
Mohammad Ali Afsharkazemi*, Mahboubeh Khodabakhsh and Mohammad Reza Motadel
Department of Management, Islamic Azad University, Central Branch, Tehran, Iran
A R T I C L E I N F O A B S T R A C T
Article history: Received October 1, 2011 Received in Revised form November, 14, 2011 Accepted 30 January 2012 Available online 19 February 2012
In this paper, we propose an empirical study of QFD implementation when fuzzy numbers are used to handle the uncertainty associated with different components of the proposed model. We implement fuzzy analytical network to find the relative importance of various criteria and using fuzzy numbers we calculate the relative importance of these factors. The proposed model of this paper uses fuzzy matrix and house of quality to study the products development in QFD and also the second phase i.e. part deployment. In most researches, the primary objective is only on CRs to implement the quality function deployment and some other criteria such as production costs, manufacturing costs etc were disregarded .
The results of using fuzzy analysis network process based on the QFD model in Daroupat packaging company to develop PVDC show that the most important indexes are being waterproof, resistant pill packages, and production cost. In addition, the PVDC coating is the most important index in terms of company experts’ point of view.
© 2012 Growing Science Ltd. All rights reserved. Keywords:
Quality Function Deployment (QFD)
Fuzzy Analytic Network Process (FANP)
Product planning Part expanding
1. Introduction
In a global perspective, competition is the primary concern for most organizations since they production must be accomplished with lower costs and higher quality. On the other hand, it is also important to know how to rapidly respond to variable customer requirements (Liu & Wang, 2010). Industries should seek new products and services for dynamic development (Farsjani, 2002) and most industries have experienced complex problems by introducing new or modified products, which are not acceptable to customers. It is clear that even if an organization is capable of providing good quality products or services, it is still necessary to meet customer requirements (CRs), properly. In fact, customer expectations tend to change when they face with new rival products and services (Day, 1993). Continuous improvement is achieved based on technical initiatives and customer requirements and understanding CRs leads to a successful product. Therefore, one of the organization's strategic goals is to design the PTRs or design requirements carried out by a design team (Kahrama et al., 2006).
Development (QFD) is considered one of the techniques aiming to obtain customer satisfaction based on the product phase of development (Karasak et al., 2002).
There are two fuzzy approaches in using quality function deployment. In the traditional QFD and evaluation phase, data value will be supposed critically. However, to resolve some problems in the critical issue, such as creating link between the customer voice and technical requirements or determining the relation between technical requirements or the internal relation in customer voice normally based on subjective methods, utilizing the fuzzy QFD method and language variables are considered (Khou & Hou, 1996; Chen et al., 1999).
Regarding the importance of QFD, this research attempts to study all internal effects in decision making in the fuzzy environment, and to obtain customer satisfaction besides meeting their variable requirements. The main issue in this research is to develop quality function deployment and to obtain complete and precise information using decision making techniques.
2. Research Background
There are literally numerous researches conducted based on QFD application technique. Some people presented a method to determine technical requirements preferences, where CRs and their relationships with technical requirements are given by triangular fuzzy numbers based on relative importance and human justifications. To calculate the preferences, this relationship has been calculated through fuzzy weighted average. Therefore, the fuzzy preferences become clear numbers such that the higher values showed higher preferences. Some people used hierarchical analysis to determine the importance of functional assets. There are works, which provided a fuzzy QFD framework to utilize in the analysis of quality function deployment using symmetrical triangular fuzzy numbers based on cohesion matrix between customer preferences and their desires. Of course, they did not include competitive analysis in their framework.
Some people utilized the technical requirements rating algorithm to rate customer desires and assessed the customers’ necessary weights and proposed the market and sale terms using triangular fuzzy numbers based on customer satisfaction. There are some other works, which a combined system from QFD, AHP and fuzzy set theory to determine design goals. Chan et al. (1999a-b) also used the symmetrical triangular fuzzy numbers in analyzing the customers’ voice. Hence, their studies did not include technical requirements or designers and engineers’ voice. Wang (1999) has provided a fuzzy extra rating approach to prioritize the technical requirements. Kim et al. (2000) provided a fuzzy regression model to calculate quality function deployment parameters. Shen (2001) also provided a fuzzy method to test the rating sensitivity of technical requirements, diffuzification and also the fuzzy degree of fuzzy numbers.
Sohn and Choi (2001) provided a fuzzy approach to find the best level of design variables. Yang et al. (2003) utilized a fuzzy set theory and combined it with quality house matrix to determine design and manufacturing requirements in building construction.
Chen and Wang (2006) offered a fuzzy goal programming model regarding variable goals such as cost, technical problems and other goals verbally along meeting the customers’ desires. Büyüközkan et al. (2007) offered a fuzzy group decision making model to combine multiple preferences and priorities in response to CRs in product development in the QFD process.
Lee et al. (2008) determined the weights of CRs using the KANO model comparison with fuzzy method in quality function deployment. The proposed method is the only way to increase customer loyalty.
As we can see, all these attempts are aimed at prioritizing the customers’ desires and technical requirements. If we regard the quality function deployment analysis process as a decision making issue, we can formulate it as a network analysis process. The following studies have been carried out in this scope.
Karsak et al. (2002) presented QFD development using a hybrid model based on analytical network planning (ANP) and goal planning. Buyukozkan et al. (2004) used fuzzy group decision making for the implementation of QFD. Eraty et al. (2005) presented an extended QFD based on adaptation of ANP and language data. Kahraman et al. (2006) used web analysis approach for QFD implementation. Some people proposed a new zero-one programming to handle QFD implementation. Liu and Wang (2010) used fuzzy ANP in a new QFD model.
2.1.Quality Function Deployment
Quality function deployment is a planning tool based on customer desire. In this method, voice of the customer is used for product planning and stage designing (Liu & wang, 2010). This tool is a development process and a complex management processes, which requires multi-functional groups by gathering feedbacks from various groups (Cheng et al., 2004). In fact, quality function is a tool to facilitate using the concurrent engineering process and team work in order to achieve common organizations’ goals in customers’ satisfaction.
Many papers have been written about production development based on market requirements using QFD. Major application of this method is in the machinery and electronics industries and in the aerospace industry. QFD basis stems in quality tables that were first used in 1972. QFD process is divided into four cohesive phases to meet CRs completely in design and production processes (Hauser & Clausing, 1998). These four stages are: Product Design Matrix (Quality House), Part Deployment Matrix, Process Design Matrix, and finally, the Production Design Matrix.
The first QFD is usually called House of Quality 49 (HOQ). Nowadays, in a competitive environment the house of quality is the key strategic tool where organizations implement to obtain product development goals based on CRs (Clausing, 1998).
This phase plays an important role in the QFD system. During this phase CRs are identified, and based on the production company’s competitive preferences, these requirements are then changed to PTRs to meet the requirements in question. According to Karsak et al. (2002), the following summarizes details of the seven components of the quality house,
1. Customer requirements (Whats): These requirements are known as customers’ voice,
norms, requirements and request quality.
2. Product technical requirements (Hows): These characters are known as design necessities, engineering requirements or replaced quality requirements. PTRs determine how a company can meet CRs which can be called “The organization’s voice”. CRs tell the organization “what to do”, while the technical requirements tell it “how to do it”.
3. The relative importance of customer requirements: After gathering and organizing data
about the customers’ voice, it should be prioritized. The importance of their voice based on customer opinion is given its own grade.
4. Relation matrix between customer requirements (whats) and technical characters
5. Internal connection matrix between customer requirements: This matrix includes the
relation between each pair of CRs (Whats). Some of these requirements are in one direction, but some are in the opposite direction, meaning that paying attention to one requirement may result in neglecting the other.
6. Internal connection matrix between product technical requirements: Here we have the
effect of technical requirements on each other. A favorable change on a requirement may have a negative effect on the other requirement.
7. Prioritize product technical characters and define aimed values: In fact, the quality house matrix shows the previous effects on product requirements. Here we have the final amount of each product requirement based on the QFD group agreement, and the final size of desired requirements in competitors’ products will be shown.
2.2. Analytical Network Process
Multi attribute decision making (MADM) is an approach to organize the information and to find a compromise solution among different conflicting decisions. These methods help form the decision matrix and compromise among opposite scales in assessing integral results (Wang, 2008). This method aims to obtain the solutions among available options such that more satisfaction is achieved in all assessing indexes. Different methods have been proposed in MADM literature; among the most important are AHP, ANP, ELECTERE, DEMATEL, SAW, PROMETHE and TOPSIS. ANP is more complete than AHP and allows the analysis of various issues having mutual relationship between components (Saaty, 2001). In this technique, we use the pair comparative matrix to find weights just as the AHP method utilizes pair matrices. Saaty developed a method named “Super Matrix” to calculate mutual weight (Saaty, 1996). In the Super Matrix, the effect of related component weights includes all options and components in a matrix.
The ANP Modeling process in decision making comprises of two phases: Forming a network diagram and defining component preferences. In the first phase, the decision making structure is shown as a network diagram. All component interactions are considered within this section.
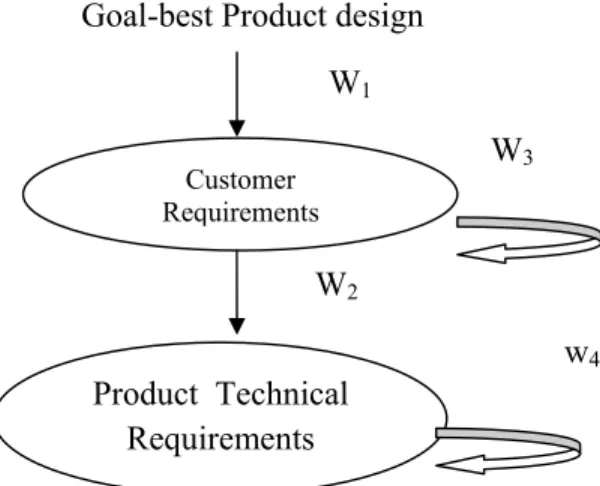
The network diagram introduces all clusters and components (goals, indexes, sub-indexes or options) in the decision making process and arrows depict component interactions. The arrow direction shows the effectiveness and dependence among components and shows generated interdependence for that node. In the QFD model, the goal of design is to produce the best product and indexes regarding CRs and PTRs. Fig. 1 represents the network diagram for quality function deployment models.
Goal-best Product design
W1
W3
W2
w4
Fig. 1. Network diagram based on the QFD framework Customer
Requirements
In Fig. 1, the objective impacts each customer requirement and CRs influences PTRs. They are interconnected, but there is no collision (for instance, CRs are not dependent to product requirements).
The super matrix for the QFD model is introduced as below:
1 3
2 4
0 0
G CRs PTRs CRs
W
PTRs ω ω
ω ω ⎡ ⎤ ⎢ ⎥ = ⎢ ⎥ ⎢ ⎥ ⎣ ⎦ ,
where ω1 is the objective vector and is introduced as a new product that can meet CRs. This vector
affects CRs (CRs), ω2 is a matrix, which shows the level of customer requirements (CRs) affecting on
each product technical requirement (PTR), ω3 and ω4 are matrices, which represent the
interconnection of customer requirements (CRs) and product technical requirements (PTRs).
2.3. Fuzzy set of numbers
Zadeh officially introduced fuzzy Logic in 1965 in a paper titled Fuzzy Sets. Being Fuzzy refers to different types of obscurity and unreliability specially obscurities, which are associated with human language and thought. Triangular and trapezoid fuzzy numbers are special form of Fuzzy LR numbers. In this paper, triangular fuzzy numbers are utilized, which are special forms of fuzzy sets. Following, we will proceed with defining fuzzy concepts
Fuzzy sets and determining membership degrees
In each fuzzy set, a degree of membership is determined for each member ranging from zero to one. This degree of membership is based on either mathematical functions, or expert opinion.
A fuzzy set if displayed as below:
( |:
[ ,1]
A
x x
μ
→
D
, (1)) X x : ) x ( , x {
A μA ∈ 2 . (2)
According to Kong and Lee (2007), the membership function of triangular fuzzy numbers is defines as follows,
0 otherwise
x
x a
a x b b a
c x
b x c c b μ − ⎧ ≤ ≤ ⎪ − ⎪ − ⎪ =⎨ − ≤ ≤ ⎪ ⎪ ⎪ ⎩ (3)
B. Mathematical operation on fuzzy numbers
Let Nand M be two triangular numbers and λbe a positive real number. According to Kong and Lee (2007), the following arithmetic operations are defined.
) c c , b b , a a ( M~
N~ + = 1+ 2 1+ 2 1+ 2 , (4)
) c c , b b , a a ( M~
N~ − = 1− 2 1− 2 1− 2 , (5)
) c c , b b , a a ( M~
) c , b , a (
M~ = λ× 2 λ× 2 λ× 2
+
λ , (7)
) c , b , a (
N~λ = 1λ 1λ 1λ . (8)
3. Introducing Research Model
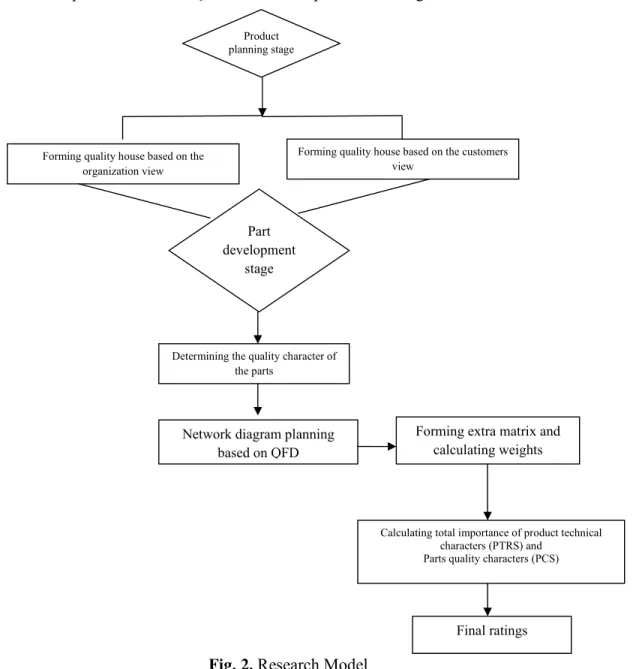
We can consider the present research model as Fig. 2. The basis of this model is to utilize fuzzy analytical network process based on QFD for research problem solving.
Fig. 2. Research Model
Step One: Product Planning
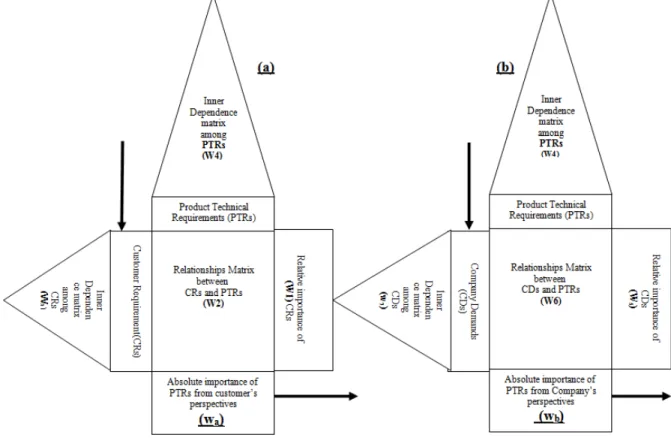
The QFD standard model utilizes different methods to improve product quality, among them Makabe is the most important. As we can see in Fig. 3, in the first phase (Part A), the matrix is the house of quality, the house of quality and the available relationships are formed to determine the CRs and then the PTRs in response to CRs. In part B, the house of quality and the relations are formed determining the company's Demands (CDs), and then the PTRs are formed in response to these requirements.
Network diagram planning based on QFD
Forming extra matrix and calculating weights
Forming quality house based on the customers view
Forming quality house based on the organization view
Part development
stage
Determining the quality character of the parts
Calculating total importance of product technical characters (PTRS) and
Parts quality characters (PCS)
Final ratings
In most studies on implementing QFD, the focus was on CRs and organization requirements such as production costs, manufacturing costs etc. were neglected. Although, focusing on CDs based on CRs has a strong role in developing and determining PTRs, therefore in part B, the house of quality is formed based on organization requirements (Liu & Wang, 2010).
Fig .4. Product planning phase
step Two: Part Deployment Phase
The second phase known as part deployment is in fact the second stage of the Makabe matrix. In this phase, the Part characteristics (PCs) are determined based on previously identified technical requirements. In this phase, the goal is to determine critical parts, numbers and part characteristics. The organizational team will define the PCsbased on the above mentioned technical requirements. The matrix for this step is shown in Fig. 5.
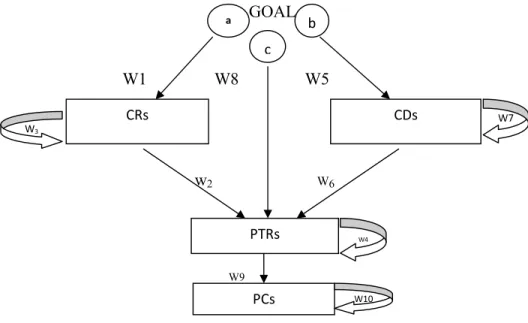
Step Three: Network Diagram Planning
In part A, the aim is to determine the priorities of Product Total Technical Requirements (PTRs) called Wa. The aim affects each customer requirement, and both CRs and PTRs are interconnected. In
part B, the aim is to determine the Product Total Technical Requirement called Wb. The objective
affects each company Demands (CDs) and the company Demands(CDs) affect product technical requirements (PTRs) which are both interconnected (W4 and W7). In part C, the main objective is to
determine the priorities for PCs called Wc. The aim affects every part quality requirement, and part
quality requirements affect product quality requirements which are both interconnected. Therefore, based on QFD , the network diagram is depicted in Fig. 6.
GOAL W5 W8 W1 W1
w2 W6
W9
Fig. 6. Network diagram for the QDF framework
Step Four: Forming the Super Matrix and calculating the weights
In step four, the obtained network diagram is a super matrix. The clustering structures of these super matrices are given in relations 9, 10, and 11.
1 3
2 4
0 0
a
G CRs PTRs w w CRs w w PTRs w ⎡ ⎤ ⎢ ⎥ ⎣ ⎦ (9)
W1 is a vector that represents the relative importance of CRs,w2 is a matrix that indicates the impact
level of CRs on each of the PTRs,w3 and w4 are the matrices that indicate the inner dependence of
CRs and PTRs ,In the same way, the supermatrices of 6 can be represented as wb and wc,
respectively. They are given as follows:
5 7
6 4
0 0
b
G CDs PTRs w w CDs w w PTRs w ⎡ ⎤ ⎢ ⎥ ⎣ ⎦ (10) 8 4 9 10 0 0 c
G PTRs PCs w w PTRs w w PCs w ⎡ ⎤ ⎢ ⎥ ⎣ ⎦ (11) a b c CRs
CDs
where w5and w8 are the vectors, which represent the relative importance of CDs and the final importance of PTRs. w6 and w9 are matrices, which indicate the impact level of CDs on each PTRs and the impact level of PTRs on each PCs. w7 and w10 are matrices, which indicate the inner dependence of CDs and PCs, respectively.
In the previous fuzzy ANP used in QFD, the result of pairwise comparison are crisp values. Unlike their approaches, the results of pairwise comparison yield TFNs instead of crisp values. In the step, the weight of elements for sub-matrices (w1-w10) is computed. The proposed pairwise comparison
method is described as follows: At first, each product developer (or customer) uses linguistic variables to assess the relative importance ratings between pairs of elements for a submatrix. The assessed linguistic variables are translated into corresponding TFNs, and thus a fuzzy pairwise comparison matrix is constructed. Assume the pairwise comparison matrix is denoted by
( ,l h, u)
ij ij ij ij m m
E=e = e e e × where eij expresses the relative importance of element i compared with
element j. Notice that 1
1/ .
ij ij
e− = e The weight of each element can be derived using the Buckley
method proposed by Buckley (Asgharpour, 2007). Their method is briefly described as follows:
Step One: Pair comparison matrix (E) is obtained as eij= (aij, bij, cij)
Step Two:ωi weights (Geometrical average of each E row) are calculated as below:
1
2 2 1 2
{ (0) (0)...(0) } ;n (:)( ( ) ( ) )
i i i in i i i n
Z = a a a ∀
ω
=z z + z + z (12)Details for calculating ωi are as follows:
(13)
1 1 1
1 1 1
1 1 1
{ }, { }, { }, , ,
m m m
n n n
n n n
i ij i ij i ij i i i
j j j
i i i
a a b b c c a a b b c c
= = = = = =
= Π = Π = Π =
∑
=∑
=∑
Then we can obtain ωi:
max max max max
[ ] i , i , i , max , 1...,
i i i i
a b c
b b c i p
b b b
ω = =⎡⎢⎛⎜ ⎞⎟⎤⎥ = =
⎝ ⎠
⎣ ⎦
(14)
Step Three: Repeat the second phase to calculate key fuzzy weights based on present aij and
calculation ωj phases.
Therefore, using this method we can calculate the component weights of each matrix (W1-W10). Due
to high data levels and calculation volume, programming techniques were employed for eight calculations. Almost all calculations related to AHP and ANP are carried out based on the decision makers' justifications, and reject any failures in comparing and determining the importance between options and indexes. The consistency ratio is a tool to determine justification consistencies and to determine the trust level regarding resulting preferences. Experience shows that if the consistency ratio is below 1%, the consistency of comparisons are acceptable, otherwise all comparisons should be repeated (Saati, 1980).
Calculating the consistency ratio is as follows:
max
max 1
1 0
, 1, 2,..., , , / 1
h h
m
e h
e ij wi
i j m CI CR CI RI
m wi m
λ
λ ≡ ⎛⎜∑ = ⎛⎜∑ ⎞⎟⎞⎟ = = =
−
⎝ ⎠
⎝ ⎠
(15)
where:
max: the largest eigenvalue of matrix E ג
CR: the consistency ratio of matrix E
It should be mentioned that for the purpose of corporate decision making, using single statement justifications may not be exact in order form pair comparative matrices. Due to their complexties, management decisions need to be consulted and collaborated by a commited expert. Therefore, when there are more than one expert, we can use a geometric average in order to combine opinions.
In this case, the geometrical average is calculated as follows:
1 ( ) 1
N k N
ij K ij
a = Π⎡⎣ =a ⎤⎦ (16)
Step Five: Calculate the overall importance of PTRs and PCs
In the first step, the cohesion importance of PTRs is calculated as follows:
(17) WPTRs=W4*W2
The cohesion importance of CRs from the customer point of view is calculated as follows:
(18) WCRs=W3*W1
Finally, the total priorities of PTRs from the customer point of view are calculated as follows:
(19) Wa= (W4*W2)*(W3*W1) = ( WPTRs*WCRs)
It should be mentioned that the employed numbers in W1 to W4 are triangular fuzzy numbers.
Therefore, we use fuzzy multiplication operation. Wb is calculated the same as Wa and the cohesion
importance of PTRs from the organization point of view is calculated:
WPTRs=W4*W6 (20)
The cohesion important of organization requirements is calculated as follows,
(21) WCDs=W7*W5
Finally, the total priorities of PTRs from the organization point of view are calculated as follows:
(22) Wb= (W4*W6) *( W7*W5) = (WPTRs*WCDs)
Vectors Wa and Wb are PTRs from both customer and organization point of view. Therefore, we will
combine these two vectors to obtain final PTRs (W8). Therefore, first we will normalize the two Wa
and Wb vectors.
Wa= [bi~] = [ (biL, bih, biu) ] ,e=1,2,…,p and the numbers are normalized as follows,
max, max, max
L h u
i i i
b b b b b b
⎡ ⎤
⎢ ⎥
⎣ ⎦
The relative importance based on Wa is determined as follows,
bmax=Max biu , i=1,2,…,p (23)
We will normalize Wb to obtain Wb’. W8 is calculated as follows,
(24) 8 a' (1 ) b'.
W = ×B W + −B W
products’ developers. Wc is obtained the same as Wa and Wb. In other words:
(25) Wpcs=(W9*W10)
The cohesion importance of PCs is calculated using the above relation.
(26) WPTRs=(W4*W8)
The final cohesion importance of products technical requirements is calculated:
10 9 4 8
( ) ( ) ( )
c pcs PTRs
W = W ×W × W ×W = W ×W (27)
Utilized numbers in Eqs. 16, 17, 18, 25 , and Eq. 26 are triangular fuzzy numbers. Therefore, the fuzzy multiplication technique is employed. Therefore, final prioritization of technical requirements and overall quality requirement preferences are obtained.
Step Six: Final Ratings
According to step five, the final priority of the PTRs (W8) and overall part quality requirements (Wc)
are specified (Dang et al., 2006). In this stage, we use fuzzy rating method to rate the obtained information.
4. Case Study
The proposed case study of this paper is associated with packaging company established in 1997 in Parandak Industrial Town, Iran to produce polymeric films. The company produces six products including PVC films, PET films, PVC Shrink films, PVDC films, PP films and shrink labels.
The company’s second program is to produce PVDC sheets for pharmaceutical applications. Pharmaceutical packages should be resistant against moisture to help prevent substance failure different regions. PVC does not provide suitable protection; therefore PVDC cover is placed on top of PVC sheets to prevent oxygen and moisture penetration into the medicine.
If the medicine is sensitive to light, food and pharmaceutical colors are used to control light passing. Therefore, PVDC production was started in 1999 in this industrial facility.
In this study, researchers explained the quality function deployment to the organization’s experts and expected outcomes. Therefore, they implemented the model on the PVDC product and rated the results using fuzzy analysis network process.
Research Model implementation
To successfully implement the model for producing PVDC, an expert team was formed including the company chairman, company managers, production managers and assistants. Each member has his own experience and knowledge in production improvement.
Step One: Product programming phase (forming house of quality based on the customer views, forming house of quality based on organization views)
First, the expert team considers the CRs or their voice. In this research, we have interviewed PVDC customers, both using the phone and face to face. The customers were asked which kinds of pill packages will satisfy their needs. Here are the replies:
- For pill packages, suitable raw materials should be used.
destruction of the pill in humid weather.
- It should be resistant to heat and light, prevent the entrance of oxygen and moisture into the packages.
- Pill packages change shape in different weather conditions. They should be of good quality.
Then, with the help of the organization’s experts, we attempted to summarize customer voices and categorize them into general customer voices (merging common voices in one group). In this process, the feeling and spirit of the voice should be preserved, such that while entering this request into quality function deployment, the reader should easily understand the customer’s feeling. Then they would translate the customers' voice in order to use in production definitions, design, process and production for the organization. Based on CRs, Daroupat Shargh Co. organizational team specified the technical requirements of the product.
Step Two: Part deployment phase (determining part quality requirements)
Organizational team determined the PCs based on the above mentioned technical requirements. In summary, Table 4 shows CRs, products technical requirements, company Demands(CDs) and parts quality requirements.
Table 4
Determining CRs, PTRs, CDs, PCs in Dai Packaging Industry Co.
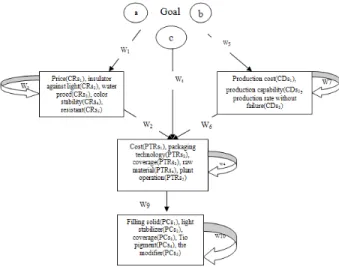
) PCs ( ) CDs ( ) PTRs ( ) (CRs
Filling solid material ) PCs1 ( Production cost ) CDs1 ( Cost ) PTRs1 ( Price ) CDs1 ( Light stabilizer ) 2 PCs ( (CDs2)production capability Packaging technology ) PTRs2 ( Insulator against light ) CDs2 (
PVDC polymer thin coating ) PCs3 ( (CDs2)production capability Coverage technology ) PTRs3 ( Water proof ) CRs3 ( TIO pigment ) PCs4 ( (CDs2) production capability
Selecting suitable of raw material ) PTRs4 ( Color stability ) CRs4 (
Step Three: Network diagram planning
According to Fig. 6, QFD network diagram for D Company. is as following:
Fig. 7. Network diagram for QFD of Daroupat packaging Co.
characters.
Step Four: Forming extra matrix and calculating weights
The obtained network diagram (Fig. 7) is obtained as a super matrix. The clustering structure is shown in the Eqs. (9-11). The member weight of each sub matrix W1-W10 is obtained based on
comparison matrix of fuzzy pairs. Because of the high level of data and calculation volume, Visual Basic programming has been employed for calculating W1-W10 weights.W1 is a matrix showing the
degree of importance of customer product requirements in D Company. In this research, 10 customers filled the questionnaires and the first idea is listed in Table 5. Customer 1 used linguistic variables to define the relative importance between pairs of CRs. For example, customer 1 assessed that CR1was
Low compared to CR2,so it was denoted as L. The other values in Table 3 were also likewise denoted.
Table 5
The relative importance of CRs
CR5 CR4 CR3 CR2 CR1 CRs ML M L L
(1 1 1) CR1 M ML ML (1 1 1)
H CR2 VH ML (1 1 1)
MH H CR3 M (1 1 1)
MH MH M CR4
(1 1 1) M VL M MH CR5
Very Low(VL):(0 0 0.2),Low(L):(0.05 0.2 0.35),Middle Low(ML):( 0.2 0.35 0.5), Middle(M):( 0.35 0.5 0.65),Middle High(MH):(0.5 0.650.8),High(H):(0.65 0.8 0.95),Very High(VH):(0.8 1 1)
We can calculate the relative importance of CRs for other customers and further obtain the aggregated relative importance of CRs(w1)
Table 6
Weights of the W1sub-matrix components for D Company (CR1: 0.0063 <0.1)
W1 0.4405 0.56093 0.69012
0.367 0.50965 0.68161
0.6599 0.70589 0.74631
0.30948 0.47623 0.5725
0.313 0.4214 0.57729
Similarly, we provide the relationships between CRs and PTRs and calculate W2 to W10. In our
calculation, all data have been consistent.
Step 5: Calculate the overall importance of PTRs and PCs
Calculating the sub-matrix, we can now form the super matrices Wa , Wb and Wc.
As mentioned previously, because of the high level of data and high volume of calculations, and the need for easy calculation, Visual Basic techniques were employed for super matrix calculations. Wa is
a super matrix showing the total priorities of PVDC PTRs from Daroupat customers’ point of view. Calculations are carried out using Eqs. (17-19) and the final results are given below:
Table 7
Super matrix Wa and Wb, the total priorities of PVDC PTRs from Dai customers’ point of view
Wa' Wb'
Wa and Wb vectors are super matrices showing the total priorities of PTRs from customers and
experts’ point of view. Combining these two vectors leads to W8.Both vectors Wa and w b were
normalized considering Eq. (23). Then, the organization expert team determines the customer importance index. Four members of the company’s experts determined the customer importance index β=.6. When the value of β is higher, customer opinions are taken more seriously compared with organization member opinions. Therefore, the Daroupat team of experts agreed to allow a higher weight of opinion for customers compared to company Demands(CDs). Hence, the final PTRs (W8)
are calculated according to Eq. (24). The final results are given in Table 8.
Table 8
Matrix W8, the total priorities of PCsin D Company
W8
PTRS1 0.1904 0.654 1
PTRs2 0.1122 0.4156 0.352
PTRS3 0.0726 0.364 0.3034
PTRS4 0.049 0.1776 0.2782
PTRS5 0.0503 0.1992 0.3046
Wc is a matrix, which shows the total priorities of PCs in Daroupat Company calculated according to
Eqs. (25-27). the final results are given below
Table 9
Super matrix Wc, the total priorities of PVDC PTRs in D Company
WC
PCS1 0.289 14.412 83.026
PCS2 4.339 32.874 92.72
PCS3 9.088 34.057 92.65
PCS4 0.556 17.45 83.097
PCS5 0.944 25.594 83.256
Step Six: Final rating
The fuzzy rating technique has been employed based on vectors W1,W8 and Wc based on fuzzy
numbers. Therefore, the results for the final rating of these three vectors are given in the below table.
Table 10
Final rating of PVDC CRs, PTRs and PCs for Dai packaging industry
Ranking Results Items
CRs3>CRs1>CRs2>CRs5>CRs4 Relative importance of CRs(w1)
PTRs1>PTRs2>PTRS3>PTRS5>PTRs4 Final importance of PTRs(w8)
PCs3>PCS2>PCs5>PCs4>PCs1 Absolute importance of PCs(wc)
5. Conclusion
The proposed model of this paper focused on company demands, which plays an important role in production development.
The results of using fuzzy analysis network process based on the QFD model in Daroupat packaging company to develop PVDC show that the most important indexes are being waterproof, resistant pill packages, and production cost. In addition, the PVDC coating is the most important index in terms of company experts’ point of view.
References
Ashgharpour, M. (2007). Multiple Criteria Decision Making. Institute of Tehran University Publications and Printing, 3rd ed., 374-360.
Buyukozkan,G., Feyzioglu, O., & Ruan, D. (2004). Fuzzy group decision-making multiple preference formats in quality function deployment. Computer in Industry, 58, 392-402
Chan, L.K., Kao, A., & Ng, A. (1999a). Rating the importance of customer needs in QFD by fuzzy and entropy methods. International Journal of Production Research, 37(11), 2499-2518
Chen,L.S., & Weng, M.C. (2006). An evaluation approach to engineering design in QFD process using fuzzy goal programming models. European Journal of Operational Research, 172(1), 230-248.
Chan, L.K., Kao, H.P., Ng, A., & Wu, M.L. (1999b). Rating the importance of customer needs in quality function deployment by fuzzy and entropy methods. International Journal of Production Research, 37(11), 499–518.
Ertay, T., Buyukozkan, G., Kahraman, C., & Ruan, D. (2005). QFD implementation based on ANP with linguistic data: An application in automotive industry. Journal of Intelligence Fuzzy Systems, 16, 221-232.
Faresjani, H. (2001). Strategic planning and quality management in the twenty-first century to produce world-class. Third Conference on Quality Management
Büyüközkan, G., Feyzioğlu, O., & Ruan, D. (2007). Fuzzy group decision-making to multiple preference formats in quality function deployment. Computers in Industry, 58, 392–402.
Gunita, L.R., Praizler, N.C. (1993). The QFD Book: The Team Approach to Solving Problems and Satisfying Customers through Quality function Deployment. Amacom, New York.
Hauser, J. R., & Clausing, D. (1998). The House of quality. Harvard Business Review, 66, 63-73. Hsusan Chen, C., & Weng, M. (2006). An evaluation approach to engineering design in QFD process
using fuzzy goal programming models. European Journal of Operational Research, 172, 230-248. Kahramam Cengiz.,Ertay.Tijen.,Buyukozkan.Gulcin.,2006.A Fuzzy Optimazation Model for QFD
Planing process Using analytic network approach. European journal of Operational Research, 390-411.
Karsak, E.E., Sozer, S., & Alptekin, S.E. (2003). Product planning in quality function deployment using a combined analytic network process and goal programming approach. Computers and industrial engineering, 44(1), 171-190
Khoo, L.P., Ho, N.C. (1996). Framework of a fuzzy quality Function deployment system. International Journal of Production Research, 34, 299-311.
Kim, K.J., Moskowitz, H., Dhingra, A., & Evans, G. (2000). Fuzzy multicriteria models for quality function deployment. European Journal of Operational Research, 121, 504–518.
Khalili S.S. (2008). Research Methods In The Human Sciences. Yadvareh Publications, 2,15-36 Day, R. G. (1993). Quality Function Deployment: Linking a Company's customers with it
.Farazandish Sabz Publications1,181.
Chen, L.H., & Weng, M.C. (2006). An evaluation approach to engineering design in QFD processes using fuzzy goal programming models. European Journal of Operational Research, 172, 230– 248.
Partovi, F.Y. (2001). An analytic model to quantify strategic service vision. International Journal of Service Industry Management, 12 (5), 476-656.
Shen, X.X., Tan, K.C. & Xie, M. (2001). The implementation of quality function deployment based on linguistic data. Journal of Intelligent Manufacturing, 12 (1), 65–75.
Sohn, S.Y., & Choi, I.S. (2001). Fuzzy QFD for supply chain management with reliability consideration. Reliability Engineering and System Safety, 72(3), 327–334.
Liu, H.T., & Wang, C.H. (2010). An advanced quality function deployment model using fuzzy analytic network process. Applied mathematical modeling, 34(1), 3-19
Tsai, C.Y. (2003). Using fuzzy to enhance manufacturing strategic planning. Journal of Chinese Institute of Industrial Engineering, 18(3), 33-41.
Wang. J. (1999). Fuzzy outranking approach to prioritize design requirements in quality function deployment. International Journal of Production Research, 37(11), 899-916.
Lai, X., Xie, M., Tan, K.C., & Yang, B. (2008). Ranking of customer requirements in a competitive environment. Computers & Industrial Engineering, 54(2), 202–214.
Lee, Y.C., Sheu, L.C., & Tsou, Y.G. (2008). Quality function deployment implementation based on Fuzzy Kano model: An application in PLM system. Computers & Industrial Engineering, 55(1), 48–63.