A Novel Fuzzy Time Series Model Based on
Fuzzy Logical Relationships Tree
Xiongbiao Li, Yong Liu, Xuerong Gou, Yingzhe Li
Abstract—Fuzzy time series have been widely used to deal with forecasting problems. In this paper, a novel fuzzy time series model is proposed, in which a fuzzy logical relationships tree containing multi-orders fuzzy relationships is construct-ed. Specifically, the robustness of lower orders fuzzy logical relationships and the precision of higher orders fuzzy logical relationships are exploited simultaneously to improve the fore-casting accuracy. The trading data of Taiwan Capitalization Weighted Stock Index (TAIEX) and the enrollments of Alabama University are used as benchmark data for training and testing, and the forecasting results show that the proposed model gets higher forecasting accuracy.
Index Terms—fuzzy time series, fuzzy logical relationships, data forecasting, fuzzy systems.
I. INTRODUCTION
T
IME-SERIES forecasting is used for forecasting the future based on historical observations in various do-mains, such as air pollution, stock forecasting and etc. In the actual applications, noises will give rise to uncertain data. However, traditional time series analysis cannot handle the perturbation in data. Therefore, based on the fuzzy set theory [1], Song and Chissom proposed the concepts of fuzzy time series, which are popular in data forecasting recently due to the fact that they could provide resistance to the perturbation of input data without requiring complex certification and assumption of large samples [2], [3], [4].The forecasting process in fuzzy time series composes with the following four steps: (1) partition of the universe of discourse, (2) definition of fuzzy sets and fuzzification of time series with the use of these fuzzy sets, (3) establishment of fuzzy logical relationships from the fuzzy time series, and (4) forecasting and defuzzification of the output of fuzzy time series. Based on fuzzy time series, some methods and models have been proposed to improve performance of forecasting. In [5], Chen proposes a model using simplified arithmetic operations instead of the complicated max-min composition operations used in [2], [3], [4] when establishing fuzzy logi-cal relationships. In [6], Huarng presents a heuristic model by integrating problem-specific heuristic knowledge with Chen’s model when defuzzifying the output. In [7], the author has a discussion on the effect of the forecasting accuracy from the partition to the universe of discourse. In [8], Wang and Chen
Manuscript received March 11, 2016; revised November 15, 2016. Project supported by the National Natural Science Foundation of China (No.61501041), Open Foundation of State Key Laboratory (No.ISN16-08) and Huawei Innovation Research Program (HIRPO20140512).
Xiongbiao Li and Yong Liu are with Beijing University of Posts and Telecommunications, Beijing 100876, China and The State Key Laboratory of Integrated Services Networks, Xidian University, Xian 710071, China (e-mail:[email protected];[email protected])
Xuerong Gou is with Beijing University of Posts and Telecommunica-tions, Beijing 100876, China (e-mail:[email protected])
Yingzhe Li is with Huawei Technologies Co. , Ltd. , Shenzhen 201206, China (e-mail:[email protected])
propose a new model based on high-order and fuzzy-trend of logical relationships for forecasting. In [9], the particle swarm optimization technique is exploited in the forecasting model to improve the forecasting accuracy. In [10], the fuzzy logical relationships are replaced with the artificial neural networks. In [11], a forecasting model based on similarity measures of fuzzy logical relationships is proposed. In [12], a method of partitioning the fuzzy logical relationships based on support vector machine is proposed. In [13], [14], [15], multiple variables time series are considered simultaneously to improve the forecasting accuracy, where multiple variables include a main factor and at least a secondary factor. In [16], an adaptive selection of analysis windows and heuristic rules is proposed to improve forecasting accuracy. In [17], a forecasting model of fuzzy time series which exploits respectively particle swarm optimization algorithm and fuzzy K-means clustering algorithm to obtain the optimum partition of the universe of discourse is proposed. The aforementioned works, in the testing phase, mainly exploit a certain order of the fuzzy relationship to forecast values, regardless of fixed order (first-order, second-order or higher-order) or adaptive order of fuzzy relationships is used for forecasting. However, different orders of the fuzzy relationships have different information, i.e., the lower orders fuzzy logical relationships have robustness information, while the higher orders fuzzy logical relationships have precision information. Only considering a single order of the fuzzy relationship in the testing phase will not make full use of effective information of different orders.
In this paper, we propose a novel forecasting model con-sidering multi-orders (first-order, second-order and higher-order) of fuzzy logical relationships simultaneously. Specifi-cally, a multi-orders relationship tree is constructed, and thus the robustness of lower orders fuzzy logical relationships and the precision of higher orders fuzzy logical relationships are introduced simultaneously into the model to improve the forecasting accuracy.
The rest of this paper is organized as follows. A brief review of the theory of fuzzy time series is described in Section 2. In Section 3, a novel forecasting model with multi-orders relationship tree is proposed. Experiments are presented in Section 4, and some concluding remarks are given in Section 5.
II. REVIEW OF FUZZY TIME SERIES
In this section, we briefly review some basic concepts of fuzzy time series [2], [3], [4], where the values of fuzzy time series are represented by fuzzy sets [1].
LetU be the corresponding universe of discourse, where
follows
Ai=fAi(u1)/u1+· · ·+fAj(uj)/uj+· · ·+fAi(un)/un,
wherefAi denotes the membership function of the fuzzy set
Ai, fAi(uj)/uj represents the degree of membership of uj
belonging to the fuzzy setAi,fAi(uj)∈[0,1]and16j6
n.
Definition 1: Let Y(t)(t = · · ·,0,1,2,· · ·), a subset of
R, be the universe of discourse on which fuzzy sets fi(t) are defined. And letF(t)is a collection off1(t),f2(t),· · ·,
thenF(t)is called a fuzzy time series defined on Y(t)(t= · · · ,0,1,2,· · ·).
Definition 2: When F(t) is a fuzzy time series and
F(t)=F(t − 1) × R(t, t − 1), where R(t, t − 1) is the fuzzy relationship between F(t) and F(t−1), and × is an operator, F(t) is said to be caused only by F(t−1). The relationship betweenF(t)andF(t−1)can be denoted byF(t−1)→F(t), which is called first-order fuzzy logic relationship. AndF(t)=F(t−1)×R(t, t−1)is called first-order fuzzy time series model.
Definition 3: If F(t) is caused by F(t−1), F(t−2),
· · · , F(t−n), and the fuzzy relationship is represented by
F(t−n), · · ·, F(t−2),F(t−1)→F(t), which is called
nth-order fuzzy logic relationship. And F(t) is called the
nth-order fuzzy time series model.
Definition 4: Let F(t − 1)=Ai1, F(t − 2)=Ai2, · · ·,
F(t−n)=Ain and F(t)=Aj, where Ain, · · ·,Ai2, Ai1 and
Aj are fuzzy sets. The fuzzy logical relationship amongn+1 consecutive data can be denoted asAin,· · ·,Ai2,Ai1→Aj,
where Ain, · · ·, Ai2, Ai1 is the left-hand side (LHS), and
Aj is the right-hand side (RHS).
We can group fuzzy logical relationships having the same LHS into a fuzzy logic relationship group (FLRG). For example, assume that the following fuzzy logic relationships exist
Ain,· · · , Ai2, Ai1 →Aj1
Ain,· · · , Ai2, Ai1 →Aj2
· · ·,
these fuzzy relationships can be group into a fuzzy relation-ship group
Ain,· · ·, Ai2, Ai1 →Aj1, Aj2,· · ·.
III. PROPOSED FORECASTING MODEL BASED ON FUZZY LOGICAL RELATIONSHIPS TREE
In this section, we present a novel fuzzy time series model considering multi-orders of fuzzy logic relationships simultaneously. Specifically, a tree of multi-orders fuzzy logic relationships is constructed and corresponding heuristic rules are proposed to improve forecasting accuracy. The proposed model is now presented as follows.
Step 1 Define the universe of discourseU,U=[Dmin−
D1, Dmax+D2], where Dmin and Dmax denote the minimum value and the maximum value of the historical training data respectively; D1 and D2 are two proper positive real values to partition
the universe of discourseU into n equal intervals, denoted as u1, u2,· · ·, un. Note that the length of
each interval is half of the standard deviationσof historical data, andD1+D2< σ/4.
Step 2 Define the fuzzy linguistic termsA1,A2,· · ·,An represented by fuzzy sets, shown as follows
A1= 1/u1+ 0.5/u2+ 0/u3+· · ·+ 0/un−1+ 0/un
A2= 0.5/u1+1/u2+0.5/u3+· · ·+0/un−1+0/un
· · ·
An= 0/u1+0/u2+0/u3+· · ·+0.5/un−1+1/un,
whereu1, u2, · · ·,un are the intervals defined in Step 1.
Step 3 Fuzzify each historical training datum into a fuzzy set defined in Step 2. If the historical training datum of timetbelongs to the intervaluidefined in Step 1 and the maximum membership value of fuzzy set
Ai happens atui, where 1< i < n, the fuzzified value of the historical training datum of time t is
Ai.
Step 4 Construct the fuzzy logical relationships from the fuzzied historical training data obtained in Step 3. According to Definition 2 and Definition 3, first-order, second-order and third-order fuzzy logical relationships are constructed respectively. More-over, according to Definition 4, FLRG for a certain order fuzzy logical relationships is constructed. For example, let us consider the following n th-order fuzzy logical relationships with the same LHS
Ain,· · ·, Ai2, Ai1
Ain,· · · , Ai2, Ai1 →Aj1
Ain,· · · , Ai2, Ai1 →Aj2
· · ·,
these fuzzy relationships can be grouped into a fuzzy relationship group
Ain,· · ·, Ai2, Ai1 →Aj1, Aj2,· · ·.
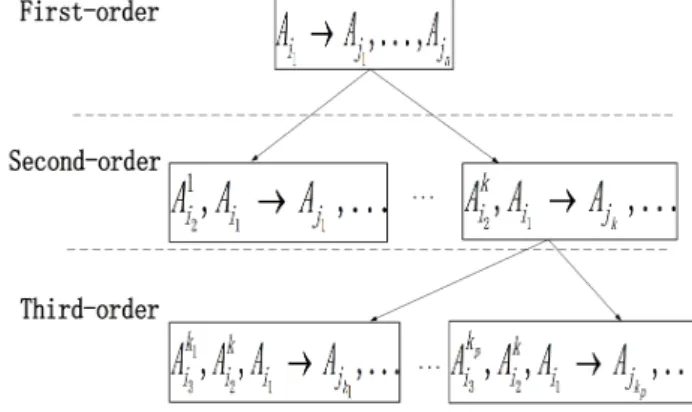
Step 5 Construct fuzzy logical relationships tree (FLRT) based on the three orders FLRG obtained in Step 4.
Fig. 1. Fuzzy logical relationships tree
FLRG, Aj1, · · ·, Ajn represents the RHS of the
first-order FLRG, which means that there aren first-order fuzzy logic relationships in the group. The middle layer represents the second-order FLRG, whereAk
i2,Ai1 →Ajk represents the second-order
FLRG containing LHSAi1 of the first-order fuzzy
relationships. In a similar way, the bottom layer represents the third-order FLRG, where Akp
i3,A
k i2,
Ai1 → Ajkp· · · represents the third-order FLRG
containing LHSAk
i2, Ai1 of the second-order fuzzy
relationships.
Step 6 Analyse the fuzzy variations in FLRGs. In the first-order FLRG, ie., Ai1 →Aj1,· · ·, Ajn, i1 <
jk(k = 1, · · ·, n) represents the uptrend of fuzzy relationships,i1> jk(k= 1,· · ·,n) represents the downtrend of fuzzy relationships, and i1=jk(k =
1, · · ·, n) represents the invariant trend of fuzzy relationships. Letp1,ube the number of the uptrend in the first-order FLRG,p1,d be the number of the downtrend and p1,e be the number of the invariant trend. For the second-order FLRG, ie.,Ak
i2,Ai1 →
Ajk,· · ·, and the third-order FLRG, ie.,A
kp
i3,A
k i2,
Ai1→AjkP, the uptrend, downtrend and invariant
trend of fuzzy relationships are subject to the first-order variations therein.
Step 7 To calculate the forecasting value, the following heuristic rules are defined
• Rule 1: If the multiple orders fuzzy logical relationships are found as follows
Ai1 →Aj1,· · ·
Ak
i2, Ai1 →Ajk,· · ·
Akp
i3, A
k
i2, Ai1 →Ajkp,· · · ,
the forecasting valuesF(t)1, F(t)2 andF(t)3
based on first-order, second-order and third-order FLRGs are respectively
F(t)i= (Y(t−1)−
k 16)×
pi,d
pi,d+pi,e+pi,u
+Y(t−1)× pi,e
pi,d+pi,e+pi,u
+(Y(t−1) + k 16)×
pi,u
pi,d+pi,e+pi,u (1)
whereF(t)i(i= 1,2,3) denotes the forecast-ing value derived from the ith-order FLRG,
Y(t−1)stands for the actual value at the time
t−1, k denotes the length of intervals, and
pi,d, pi,u and pi,e (i = 1, 2, 3) respectively denote the numbers of forecasting downtrend, uptrend and invariant trend of the ith-order fuzzy logical relationship group. Then, differ-ent weights are assigned to the differdiffer-ent orders of fuzzy logical relationships, in which higher orders have larger weights and lower orders have smaller weights. Here we set the weightn
fornth-order FLRG according to the empirical
researches. Finally, the final forecasting values
F(t)could be achieved
F(t) = F(t)1×1 +F(t)2×2 +F(t)3×3 1 + 2 + 3
(2) • Rule 2: If only the first-order fuzzy logical relationships are found, the final forecasting valuesF(t)could be achieved
F(t) =F(t)1 (3)
• Rule 3: If only the first-order and the second-order fuzzy logical relationships are found, the final forecasting valuesF(t)could be achieved
F(t) =F(t)1×1 +F(t)2×2
1 + 2 (4)
• Rule 4: If there is no fuzzy logical relationship is found, the final forecasting valuesF(t)could be achieved
F
(
t
) =
Y(t−1)×3+Y(t−2)×2+Y(t−3)×1 1+2+3(5) whereY(t−1),Y(t−2)andY(t−3)represent respectively the actual values of timet−1, time
t−2 and timet−3.
In the following, we use an example to illustrate the forecasting process of the proposed model based on the TAIEX. The data from January 2004 to October 2004 is used for training, and the data from November 2004 to December 2004 is used for testing.
[Step 1]Based on the aforementioned training data from TAIEX, the minimum valueDmin and the maximum value
Dmaxcan be known, i.e.,Dmin=5316.87andDmax=7034.1 respectively, and the calculated standard deviation σ=456. With the length of each interval be half of the standard deviation σ, the positive real values D1 and D2 could be
set 16.87 and 89.9 respectively. Then, the universe of dis-course becomesU=[Dmin−D1, Dmax+D2]=[5300,7124],
which could be divided into 8 intervals u1, u2, · · ·,u8 of
equal length, whereu1=[5300,5528), u2=[5528,5756),· · ·, u8=[6896,7124].
[Step 2]Based on the generated 8 intervalsu1,u2,· · ·,u8,
the fuzzy setsA1,A2,· · ·,A8 could be defined as follows
A1= 1/u1+ 0.5/u2+ 0/u3+· · ·+ 0/u7+ 0/u8
A2= 0.5/u1+ 1/u2+ 0.5/u3+· · ·+ 0/u7+ 0/u8
· · ·
A8= 0/u1+ 0/u2+ 0/u3+· · ·+ 0.5/u7+ 1/u8
[Step 3]Fuzzify each training datum into the correspond-ing fuzzy set based on the fuzzy sets A1, A2, · · ·, A8
defined in[step 2]. For example, the historical training data of TAIEX on January 2nd is 6041.56, which belongs to the intervalu4=[5985,6212], and the maximum membership
value of fuzzy setA4 occurs atu4, so the historical training
data 6041.56 is fuzzified intoA4.
first-order, second-order and third-order are constructed re-spectively. For example, the first-order FLRG with the LHS be A4 of day t−1 isA4 →A4×14, A3×6, A6, A5×3,
where ”×” represents the number of the same first-order fuzzy logical relationship based on the historical training data from TAIEX. Next, the second-order FLRGs constructed based on the first-order FLRG are as follows
A4, A4→A4×9, A3×3, A5, A6
A5, A4→A5×2, A4×2
A3, A4→A3×3, A4×2.
One of the constructed second-order FLRGs is A4, A4 → A4 ×9, A3×3, A5, A6. Further, the third-order FLRGs
are constructed based on the second-order FLRGs in a similar way. One of the constructed third-order FLRGs is
A4, A4, A4→A4×5, A5.
[Step 5] Construct fuzzy logical relationships trees with three layers based on the FLRGs of three orders obtained in Step 4 as shown in Fig .2.
For example, to forecast the value on December30th, the fuzzy values of 27th, 28th and 29th, i.e., A
4, A4 and A4,
are used to search the FLRGs from top to bottom according to the constructed tree in Fig.2. The resulting FLRGs are as follows
First-order A4→A4×14, A3×6, A6, A5×3
Second-order A4, A4→A4×9, A3×3, A5, A6
Third-order A4, A4, A4→A4×5, A5
First-order
Second-order
Third-order
4 414,3 6,5 3,6 A A A A A
4,4 4 9,3 3, ,5 6
A A A A A A A A5,4 A5 2,A42 A A3,4 A3 3,A42
4, ,4 4 4 5,3 3,5 A A A A A A
5, ,4 4 4,6 A A AA A
3, ,4 4 4 2 A A A A
5, ,5 4 5 A A AA
4, ,5 4 4 A A AA
5, ,5 4 5 A A AA
6, ,5 4 4
A A AA A A A3, ,3 4A A3,42 4, ,3 4 3
A A AA A A A2, ,3 4A3
Fig. 2. A fuzzy logical relationships tree of TAIEX
[Step 6] Analyse the fuzzy variations in FLRGs. Accord-ing to Fig.2, for the each order FLRG,A4→A3 represents
the downtrend,A4→A4 represents the invariant trend, and A4 → A5, A6 represents the uptend. The numbers of the
uptrend, downtrend and invariant trend of each order FLRG are illustrated in Table I.
TABLE I
PARAMETERS OF FORECASTING TREND
pi,d pi,e pi,u
i= 1 6 14 4
i= 2 3 9 2
i= 3 3 5 1
In Table I, pi,d, pi,e and pi,u represent respectively the downtrend, invariant trend and uptrend for the ith order FLRG.
[Step 7] From [step 6], we can see that three orders of fuzzy logical relationship groups exist for the forecasting of the value on December 30th, 2004, so Rule 1 is adopted. We know the actual value of December 29th, 2004 is
6088.49, the forecasting value is calculated by Rule 1 with the parameter Y(t)=6088.49, k=328. According to Eq.(1),
F(t)1,F(t)2 andF(t)3 can be calculated
F
(
t
)
1=
6074.24×6+60886+14+4.49×14+6102.74×4,
F
(
t
)2
=
6074.24×3+6088.49×9+6102.74×23+9+2
,
F
(
t
)3
=
6074.24×3+6088.49×5+6102.74×13+5+1
.
Then the final forecasting valueF(t)on December30th, 2004 could be achieved according to Eq.(2)
F(t) =F(t)1×1 +F(t)2×2 +F(t)3×3
1 + 2 + 3 = 6086.37.
IV. EXPERIMENTAL RESULTS
In this section, the forecasting performance of the pro-posed model will be examined based on two datasets. One is the TAIEX from 2001 to 2004, where the data from January to October of each year is used as training data, and the data in November and December of each year is used as testing data. The other dataset is the enrollments of Alabama Uni-versity from 1971 to 1992, where the enrollments data from 1971 to 1991 is used as training data, and the enrollments data from 1994 to 1992 is used as testing data.
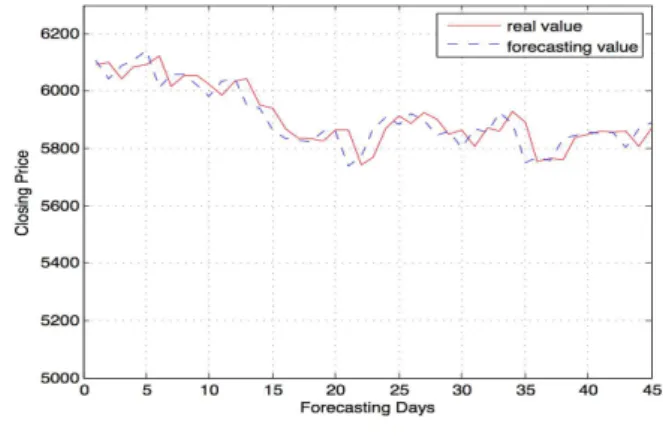
Fig. 3. Forecasting value of 2003
TABLE II
COMPARISON OF THERMSES AND THE AVERAGERMSES FOR DIFFERENT MODELS
Models 2001 2002 2003 2004 Average RMSE
Uni-variate
Conventional Regression
Model[21], [22] 1070 116 329 146 415.25 Neural Network
Model[19], [20] 259 78 57 60 113.5 Neural Network-Based
Fuzzy Time Series Model[23], [19], [20]
130 84 56 116 96.5
Neural Network-Based Fuzzy Time Series Model with Substitutes[23], [19], [20]
130 84 56 116 96.5
Multi-variate
Huarng et al.’s Model[18]
Use NASDAQ 136.49 95.15 65.51 73.57 92.68 Use DOW Jones 138.25 93.73 72.95 73.49 94.605
Use M1B 133.26 97.1 75.23 82.01 96.9 Use DOW Jones,
M1B,NASDAQ 124.02 95.73 70.76 72.35 90.715 Chen’s Fuzzy Time
Series Model[5], [19], [20] 148 101 74 84 101.75 Bivariate Conventional
Regression Model[19], [20] 120 77 54 85 84 Bivariate Neural
Network Model[19], [20] 130 80 58 67 83.75
Chen and Chang’s Model[14]
Use NASDAQ 115.08 73.06 66.36 60.48 78.745 Use Dow Jones 113.7 79.81 64.02 82.32 84.994 Use Dow Jones,
NASDAQ 113.33 72.33 60.29 68.07 78.505 Use NASDAQ,M1B 116.59 76.48 53.51 69.29 78.9675
Use Dow Jones,
NASDAQ,M1B 113.67 66.82 56.1 64.76 75.3375
Chen and Chen’s Model[24]
Use Dow Jones 121.98 74.65 66.02 58.89 80.385 Use NASDAQ 123.12 71.01 65.14 61.94 80.3025 Use Dow Jones,
NASDAQ 123.85 71.98 58.06 57.73 77.905 Use M1B,Dow Jones 115.33 77.96 60.32 65.86 79.8675
Use M1B,NASDAQ 123.15 74.05 67.83 65.09 82.53
Chen and Chu’s Model[25]
Use TAIFEX 120.3 72.23 56.89 55.4 76.205 Use Dow Jones 117.18 68.45 53.96 52.55 73.035 Use NASDAQ 114.81 69.07 53.16 53.57 72.6525
Use M1B 117.75 70.63 54.92 55.29 74.6475 The Proposed Model 113.10 66.71 52.24 54.89 71.73
The performance of the proposed model is evaluated using the root-mean square error (RMSE), which is defined as follows
RM SE=
v u u t
n
P
t=1
(F(t)−Y(t))2
n
wherendenotes the number of days needed to be forecasted,
F(t)is the final forecasting value of dayt,Y(t)is the actual value of day t.
Firstly, the proposed model is verified based on the TAIEX data of 2003 and 2004. In each year, 250 samples are provided, in which, 200 samples are used for training, 45 samples are used for testing. The forecasting closing prices in 2003 and 2004 are shown in Fig.3 and Fig.4 respectively. In Fig.3 and Fig.4, the solid line represents real values of 45 testing samples, while the dotted line represents their forecasting values. From the figures we can see that the two lines fit well. The RMSE of 2003 is 53.33 and RMSE of 2004 is 54.89 respectively.
Next, based on the same TAIEX data, the performance of the proposed model is verified by comparing forecasting results with those of the existing models proposed in [5], [14],[18],[19],[20],[21],[22],[23], [24], [25] based on data from 2001 to 2004.
In those models for comparison, some models adopt uni-variate models, while the others adopt multi-uni-variate models to
TABLE III
COMPARISON OF THERMSES FOR FORECASTING THE ENROLLMENTS OFALABAMAUNIVERSITY
Models Song’s Model[2] Chen’s Model [5] Huarng’s Model [6] Singh’s Model [26] Aladag’s Model [27] Proposed Model
RMSE 642 638 353 295 279 216
It can be seen from Table II that the RMSE of each year and the average RMSE of all years of the proposed model are all smaller than the comparative models. Moreover, only univariate is adopted for simplification in our proposed model, the higher forecasting accuracy could be achieved, which is even higher than those of the existing multivariate fuzzy time series forecasting models.
Finally, the proposed fuzzy time series model is applied on the enrollments of Alabama University from 1971 to 1992. The performance of the proposed model is compared with those of existing models by RMSE. In those models, Singh’s fuzzy time series model exploit robust method to improve the forecasting performance; Aladag’s model exploit neural networks to replace the fuzzy logical relationships in training and testing stage. The experimental results are shown in Table III.
It can be seen from Table III that the forecasting RMSE of the proposed model is 216, the forecasting RMSEs of Song’s, Chen’s, Huarng’s, Singh’s and Aladag’s model are 642, 638, 353, 295 and 279 respectively. The proposed model gets better forecasting performance.
V. CONCLUSION
In this paper, we propose a novel fuzzy time series model based on fuzzy logical relationships tree containing multi-orders relationships, in which the robustness of lower multi-orders fuzzy logical relationships and the precision of higher orders fuzzy logical relationships are combined together to improve the forecasting accuracy. Moreover, univariate is adopted in our proposed model. We compare the proposed model with some existing forecasting models including univariate and multivariate models. Experiment results show that the proposed model has better forecasting performance, and is more simple and easy to be implemented. In the future, we will introduce fuzzy logical relationships tree into multi-variate models.
REFERENCES
[1] L. A. Zadeh, Fuzzy Sets,Information Science, pp. 338-353, 1965. [2] Q. Song and B. S. Chissom, Fuzzy time series and its models,Fuzzy
Sets, vol. 54, pp. 269-277, 1993.
[3] Q. Song and B. S. Chissom, Forecasting enrollments with fuzzy time series-Part I,Fuzzy Sets, vol. 54, pp. 1-10, 1993.
[4] Q. Song and B. S. Chissom, Forecasting enrollments with fuzzy time series-Part II,Fuzzy Sets, vol. 62, pp. 1-8, 1994.
[5] S. M. Chen, Forecasting enrollments based on fuzzy time series,Fuzzy Sets, vol. 81, no. 3, pp. 311-319, 1996.
[6] K. Huarng, Heuristic models of fuzzy time series for forecasting,Fuzzy Sets, vol. 123, no. 3, pp. 369-386, 2001.
[7] K. Huarng, Effective lengths of intervals to improve forecasting in fuzzy time series,Fuzzy Sets, vol. 123, no. 3, pp. 387-394, 2001.
[8] S. M. Chen and N. Y. Wang, Handling forecasting problems based on high-order fuzzy time series and fuzzy-trend logical relationships, Proc. Workshop Consum. Electron, pp. 759-764, 2008.
[9] I. H. Kuo, S. J. Horng, T. W. Kao, T. L. Lin, C. L. Lee and Y. Pan, An improved method for forecasting enrollments based on fuzzy time series and particle swarm optimization, Expert Systems with Applications, vol. 36, no. 3, 2009 pp. 6108-6117.
[10] E. Egrioglu, V. R. Uslu, U. Yolcu and M. A. Basaran, A new approach based on artificial neural networks for high order bivariate fuzzy time series,Applications of Soft Computing, 2009, pp. 265-273.
[11] Shou Hsiung Cheng, Shyi Ming Chen and Wen Shan Jianc, Fuzzy time series forecasting based on fuzzy logical relationships and similarity measures,Information Sciences, pp. 272-287, 2016.
[12] Shyi-Ming Chen and Pei-Yuan Kao, TAIEX forecasting based on fuzzy time series, particle swarm optimization techniques and support vector machines,Information Sciences, Vol. 247, October 2013, pp. 62-71. [13] S. Askari and N. Montazerin, A high-order multi-variable Fuzzy Time
Series forecasting algorithm based on fuzzy clustering,Expert Systems with Applications, vol. 42 pp. 2121-2135, 2015.
[14] Shyi Ming Chen and Yu Chuan Chang, Multi-variable fuzzy forecast-ing based on fuzzy clusterforecast-ing and fuzzy rule interpolation techniques, Information Sciences, vol. 180 pp. 4772-4783, 2010.
[15] Abd-Elaal, Ashraf K, Hefny, Hesham A, Abd-Elwahab and Ashraf H, Forecasting of Egypt wheat imports using multivariate fuzzy time series model based on fuzzy clustering,IAENG International Journal of Computer Science, vol. 40, n. 4, pp. 230-237, 2013.
[16] Wai-Keung Wong, Enjian Bai and Alice Wai Ching Chu, Adaptive Time-Variant Models for Fuzzy-Time-Series Forecasting,IEEE Trans-actions on Systems, Man, And Cybernetics-Part B: Cybernetics, Vol. 40, No. 6, 2010.
[17] Khiabani, Khalil, Aghabozorgi and Saeed Reza, Adaptive time-variant model optimization for fuzzy-time-series forecasting,IAENG Interna-tional Journal of Computer Science, vol. 42, n. 2, pp. 107-116, 2015. [18] K. H. Huarng, T. H. K. Yu and Y. W. Hsu, A multivariate heuristic model for fuzzy time-series forecasting, IEEE Trans. Syst. Man, Cybern. Part-B: Cybern, vol. 37, no. 4, Aug 2007 pp. 836-846. [19] T. H. K. Yu and K. H. Huarng, A bivariate fuzzy time series model
to forecast the TAIEX,Expert Systems with Application, vol. 34, n. 4, 2008 pp. 2945-2952.
[20] T. H. K. Yu and K. H. Huarng, Corrigendum to ‘A bivariate fuzzy time series model to forecast the TAIEX’,Expert Systems with Application, vol. 37, no. 7, 2010, pp. 5529.
[21] N. Y. Wang and S. M. Chen, Temperature prediction and TAIFEX forecasting based on automatic clustering techniques and two-factors high order fuzzy time series,Expert Systems with Application, vol. 36, n. 2, Mar 2009, pp. 2143-2154.
[22] H. K. Yu, Weighted fuzzy time-series models for TAIEX forecasting, Phys. A, vol. 349, n. 3/4, Apr 2005, pp. 609-624.
[23] K. Huarng and T.H.K.Yu, The application of neural networks to forecast fuzzy time series,Physica A., vol. 363, n. 2, 2006, pp. 481-491.
[24] Shyi-Ming Chen and Chao-Dian Chen, TAIEX Forecasting Based on Fuzzy Time Series and Fuzzy Variation Groups, IEEE Transactions on Fuzzy Systems, Vol. 19 No.1, 2011.
[25] Shyi-Ming Chen and Huai-ping Chu, TAIEX Forecasting Using Fuzzy Time Series and Automatically Generated Weights of Multiple Factors, IEEE Transactions on Systems Man and Cybernetics-Part A: Systems and Humans, Vol. 42, N. 6, 2012.
[26] S.R.Singh, A robust method of forecasting based on fuzzy time series, Appl. Math. Comput, 188, 472484, 2007.