An 'Importance' Map of Signs and
Symptoms to Classify Diabetic
Polyneuropathy: An Exploratory Data
Analysis
Isabel C. N. Sacco1*, Eneida Yuri Suda1, Vincent Vigneron2, Cristina Dallemole Sartor1
1Department of Physical Therapy and Speech and Occupational Therapy, School of Medicine, University of São Paulo, São Paulo, Brazil,2Informatique, Biologie Intégrative et Systèmes Complexes, Université d'Evry, Evry, France
Abstract
Aims/Hypothesis
Early diagnosis of diabetic polyneuropathy (DPN) is critical for a good prognosis. We aimed to identify different groups of patients, based on the various common clinical signs and symp-toms of DPN, that represent a progressive worsening of the disease before the onset of plan-tar ulceration or amputation. We also sought to identify the most important DPN-related variables that can discriminate between groups, thus representing the most informative vari-ables for early detection.
Methods
In 193 diabetic patients, we assessed 16 DPN-related signs, symptoms, and foot character-istics, based on the literature and the International Consensus on the Diabetic Foot. We used multiple correspondence analysis and the Kohonen algorithm to group the variables into micro and macro-classes and to identify clusters of patients that represent different DPN conditions.
Results
Four distinct groups were observed. One group showed no indication of DPN. The remain-ing groups were characterized by a progressive loss of the vibration perception, without a worsening of symptoms or tactile perception. The 2 intermediate groups presented different aspects of DPN: one showed mostly DPN symptoms and the other showed the incipient vi-bration impairment, callus and crack formation, and foot arch alteration. The fourth group showed more severe foot and DPN conditions, including ulceration and amputation, ab-sence of vibration and tactile perception (irrespective of how many compromised foot areas), and worse foot deformities and callus and crack formation.
a11111
OPEN ACCESS
Citation:Sacco ICN, Suda EY, Vigneron V, Sartor CD (2015) An 'Importance' Map of Signs and Symptoms to Classify Diabetic Polyneuropathy: An Exploratory Data Analysis. PLoS ONE 10(6): e0129763. doi:10.1371/journal.pone.0129763
Academic Editor:Hamid Reza Baradaran, Iran University of Medical Sciences, IRAN, ISLAMIC REPUBLIC OF
Received:January 30, 2015
Accepted:April 24, 2015
Published:June 15, 2015
Copyright:© 2015 Sacco et al. This is an open access article distributed under the terms of the Creative Commons Attribution License, which permits unrestricted use, distribution, and reproduction in any medium, provided the original author and source are credited.
Data Availability Statement:All relevant data are available via Figshare athttp://dx.doi.org/10.6084/m9. figshare.1375378.
Conclusion
Vibration perception was more informative than tactile sensitivity in discriminating early DPN onset because its impairment was evident in more groups. Symptoms and callus and cracks did not discriminate the severity status and should be interpreted in association with other clinical variables. Reconsideration of the current screening techniques is needed to clinically determine the early onset of neuropathy using tactile perception.
Introduction
Diabetic polyneuropathy (DPN) remains a challenge for patients and clinicians. Early diagno-sis is recommended and is the key factor for a better prognodiagno-sis [1], but there are few theoretical and clinical studies dedicated to this task. DPN has an insidious and non-homogeneous mani-festation, making it difficult to identify its onset [2]. Most attention is given to patients with a high risk of ulcer formation, in whom the disease is usually already considered severe. Less at-tention is given to patients with mild disease severity but who, long before ulceration and am-putation occur, are already undergoing tissue and nerve damage. Although the International Consensus on the Diabetic Foot [1] pays great attention and recommends specific tests to iden-tify patients at risk for foot ulceration, individuals with different levels of impairment should also be targets of preventive health actions to try to avoid the devastating consequences of DPN.
The most common available tools used for clinical diagnosis of DPN are validated question-naires for the identification of specific signs and symptoms, physical examination of the foot, and sensorial tests that assess neurological impairments [1–4]. The somatosensorial modalities frequently assessed and recommended by the International Consensus on the Diabetic Foot for DPN detection are pressure sensation under the plantar surface, tested with 10-g Semmes-Weinstein monofilaments [5], and vibratory perception, tested with a biothesiometer or 128-Hz tuning fork [6,7]. Particularly, the perception of 10-g monofilament has a high repro-ducibility and specificity and may be used to predict ulceration and amputation risks [8,9]. A set of common DPN symptoms, such as tingling, burning, numbness, and prickling, can be asked systematically of patients using validated questionnaires to detect impairments in small fibers [10]. A physical examination of the foot to detect dry skin with crack or callus formation may indicate associated autonomic neuropathy that also predisposes to ulceration [10,11]. In-spection for foot deformities, such as claw or hammer toes, hallux valgus, and low or high foot arches, are also important because these structural alterations predispose foot areas to excessive loads and tissue breakdown [12]. Although electroneuromyography is the gold standard for DPN diagnosis, when aiming to improve clinical assessment, information about clinical DPN-related variables is desirable to prevent the patient’s exposure to an uncomfortable and invasive procedure.
Currently available tools and questionnaires used to classify DPN severity [13–18] do not necessarily make clear what this pool of DPN-related variables mean when different associa-tions between them are made in a clinical setting. Because the disease manifestation is hetero-geneous among patients, it is difficult to classify the disease status, and different associations among those DPN-related variables may have diverse meanings. In addition, each variable may need to have a different weight in the diagnosis and classification of DPN severity. Using a simple sum of DPN-related variables commonly used in questionnaires [13,15–17] may under-or overestimate the disease status. How impunder-ortant is each clinical variable in the DPN diagnosis Competing Interests:The authors have declared
and classification? A better understanding of these associations and their importance would contribute to disease prevention by recognizing clusters of patients according to DPN status. Improving patient classification is important not only for researchers, where it is crucial to have homogeneous groups when investigating other parameters, but also for clinicians who can then choose the most appropriate care for every patient and, most importantly, to detect early impairments. An appropriate and deeper analysis can indicate the most important vari-ables related to each cluster of patients and therefore provide a new approach to classify DPN severity.
Patients with differing levels of impairment were the focus of our study in which we aimed to determine among a composite of common signs and symptoms of DPN, different cluster groups of patients. We also sought to identify the most important DPN-related variables that can discriminate between clusters, thus representing the most informative variables.
Proposed Qualitative Data Analysis
Participants
Patients were recruited from 3 settings: (1) a diabetes mellitus ambulatory medical care unit lo-cated in a regional hospital, (2) the National Association of Diabetes, and (3) a primary care center of the School of Medicine of the University of Sao Paulo. A total of 193 patients were included in this study (Table 1, females 53.9%). All procedures were approved by the School of Medicine Ethics Committee, University of Sao Paulo (protocol 0305/08; CAAE—
0131.0.015.000–10), and the participants gave written informed consent.
The eligibility criteria were patients who were 45–65 years of age and had diabetes mellitus type 1 or 2, body mass index ranging 18.5–29.9 kg/m2(normal and overweight classifications), and no partial or total foot amputation. Patients were not selected if they had other neurologi-cal or orthopedic impairments not caused by DPN, major vascular complications, or severe nephropathy.
Clinical assessment
Symptoms of DPN were assessed based on the standardized questionnaire of the Michigan Neuropathy Screening Instrument [19]; of the 15 questions, we included 10 that were consid-ered the most specific for DPN identification. The foot physical examination was performed vi-sually to identify the presence of common signs and structural alterations that develop with DPN, such as callus, cracks, hallux valgus, hammer toes, claw toes, cavus or flat foot. Any histo-ry of foot ulceration or amputation was also questioned.
Tactile perception was assessed with Semmes-Weinstein monofilament of 5.07/10 g applied to a non-callused site under 4 areas of both feet (total of 8 foot areas): plantar surface of the dis-tal phalanx of the hallux and the first, third, and fifth metatarsal heads. The examiner applied the stimulus arrhythmicially and in a random order, the patient was asked to report the areas where the stimulus was felt [5,6].
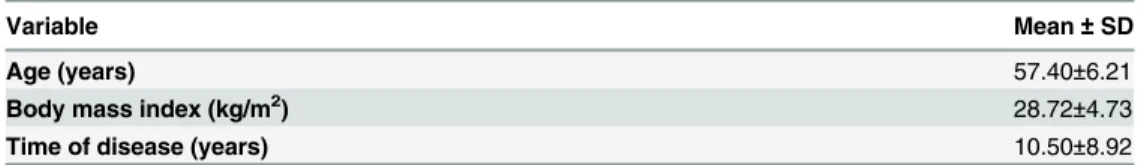
Table 1. Sample demographic and anthropometric data.
Variable Mean±SD
Age (years) 57.40±6.21
Body mass index (kg/m2) 28.72±4.73
Time of disease (years) 10.50±8.92
Vibration perception was assessed by a timed method, according to Perkins et al [6], with a 128-Hz tuning fork applied bilaterally to the bony prominence of the interphalanx joint of the hallux. The patient reported when the perception of the vibration was not felt anymore. The ex-aminer then noted the time (in seconds) that vibration sensation diminished beyond the exam-iner’s perception in the hand holding the tuning fork. Under 10 seconds was considered normal, and longer than 10 seconds was considered diminished. Perception was considered ab-sent if the patient did not report feeling the vibration.
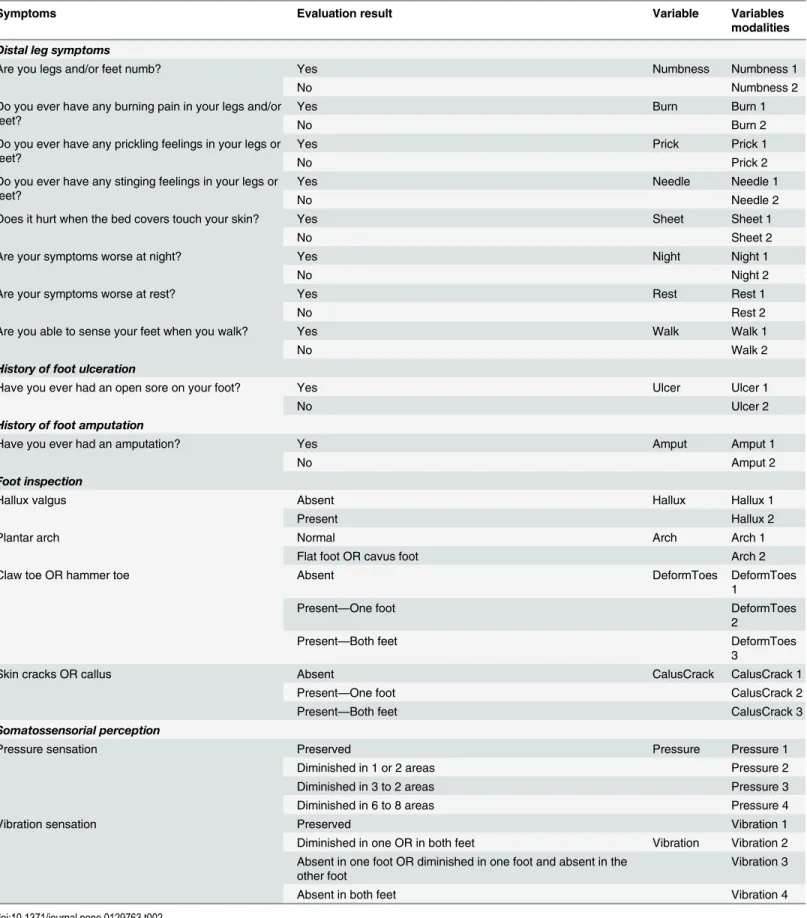
All clinical tests and exams (Table 2) were performed by the same trained assessor. We transformed the patient’s evaluated characteristics into categorical variables to allow mathematical analysis (Table 2) and determined a set of modalities for each variable. For the symptoms, history of foot ulceration and foot amputation, and hallux valgus, 2 modalities were established: yes (when present) or no (when absent). Plantar arch was classified as normal or cavus/flat. Claw or hammer toes and callus or cracks were classified in 3 modalities: absent, present in 1 foot, or present in both feet.
Tactile and vibration sensitivity were divided into 4 modalities. For tactile perception, we used the following classification: preserved, diminished in 1 or 2 areas, diminished in 3 to 5 areas, diminished in 6 to 8 areas. Vibration perception was classified as preserved, diminished in 1 or both feet, absent in 1 foot or diminished in 1 foot and absent in the other foot, and ab-sent in both feet.
All of the variables included in our analysis are described in more detail inTable 2.
Factorial correspondence analysis and multiple correspondence
analysis
The multiple correspondence analysis (MCA) is a type of factorial analysis capable to analyze observations described by nominal variables. Each categorical DPN-related variable comprises several levels, and each level is coded by a binary value (seeTable 2). For instance, hallux valgus is one nominal variable with 2 levels (Table 2). The variable toe deformity will be '0 1' and '1 0' in the other case. MCA can accommodate with quantitative variables by recording them as bins. A score of -1 to +1 could be recorded by a nominal variable with 3 levels:<-0.5, between -0.5 and +0.5, and>+0.5. Algebraically MCA can be seen as a generalization of principal com-ponent analysis when the variables to be analyzed are qualitative instead of quantitative, i.e. when the matrix to be analyzed is an indicator matrix (i.e. a matrix with entries of 0 or 1), a complete disjunctive table, or a Burt table [20]. The additional binary columns created artifi-cially for each variable induce additional dimensions, which is of uppermost interest for clus-tering the data.
Like any ordination method, MCA's purpose is to find the best summary in a space of re-duced dimension which consists of a small number of axes that maximizes the projected inertia of the cloud of data points.
Table 2. Symptoms and signs assessment, qualitative DPN-related variables for the study and variables modalities.
Symptoms Evaluation result Variable Variables
modalities
Distal leg symptoms
Are you legs and/or feet numb? Yes Numbness Numbness 1
No Numbness 2
Do you ever have any burning pain in your legs and/or feet?
Yes Burn Burn 1
No Burn 2
Do you ever have any prickling feelings in your legs or feet?
Yes Prick Prick 1
No Prick 2
Do you ever have any stinging feelings in your legs or feet?
Yes Needle Needle 1
No Needle 2
Does it hurt when the bed covers touch your skin? Yes Sheet Sheet 1
No Sheet 2
Are your symptoms worse at night? Yes Night Night 1
No Night 2
Are your symptoms worse at rest? Yes Rest Rest 1
No Rest 2
Are you able to sense your feet when you walk? Yes Walk Walk 1
No Walk 2
History of foot ulceration
Have you ever had an open sore on your foot? Yes Ulcer Ulcer 1
No Ulcer 2
History of foot amputation
Have you ever had an amputation? Yes Amput Amput 1
No Amput 2
Foot inspection
Hallux valgus Absent Hallux Hallux 1
Present Hallux 2
Plantar arch Normal Arch Arch 1
Flat foot OR cavus foot Arch 2
Claw toe OR hammer toe Absent DeformToes DeformToes
1
Present—One foot DeformToes
2
Present—Both feet DeformToes
3
Skin cracks OR callus Absent CalusCrack CalusCrack 1
Present—One foot CalusCrack 2
Present—Both feet CalusCrack 3
Somatossensorial perception
Pressure sensation Preserved Pressure Pressure 1
Diminished in 1 or 2 areas Pressure 2
Diminished in 3 to 2 areas Pressure 3
Diminished in 6 to 8 areas Pressure 4
Vibration sensation Preserved Vibration 1
Diminished in one OR in both feet Vibration Vibration 2 Absent in one foot OR diminished in one foot and absent in the
other foot
Vibration 3
Absent in both feet Vibration 4
associated with these 2 levels are similar. Further, a subset of modalities will be closer to a sub-set of individuals that have chosen these modalities than a group of individuals that have not.
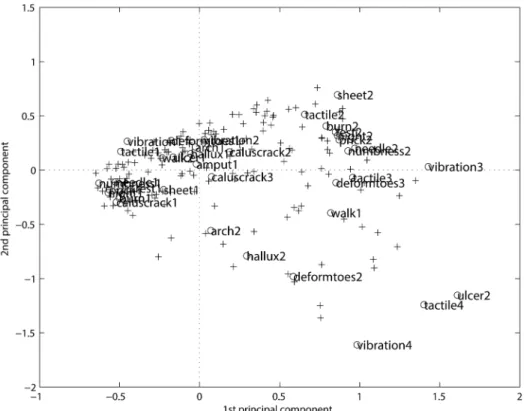
From the MCA analysis ofTable 2, it is possible to represent simultaneous rows and col-umns, i.e. of individuals ('+') and variables ('o'), in a space of reduced dimensions, as shown in Fig 1. TheFig 1separate the first modalities of the variables, clustered on the left negative side from the second and third modalities on the right positive side. The positive side gives the re-verse pattern with respect to the negative side. As the modalities are classified according to some (irregular) scale, the progression from level 1 (the best) to the worst (level 3, or 4, or 5, de-pending on the modality) is clearly visible. But the clusters are not clear, as well as the associa-tion among patients and symptom categories.
MCA is a linear projection method and provides several 2-dimensional maps. It is therefore necessary to consider several cards at once if the categories are more or less represented, and it is not always easy to deduce relevant conclusions on the proximity between the categories. In addition, related modalities should be projected onto neighboring points, but frequently distor-tion due to the linear projecdistor-tion affects the visualizadistor-tion. Therefore, the representadistor-tion of the information provided by this classification is often unsatisfactory.
A visual tool that would both organize the neighboring classes together and explain the lay-out of these classes in the input space could greatly improve the interpretation of classifications. A classification method is often coupled with a factor analysis, but the resulting solution space is artificially inflated, underestimating seriously the percentage of inertia explained by the first dimension, which makes projections on the factorial plans and their interpretation risky. Fig 1. The MCA representation.The projection on the first 2 axes (29%) and 2 (17%) represents only 46% of the explained inertia fromTable 2. The‘+’input is for the rows (i.e. patients) and the‘o’input is for the columns (i.e. symptoms).
From MCA to Kohonen representation
When standard linear mappings are not suitable due to the nonlinear structure of the data, one can try to use artificial neural networks because they are intrinsically nonlinear such as the Koho-nen algorithm [23], which is widely used for data analysis. See also [3,4,5,23,24], where the method is fully described and explained. The Kohonen algorithm, also called Self-Organizing Maps (SOM) [24], is used to group and rearrange the observations like any classification method [25] but offers the originality(i)to visualize the neighborhood structure between classes(ii)to duplicate the topology of the input space. The main tool is a network made up byn×n units ar-ranged following a 2-dimensional grid for which each unit isucharacterized by a“code-vector”
c_uwith the same dimension as the input space. Consider an array ofNobservations where each individual is described byqqualitative variables. The estimation of the code vectors, an unsuper-vised form of statistical learning, is not addressed in this paper. It is supposed to be successfully performed and the“natural”structure inherent in the input date captured. The Kohonen net-work maps the input vectors onto a discrete map with 2 dimensions in which patterns close to one another are topologically ordered. At the end, each individual is assigned by a nearest-neigh-bor algorithm to the classuif the code vectorc_u the closest among all the code vectors in the
sense of the Euclidean distance.
The main property of the Kohonen algorithm is the topology conservation of the input space: the first and raw result we get after learning is that close observations are associated with the same class or close classes as defined in the neighborhood in a Kohonen network. The re-sulting classification can be considered as a good starting point for further development.
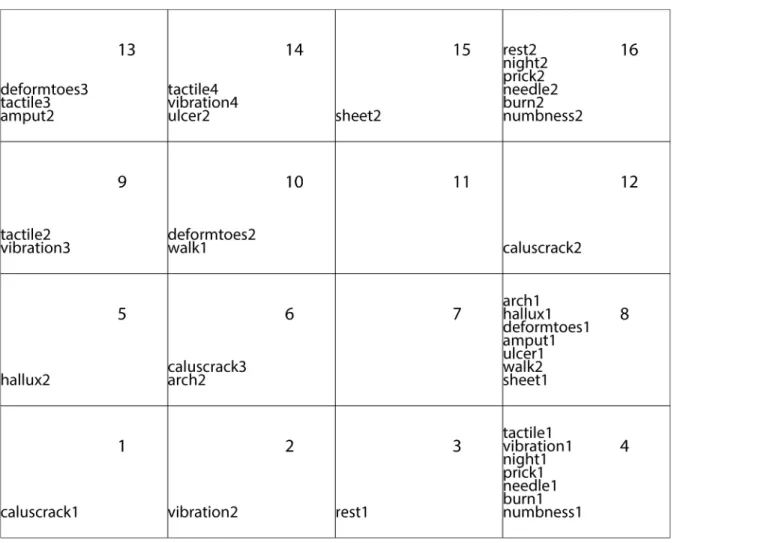
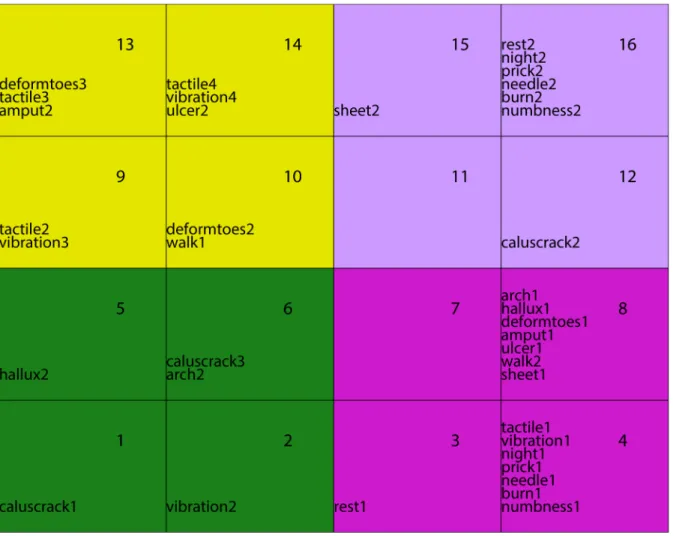
The data matrix is theBurttable [25] obtained by the inner product of the previous binarized data table. The Burt table has one column and one row for each level (category) of each categori-cal variable. After the neural model training, the units of the network are the representative of the rows of the Burt matrix and topologically organized as a classification of all the modalities, re-specting the topology-preserving constraint on related modalities belonging to the same class or to neighboring classes, which is easy to visualize and can be further clustered into macro-classes. Fig 2represents the result of the Kohonen algorithm applied to the DPN data. It is easy to see that the“good”modalities (level 1) aremainlygrouped together in the bottom right-hand cor-ner followed by the“intermediate”modalities (level 2), in the top left-hand corner. The“bad”
modalities (level 3) are displayed in the right-hand corner. There are one empty class and one with only one“good”variable that separate roughly the best modalities from the worst ones.
When comparing the map inFig 2with the projection inFig 1provided by MCA, we guess similarities in the global display. The first axis of the MCA opposes the best modalities (on the bottom) to the worst ones (on the top) but with a loss of information (only 46% of explained in-ertia). It is necessary to consider the first 9 axes to keep more of the three-quarters of the total inertia. The transition inFig 1from level 1 to level 3 is evident, but the clusters are not clear. Some contradictory conclusions could be even observed when examining the further axes.
In the following, we show (1) how to perform a robust classification based oncategorical in-formation, (2) how to visualize the classes and their differences and homogeneities, and (3) how to put in evidence the most explanatory variables.
Two classification levels
classifications using the Ward distance [26]: one composed of micro-classes (Kohonen classes) and the other of macro-classes that group together some of the micro-classes. To visualize this 2-level classification, we assigned each macro-class a color or gray level (Fig 3). This double classification offers the possibility to visualize at a macro level the main general features and at a micro level to zoom on the attributes of more local embedded phenomena, especially the path to go from one class to another. Moreover, macro-classes produce connected areas in the grid organization, which confirms the topology-preserving properties of the map. A represen-tation of the micro-classes grouped together to constitute 4 macro-classes is givenFig 3. Even-tually, some classes may be empty.
Analysis of the classes: discrimination and homogeneity
After the classes have been formed, any standard criterion can be computed to measure the inter- and intraclass variances,i.e. to measure respectively theintra-cluster homogeneity,inter -cluster separability [24]. To improve visual inspection of the grid topology, we propose some graphical tool for visualizing the distance between the clusters.
The standard representation of the (square) grid is a regular organization of the units as in Fig 3, but the code vectors draw aq-dimensional surface with irregular distances between the classes. This deviation between the representation and the mathematical fact can source Fig 2. Repartition of the 39 modalities on the Kohonen map with 500 iterations.
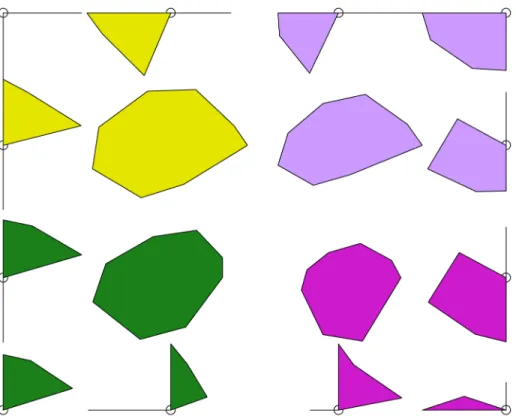
confusion in the interpretation. The weakness of the representation lie in the missing visualiza-tion of the distances between classes. This visualizavisualiza-tion would help to prevent misleading inter-pretation and would explain the discrimination between the classes. For this we modelize each micro-class by an octagon. By convention, the larger it is, the closer the unit is to its neighbors. Therefore, clusters are regions in which neighbor octagons tend to be large and frontiers are re-gions which largely do not intersect (Fig 4). In general, we can observe that the boundaries of macro-classes coincide with greater distances between classes, and this observation confirms the relevance of the second level of classification. On the oppposite, if a boundary is produced between two small distance classes, this means that the second classification level merges the two sub-groups into a single group and that the path from one to another is continuous. It points out that we might probably consider a hierarchical classification with less classes.
The decision of grouping the sample in a determined set of macro-classes was established according to the author’s purpose of detecting early stages of DPN manifestation and the main characteristics of this progression rather than just identifying the absence or presence of DPN. Therefore, an extensive data observation was performed to find the best grouping criteria. Using the Kohonen map with the represented distances between macro-classes (Fig 4) and the cluster graph (Fig 5), we can observe that 4 macro-classes or large groups could be identified and could represent different DPN stages or conditions.
Fig 3. Macro-classes grouping the modalities into 4 easy-to-describe classes.
Fig 4. Representation of the distances in the Kohonen map.The gaps coincide with the fontiers of the macro-classes (colored).
doi:10.1371/journal.pone.0129763.g004
Fig 5. Hierarchical classification.The y axis indicates the macro-classes that are represented in Figs2 and3.
The first macro-class (group) that was identified presented the common characteristics of absence of DPN symptoms, absence of foot deformities, absence of callus and cracks, and pre-served tactile and vibration perception, therefore representing a healthy group without any sign of DPN (Fig 4, green).
In the second macro-class (group), all the symptoms of DPN, when present, were grouped together, except for the absence of feeling the feet touching the ground while walking. In addi-tion, callus and cracks were present and vibration perception was absent for 1 foot only, indi-cating a mild neuropathy (Fig 4, magenta).
The third macro-class (group) was characterized by a further worsening of vibration percep-tion and an absence of callus and cracks or their presence in both feet, suggesting those particu-lar variables are not representative of DPN aggravation (Fig 4, violet).
Finally, the fourth macro-class (group) clearly represents the worst DPN condition, being characterized by absence of vibration perception in both feet, foot deformities, history of foot amputation and ulceration, and interestingly, absence of tactile perception regardless of being in a small portion of one foot or on all plantar surfaces of both feet (Fig 4, yellow).
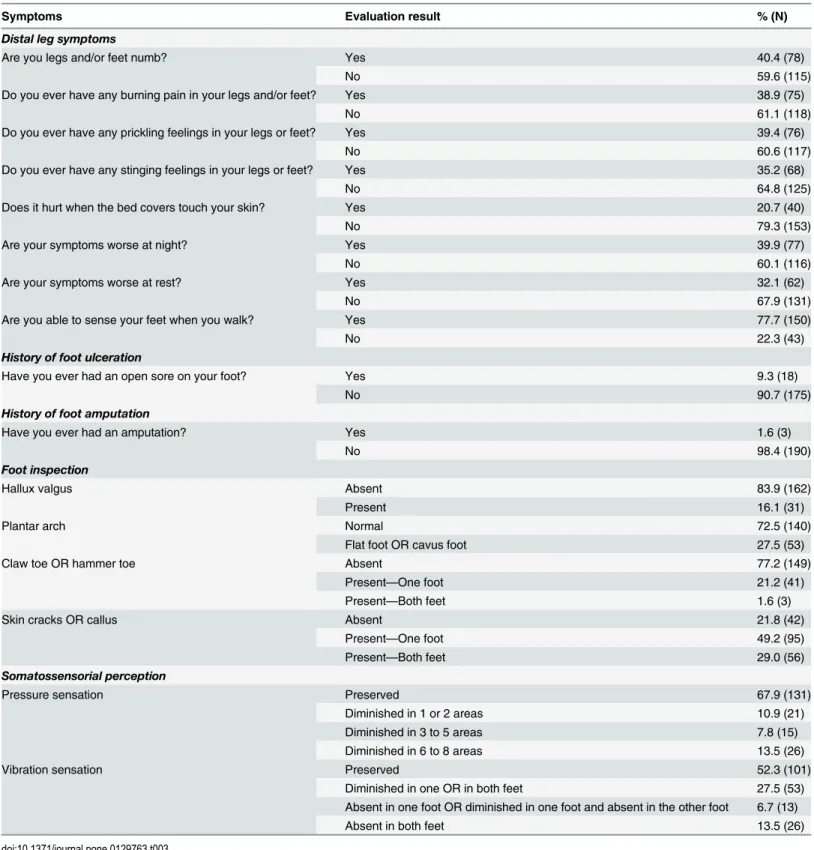
Table 3shows the proportion of patients that were allocated in each of the variable modali-ties that composed the MCA model.
Discussion
Our study provides a satisfactory overview of the distribution of the most common signs and symptoms that are assessed following the International Consensus on the Diabetic Foot. In ad-dition, it was possible to determine that most of the symptoms do not discriminate between DPN severity statuses, except for the absence of sensation in the feet while walking. Tactile sen-sitivity could not discriminate the early stages, raising some questions about the importance of 10-g monofilament screening for preventive actions. In contrast, vibration perception was one of the most important variables that discriminated different disease statuses and macro-classes. Foot inspection is an important aspect to be addressed but could also not discriminate the se-verity of DPN, possibly because calluses, cracks, and toes deformities can be present before dis-ease manifestation or even without a diabetes diagnosis.
The 4 groups we observed had very different main characteristics. It was possible to identify a group that was completely healthy, without any indication of DPN manifestation or foot al-terations. The remaining groups were characterized by a progressive worsening of vibration perception, but not a worsening of the DPN-related symptoms and tactile perception. The two intermediate macro-classes were characterized by different aspects of DPN, one mostly by the symptoms of DPN and the other mainly by the insipient vibration impairment. The fourth macro-class was characterized by the DPN-related variables that indicate a more severe feet condition, such as history of ulceration and amputation, absence of vibration and tactile per-ception, and worse feet deformities.
Considering the variables that represent the absence of DPN (preserved tingling, burning, numbness, prickling, and tactile and vibration sensitivity), they were all grouped together in the same macro-class. Thus, the MCA together with the Kohonen methods were successful in discriminating the known conditions of the diabetes status, before and after DPN diagnosis.
Table 3. Frequency distribution of patients that were allocated in each of the DPN related variables modalities.
Symptoms Evaluation result % (N)
Distal leg symptoms
Are you legs and/or feet numb? Yes 40.4 (78)
No 59.6 (115)
Do you ever have any burning pain in your legs and/or feet? Yes 38.9 (75)
No 61.1 (118)
Do you ever have any prickling feelings in your legs or feet? Yes 39.4 (76)
No 60.6 (117)
Do you ever have any stinging feelings in your legs or feet? Yes 35.2 (68)
No 64.8 (125)
Does it hurt when the bed covers touch your skin? Yes 20.7 (40)
No 79.3 (153)
Are your symptoms worse at night? Yes 39.9 (77)
No 60.1 (116)
Are your symptoms worse at rest? Yes 32.1 (62)
No 67.9 (131)
Are you able to sense your feet when you walk? Yes 77.7 (150)
No 22.3 (43)
History of foot ulceration
Have you ever had an open sore on your foot? Yes 9.3 (18)
No 90.7 (175)
History of foot amputation
Have you ever had an amputation? Yes 1.6 (3)
No 98.4 (190)
Foot inspection
Hallux valgus Absent 83.9 (162)
Present 16.1 (31)
Plantar arch Normal 72.5 (140)
Flat foot OR cavus foot 27.5 (53)
Claw toe OR hammer toe Absent 77.2 (149)
Present—One foot 21.2 (41)
Present—Both feet 1.6 (3)
Skin cracks OR callus Absent 21.8 (42)
Present—One foot 49.2 (95)
Present—Both feet 29.0 (56)
Somatossensorial perception
Pressure sensation Preserved 67.9 (131)
Diminished in 1 or 2 areas 10.9 (21)
Diminished in 3 to 5 areas 7.8 (15)
Diminished in 6 to 8 areas 13.5 (26)
Vibration sensation Preserved 52.3 (101)
Diminished in one OR in both feet 27.5 (53)
Absent in one foot OR diminished in one foot and absent in the other foot 6.7 (13)
Absent in both feet 13.5 (26)
words, having more than 1 symptom does not mean a worse condition because they all repre-sent the same phenomena of nerve impairment.
Only 1 symptom was clustered in the more severe group of patients, which was the absence of sensation of the foot touching the floor while walking, indicating not only the absence of tac-tile sensitivity but also the absence of pressure and thermal perception and thus reflecting a more severe neural impairment. This symptom was clustered apart from all others and repre-sents important information to identify patients with a worse condition.
It is reasonable to think that if a patient loses sensation in more than 1 plantar area, it would represent a worse condition of DPN. Our analysis showed that irrespective of the number of compromised plantar areas, patients were grouped in the same macro-class. This was an unex-pected result and raises some concerns about this method. Although it has been demonstrated that not feeling the 10-g monofilament in a specific plantar area represents 7 times more risk for plantar ulceration [8], this result is not sufficient to determine how early in the disease the sensitivity is being compromised. If a loss in 1 area only is enough to group patients in the most severe neuropathy condition, this might not be a good test to perform when we are inter-ested in early detection and preventive actions. We tinter-ested 1 more area (head of third metatar-sal) than the number recommended by the Consensus [5] (around the first and fifth metatarsal heads and distal hallux plantar surface). The 10-g monofilament evaluation is a good tool to as-sess the loss of protective sensation related to diabetic neuropathy [5] and has high reproduc-ibility and specificity. The increased pressure threshold assessed by this monofilament has been demonstrated to accurately predict patients who already have a plantar ulcer or its immi-nent formation [8]. Since this relationship has been established, the recommendation for clini-cians to use 10-g monofilament to identify patients at risk for ulcer formation has spread and is part of the practical guidelines for diabetic foot prevention [5]. Sosenko et al [8] suggested that the cutoff values that we found to be effective for the detection of foot ulcer patients may not be optimal for foot ulcer prevention programs, because the sensitivity impairments that may have started long before would not have been detected by the 10-g monofilament. As our results also suggest, pressure thresholds lower than 10 g should be tested for early detection in patients with a lower degree of sensitivity losses. Of course, in those cases, attention should be paid to skin conditions, such as callus and thickening of the plantar surface, which could highly affect the test results. Still, assessment for early identification of loss sensation should not be disregarded.
Vibration perception loss is typical in DPN progression, and in our results, it was related to 3 of the 4 macro-classes. It is important to highlight that our vibration perception test was more detailed than the one recommended by the Consensus. We assessed not only for the pres-ence or abspres-ence of the stimulus but also for its decreased perception. And indeed, it was possi-ble to discern a relationship between the degree of vibration loss and most of the severity groups. If we consider only the absence or presence of vibration perception, it behaves like pressure sensation and would be related only to the more severe macro-class of patients. Thus, a more detailed vibration perception assessment is important in all diabetic patients and is ca-pable of showing early stages of the disease.
disease and not necessarily pathological. We conclude that identifying those alterations without considering other variables will not help to identify DPN status. But our results also showed that if those deformities are present in the most severe patients, they are clearly associated with the severity of the DPN.
Other very important foot alterations related to the disease are callus and crack formations. Although these alterations can also expose the foot to increased tissue loading and contribute to infections and ulcer development, this DPN-related variable did not help in discriminating macro-classes of DPN severity. Because worse and preserved feet are grouped together (macro-class 3), those variables cannot discriminate the severity status.
As expected, amputation and ulcer formation were associated in the macro-class with more severe patients. The absence of sensation of the foot touching the floor during walking was also in the same macro-class as well the absence of vibration and tactile perceptions in all plantar areas, which are the most typical symptoms and signs of DPN.
This study has some limitations. Unfortunately, it was not possible to include other assess-ments such as ankle reflex and hemoglobin A1c levels, because those data were unavailable for most of the patients included in this study. Because our intention with this work was to im-prove the interpretation of the clinical assessment by extracting, from a combination of DPN-related variables, qualitatively important information that most clinicians have access to, we did not use electroneuromyography data.
Taking into account the current literature and the Consensus recommendation, we con-clude that most attention is given to patients with imminent foot ulceration rather than at-tempting to develop and improve assessment techniques to detect early impairments. The main concern in those studies is detecting the risk of foot ulceration, when an effort should also be made to detect patients at risk of developing DPN. The main contribution of this study is questioning the traditional method of the 10-g pressure perception threshold as a screening technique for early detection when it is already too late, and the vibration perception is far more discriminant. If different monofilament sizes are used, they could probably better dis-criminate the disease status, as the vibration tests do. In addition to the considerable subjectivi-ty of both methods of assessing sensitivisubjectivi-ty, they are unquestionably clinical resources that can contribute to early detection of DPN. Future studies should focus on developing assessment strategies and tools that better detect early foot changes and instilling this habit in healthcare providers.
We propose a general methodology to analyze multidimensional data when the observa-tions are described by clinical variables. Many other techniques can be combined to improve this analysis and its interpretation, in particular a hierarchical classification of the macro-classes with a proposed typology of the macro-classes that is easier to interpret. The Kohonen maps we obtained are less precise than classical MCA projections, but they summarize better the var-ious relationships (attractions and repulsions) between the DPN-related variables and their modalities. Even if simultaneous representation of the various modalities and the individuals does not have a rigorous rationale, it nevertheless gives good results. These methods have the advantage of producing on the one hand a Kohonen map comparable with a traditional MCA projection and on the other hand a classification of the individuals due to the combination of the variables. Moreover, the method is particularly economical regarding computing time, which is a considerable advantage compared with classical methods such as hierarchical classification.
groups them into macro-classes (groups) according to some chosen variables. We could identi-fy the main groups that were formed and choose the most meaningful levels (separations or groups) according to the information being sought.
Conclusions
Patients could be grouped in different macro-classes that represent different severities of the disease, including intermediate groups between healthy and severe conditions. The variables that most discriminated between groups were vibration perception rather than the traditional tactile sensitivity, pointing to a need for reconsideration of the current screening techniques. Calluses and cracks also do not discriminate severity status and should be interpreted together with other clinical DPN-related variables. The proposed methodology was shown to be a valu-able tool to extract information regarding the specific contribution of each varivalu-able and to com-pare its discriminant power alongside other variables.
Acknowledgments
We are thankful for Centro de Saúde Escola Samuel Barnsley Pessoa for providing the patients. We would like to thank Editage (www.editage.com) for English language editing.
Author Contributions
Conceived and designed the experiments: ICNS CDS VV EYS. Performed the experiments: ICNS CDS VV EYS. Analyzed the data: VV. Contributed reagents/materials/analysis tools: VV. Wrote the paper: ICNS CDS VV EYS.
References
1. Dyck PJ, Albers JW, Andersen H, Arezzo JC, Biessels GJ, Bril V, et al. (2011) Diabetic Polyneuropa-thies: Update on Research Definition, Diagnostic Criteria and Estimation of Severity. Diabetes Metab Res Rev.
2. Asad A, Hameed MA, Khan UA, Ahmed N, Butt MU (2010) Reliability of the neurological scores for as-sessment of sensorimotor neuropathy in type 2 diabetics. J Pak Med Assoc 60: 166–170. PMID: 20225769
3. Forouzandeh F, Aziz Ahari A, Abolhasani F, Larijani B (2005) Comparison of different screening tests for detecting diabetic foot neuropathy. Acta Neurol Scand 112: 409–413. PMID:16281925
4. England JD, Gronseth GS, Franklin G, Miller RG, Asbury AK, Carter GT, et al. (2005) Distal symmetric polyneuropathy: a definition for clinical research: report of the American Academy of Neurology, the American Association of Electrodiagnostic Medicine, and the American Academy of Physical Medicine and Rehabilitation. Neurology 64: 199–207. PMID:15668414
5. Bakker K, Apelqvist J, Schaper NC, Board IWGoDFE (2012) Practical guidelines on the management and prevention of the diabetic foot 2011. Diabetes Metab Res Rev 28 Suppl 1: 225–231. doi:10.1002/ dmrr.2253PMID:22271742
6. Perkins BA, Olaleye D, Zinman B, Bril V (2001) Simple screening tests for peripheral neuropathy in the diabetes clinic. Diabetes Care 24: 250–256. PMID:11213874
7. Perkins BA, Bril V (2003) Diabetic neuropathy: a review emphasizing diagnostic methods. Clin Neuro-physiol 114: 1167–1175. PMID:12842711
8. Sosenko JM, Kato M, Soto R, Bild DE (1990) Comparison of quantitative sensory-threshold measures for their association with foot ulceration in diabetic patients. Diabetes Care 13: 1057–1061. PMID: 2209302
9. Kumar S, Fernando DJ, Veves A, Knowles EA, Young MJ, Boulton AJ. (1991) Semmes-Weinstein monofilaments: a simple, effective and inexpensive screening device for identifying diabetic patients at risk of foot ulceration. Diabetes Res Clin Pract 13: 63–67. PMID:1773715
11. Boulton AJ (2004) The diabetic foot: from art to science. The 18th Camillo Golgi lecture. Diabetologia 47: 1343–1353. PMID:15309286
12. Veves A, Murray HJ, Young MJ, Boulton AJ (1992) The risk of foot ulceration in diabetic patients with high foot pressure: a prospective study. Diabetologia 35: 660–663. PMID:1644245
13. Gin H, Perlemoine C, Rigalleau V (2006) How to better systematize the diagnosis of neuropathy? Dia-betes Metab 32: 367–372. PMID:16977266
14. Feldman EL, Stevens MJ, Thomas PK, Brown MB, Canal N, Greene DA. (1994) A practical two-step quantitative clinical and electrophysiological assessment for the diagnosis and staging of diabetic neu-ropathy. Diabetes Care 17: 1281–1289. PMID:7821168
15. Moghtaderi A, Bakhshipour A, Rashidi H (2006) Validation of Michigan neuropathy screening instru-ment for diabetic peripheral neuropathy. Clin Neurol Neurosurg 108: 477–481. PMID:16150538
16. Meijer JW, Smit AJ, Sonderen EV, Groothoff JW, Eisma WH, Links TP. (2002) Symptom scoring sys-tems to diagnose distal polyneuropathy in diabetes: the Diabetic Neuropathy Symptom score. Diabet Med 19: 962–965. PMID:12421436
17. Lunetta M, Le Moli R, Grasso G, Sangiorgio L (1998) A simplified diagnostic test for ambulatory screen-ing of peripheral diabetic neuropathy. Diabetes Res Clin Pract 39: 165–172. PMID:9649948
18. Leese GP, Reid F, Green V, McAlpine R, Cunningham S, Emslie-Smith AM, et al. (2006) Stratification of foot ulcer risk in patients with diabetes: a population-based study. Int J Clin Pract 60: 541–545. PMID:16700850
19. MNSI (2011) Michigan Neuropathy Screening Instrument.
20. Andersen EB (1989) Introduction to the analysis of categorical data.: Springer.
21. Vigneron V, Petit E. (2008) The evaluation of the impact of the technology transfers from public labora-tories to private firms: the case of the french nuclear authority. Fuzzy Economic Review, 13(1).
22. Vigneron V, Petit S. (1999) Kohonen qualitative maps: application to the evaluation of r.& d. collabora-tions between public research laboratories and industrial firms. In ACSEG 99, Reus (Spain).
23. Kohonen T (1995) Self-organizing maps, Springer series in Information Sciences: Springer.
24. Ritter H, Martinetz T, Shulten K (1992) Neural computation and Self-Organizing Maps, an Introduction: Addison-Wesley.
25. Lebart L, Morineau A, Piron M (1995) Statistique exploratoire des données. Paris: Dunod.
26. Saporta G (1990) Probabilités, Analyse de données et Statistique: Tachnip.
27. Cowley MS, Boyko EJ, Shofer JB, Ahroni JH, Ledoux WR (2008) Foot ulcer risk and location in relation to prospective clinical assessment of foot shape and mobility among persons with diabetes. Diabetes Res Clin Pract 82: 226–232. doi:10.1016/j.diabres.2008.07.025PMID:18829126