CONSIDERATIONS REGARDING THE DEVELOPMENT OF ORGANIC
AGRICULTURE IN THE WORLD, THE EU-27 AND ROMANIA
Agatha POPESCU1, Cecilia POP2
1
University of Agricultural Sciences and Veterinary Medicine Bucharest, 59 Marasti, District 1, Zip code 011464, Bucharest, Romania, Phone: +40 213182564/232, Fax:+40213182888,
Email:[email protected] 2
University of Agricultural Sciences and Veterinary Medicine Iasi, 3 M.Sadoveanu Street, Iasi City, Romania, 700490, Phone: +40 232407514, Fax: +40 232260650, Email: [email protected]
Corresponding author: [email protected]
Abstract
The paper aimed to analyze the development of organic agriculture in the world, the EU and Romania, based on the statistical data for the period 2006-2010 and the index, share and comparison methods. Organic agriculture covers 34.04 Million ha at world level, of which 26.99 % in Europe and 32.08 % in Oceania. The largest areas in organic agriculture are in Australia, Argentina, the USA, Brazil, Spain, China and Italy. At world level, there are 1.6 million organic producers, over 63 % operating in Africa and Asia, especially in India, Uganda and Mexico. In 2010, organic food sales accounted for Euro 44.5 Billions of which 50 % in Europe. In the same year, the organic agriculture area increased by 20 % in the EU-27 and reached 9.01 million ha and continues to grow, representing 5.10 % of agricultural land. The larges areas in organic agriculture are in Spain, Italy, Germany and France. In the EU-27 there are 219,290 organic producers of which 40 % in Italy, Spain, Germany and Austria. In 2010, Romania’s area in organic agriculture was 300,205 ha, 2 times higher than in 2006. A number of 10,253 organic operators were registered in 2010, representing 4.67 %, of the EU number. The main organic products are cereals, vegetables, wine, honey, dairy products, representing a chance for Romania’s export on the EU market.
Key words: EU, organic agriculture, Romania, trends, world
INTRODUCTION
Organic agriculture especially is an alternative to traditional agriculture especially to the intensive one, aiming to assure food safety and health, environment protection, plant and animal welfare [4]. It supposes the elimination of chemicals use in agriculture, the assurance of Nitrogen into the soil by bacteria intensified activity, the use of manure and compost, reduction of excessive mechanization with a benefic effect on the physical soil properties [9].
On the other hand, organic agriculture is disadvantaged by the low productivity, higher production cost, but which could be
compensatedă byă aă higheră priceă foră “greenă food”ă[7, 8].
Organic agriculture has more and more supporters at international level both in the developed and developing countries, being regulated by principles and standards.
The EU has firmly sustained organic agriculture within C.A.P. and National Action
Plans of each member state, creating the institutional framework and standards which regulate the relationship between agriculture, environment, plant and animal welfare and human health.
development based on the statistical data and information provided by official authorities.
MATERIALS AND METHODS
In order to set up this paper, the following specific indicators were used: organic agriculture area at world level and its distribution by regions and in the top 10 countries, number of operators involved in organic agriculture and their distribution by country, world market development based on organic food sales and consumption value, organic agriculture area and number of organic operators in the EU-27 and Romania. The empirical data collected from various information sources were processed using Index, Share and Comparison methods, pointing out the growth or decline and also shares and the results allowed the adequate interpretation and the identification of the major trends.
RESULTS AND DISCUSSIONS
Organic agriculture at world level\
The organic agricultural land has been continuously increasing and in the period 2000-2010 it doubled its figure from 14.89 million ha in the year 2000 to 37.04 million ha in the year 2010. In 2010, the largest organic agricultural surfaces were in Oceania (32.80 %), Europe (26.99 %) and Latin America of world organic agricultural land (Table 1).
The highest growth of organic agricultural land was registered in Asia (46.33 times) and Africa (21.60 times) and between 2.14 and 2.50 times in Latin America, Europe and N. America.
Table 1.Evolution of world organic agricultural land by region in the period 2000-2010
Region 2000 2010 2010/2000
Million ha
% Million ha
% %
Africa 0.05 0.36 1.08 2.91 2,160.00
Asia 0.06 0.40 2.78 7.50 4,633.33
Europe 4.50 30.22 10.00 26.99 222.22
L.America 3.91 26.25 8.39 22.65 214.57
N.America 1.06 7.11 2.65 7.15 250.00
Oceania 5.31 35.66 12.14 32.80 228.62
Total world
14.89 100.00 37.04 100.00 249.42
Source: Organic World, 2012, [17].Own calculations
Organic agriculture is practiced in 160 countries of which 45 are in Europe. The share of organic land of the world agricultural area is very small, accounting just for 0.9 %.
In 2010, the top 10 countries with the largest organic agricultural land, in the decreasing order of their share in the world organic land, were: Australia, Argentina, the USA, Brazil, Spain, China, Italy, Germany, Uruguay and France, whose share together accounted for 72.60 % (Table 2).
The figures show that about 48.93 % is kept by the first there countries: Australia (32.39 %), Argentina (11.28 %), and the USA (5.26 %). Compared to 2009, in 2010 a number of 10 countries registered the highest growth of organic agricultural land: France, Poland, Spain, Bolivia, Turkey, Czech Republic, Portugal, Sweden, Germany and Macedonia.
Table 2.The top 10 countries with the largest organic agricultural land in 2010
Country Organic Agricultural
Land (million ha)
Share in world organic agricultural land
(%)
Australia 12.00 32.39
Argentina 4.18 11.28
USA 1.95 5.26
Brazil 1.77 4.77
Spain 1.46 3.94
China 1.39 3.74
Italia 1.11 3.75
Germany 0.99 2.67
Uruguay 0.93 2.51
France 0.85 2.29
Total 26.63 72.60
Total world 37.04 100.00 Source: FIBL/IFOAM Survey 2012 [19]. Own calculations.
In the period 2000-2010, the number of organic producers increased 5.33 times from 0.3 million in the year 2000 to 1.6 million in 2010.
Table 3.The top 10 countries with the highest share of organic agricultural land in total agricultural land in 2010
Country Share of organic
land in agricultural
land (%)
Country Share of organic land in agricultural
land (%) Falkland
Islands
35.9 Switzerland 11.4
Liechtenstein 27.3 Czech Rep. 10.5 Austria 19.7 Latvia 9.4 Sweden 14.1 Slovakia 9.00 Estonia 12.5 Italy 8.7 Source: Organic World, 2012, [17]
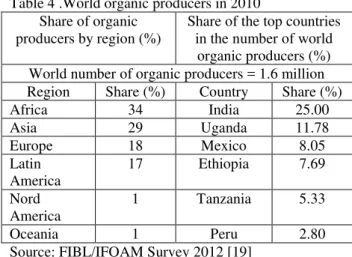
Most of them were in Africa (34 %) and Asia (29 %), but also in Europe (18 %) and Latin America (17 %) (Table 4). Taking into consideration the organic agricultural land, 34.04 million ha, and the number of 1.6 million producers, this means that the average size of organic farm is about 21.27 ha.
The highest number of organic producers is in India, Uganda, Mexico, Ethiopia, Tanzania, Peru, Turkey, Italy and Spain. The first three countries India, Uganda and Mexico have together 44.83 % of the world organic producers (Table 4).
Table 4 .World organic producers in 2010 Share of organic
producers by region (%)
Share of the top countries in the number of world
organic producers (%) World number of organic producers = 1.6 million Region Share (%) Country Share (%)
Africa 34 India 25.00
Asia 29 Uganda 11.78
Europe 18 Mexico 8.05
Latin America
17 Ethiopia 7.69
Nord America
1 Tanzania 5.33
Oceania 1 Peru 2.80
Source: FIBL/IFOAM Survey 2012 [19]
In 2010, the global turnover coming from marketed organic food and beverages accounted for Euro 44.5 billions, of which almost 90 % was carried out in the Northern hemisphere [15].
In 2010, global market of organic products turnover was 3.3 times higher than in 2000 (Euro 14.83 billions). The top 10 countries contributing together by 87.48 % to the world organic food sales are the USA, Germany, France, United Kingdom, Canada, Italy, Switzerland, Japan, Austria and Spain (Table 5).
Table 5.The share of the top 10 countries in the world organic food sales in 2010
Country % Country %
USA 45 Italy 3
Germany 14 Switzerland 3
France 8 Japan 2.24
United Kingdom
4 Austria 2.21
Canada 4 Spain 2.03
Source: OTA’săOrganicăIndustryăSurvey,ă2012ă[21]
According to Organic Trade Association Industry Survey, the most dynamic growth of organic food sales was registered in Germany, the sales of organic food increased 2.93 times from Euro 2,050 millions in the year 2000 to Euro 6,020 millions in the year 2010. In the USA, the sales growth was 3.09 times higher than in 2010 (USD 26,708 millions) compared to the year 2002 (USD 8,635 millions).
The value of organic food consumption, that is the expenditures paid by consumers in 2010 have continuously increased and varied from a country to another. A number of 10 countries are in the first positions based on the value of organic food consumption: Switzerland, Denmark, Luxembourg, Austria, Liechtenstein, Sweden, Germany, the USA, Canada and France (Table 6).
Table 6.The top 10 countries in the world based on the value of organic food consumption in 2010
Country E/capita Country Euro/capita Switzerland 153 Sweden 86 Denmark 142 Germany 74 Luxembourg 127 USA 65 Austria 118 Canada 57 Lichtenstein 100 France 55 Source: OTA’săOrganicăIndustryăSurvey,ă2012ă[21]
Table 7.The top 10 countries in the world with the highest share in the value of organic food consumption in 2010
Country % Country %
Denmark 7.20 Germany 3.50 Austria 6.00 Luxemburg 3.30 Switzerland 5.70 Netherlands 2.70 Sweden 4.10 Canada 2.50
USA 4.00 France 2.00
Source: OTA’săOrganicăIndustryăSurvey, 2012 [21]
Organic farming in the developing and transition countries
One third of world organic agricultural land, that is 12.5 million ha, are in the developing and transition countries, the most of land being situated in Latin America, Asia and Africa. The top 10 developing countries having the largest organic agricultural land are: Argentina, Brazil, China, Uruguay, India, Turkey, Mexico, Ukraine, Uganda and Peru. In these countries there are about 1.3 million producers, meaning that the average size of an organic farm in 9.61 ha, much smaller than the world average.
Organic agriculture in the EU
The organic agricultural land in the EU increased by 34.44 % in the period 2006-2010 from 6.7 million ha in 2006 to 9,016 million ha in 2010. In 2010, about 5.10 % of the EU agricultural land was in organic farming and the surface is continuously increasing in many EU member states (Table 8).
In 2010, the largest organic agricultural surfaces were in Spain (1,456 million ha), Italy (1,113 million ha), Germany (0.990 million ha), France (0.845 million ha), United Kingdom (0.699 million ha), Austria (0.543 million ha), Poland (0.521 million ha), Czech Republic (0.448 million ha) and Sweden (0.438 million ha), whose share together in
the EU-27 organic agricultural land was 73.51 %.
In the period 2006-2010, the highest growth of organic agricultural land was noticed in Bulgaria (5.46 times), Poland (2.28 times), Spain (1.97 times), Sweden (1.94 times), Romania (1.69 times), Belgium (1.67 times), Czech Republic (1.59 times), Estonia (1.54 times), France (1.52 times). However, in Italy, the Netherlands and Portugal, organic agricultural land declined by 3 %, 4.53 % and, respectively, 6.16 %.
Table 8. Organic agricultural land in the EU
Country 2006 2010 2010/2006
ha % ha % %
Austria 477,802 7.12 543,605 6.02 113.77
Belgium 29,308 0.43 49,005 0.54 167.20
Bulgaria 4,692 0.06 25,648 0.28 546.63
Cyprus 1,979 0.03 3,575 0.03 180.64
Czech Republic
281,535 4.19 448,202 4.97 159.19
Denmark 138,079 2.05 162,903 1.80 117.97
Estonia 72,886 1.08 112,972 1.25 154.99
Finland 144,667 2.15 169,168 1.87 116.93
France 552,824 8.24 845,442 9.37 152.93
Germany 825,539 12.30 990,702 10.98 120.00
Greece 302,264 4.50 309,823 3.43 102.50
Hungary 122,765 1.83 127,605 1.41 103.94
Ireland 39,947 0.59 47,864 0.53 119.81
Italy 1,148,160 17.12 1,113,740 12.35 97.00
Latvia 150,016 2.23 166,320 1.84 110.86
Lithuania 96,718 1.44 143,644 1.59 148.51
Luxemburg 3,630 0.05 3,720 0.04 102.47
Malta 20 0.00 24 0.00 120.00
Netherlands 48,425 0.72 46,233 0.51 95.47
Poland 228,009 3.39 521,970 5.78 28.92
Portugal 214,242 3.59 201,054 2.22 93.84
Romania 107,578 1.60 182,706 2.02 169.83
Slovakia 120,410 1.79 174,471 1.93 144.89 Spain 736,938 10.981 1,456,670 16.15 197.66
Sweden 225,431 3.36 438,693 4.86 194.60
United Kingdom
605,706 9.76 699,638 7.89 115.50
EU 27 3,706,401 100.00 9,016,093 100.0 134.44 Source: FIBL/IFOAM Survey 2012 [18,19]
The most numerous organic producers were in Italy (41,807) and Spain (27,877) in 2010. In 2006, the average size of organic farms in the EU-27 was 34 ha, compared to 11.9 ha in average per conventional farm. In 2010, an organic farm had in average 41 ha compared to 13 ha in conventional agriculture [9]. In Denmark, France and Luxembourg, the average size of an organic farm was smaller than in conventional agriculture, while in most of the EU countries the average farm size in organic farming is higher than in conventional agriculture.
In 2010, the EU-27 registered 219,290 organic producers of which 10 % in Italy, 10 % in Spain, 10 % in Germany and 10 % in Austria, while 1 % was recorded in each of the following countries: Bulgaria, Belgium, Hungary, Portugal, the Netherlands, and Slovakia. In the period 2006-2010, the number of the EU organic producers increased by 22.2 %. The highest growth was registered by Bulgaria (2.2 times), Czech Republic (2.6 times), Poland (1.2 times), and Sweden (1.1 times).
Italy, Germany and France are situated in the top 10 countries based on this criterion. Also, Austria, Sweden, Estonia, Switzerland, Czech Republic, Latvia, Slovakia and Italy are situated among the top 10 countries in the world based on the share of organic land in total agricultural land.
Germany, France, United Kingdom, Italy, Austria and Spain are among the top 10 countries based on organic food turnover. Also, Denmark, Luxembourg, Austria, Sweden, Germany and France are among the top 10 countries concerningă consumers’ă expenditures for organic food.
Organic agriculture in Romania has been developed in the recent years and mainly after the country access into the EU in 2007, when the legislative and institutional framework has had to align to the requirements.
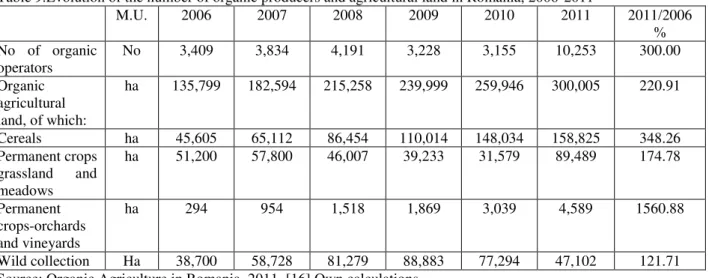
Organic agricultural land has increased 2.2 times from 135,799 ha in 2006 to 300,005 ha in 2011 of which the surface cultivated with cereals represented about 53 % grass land and meadows 29.82 %, orchards and vineyards 1,52 % and wild collection 15.66 % (Table 9). In 2011, in Romania a number of 10,253 operators were involved in organic agriculture, 3 times more than in 2006 (Table 9). Most of them are small farmers, having
subsistence farms of 20 ha or breeders of 3-5 cows, 3-53-5-100 sheep or 10 bee families. In 2012, the number of organic operators was 26,736, 2.6 times higher than in 2010 of the total number of organic operators, 26,390 are agricultural producers, 32 agriculture units, 103 processors and 211 traders.
About 33 % of organic agricultural land in Romania, that is 100,000 ha is arable land, representing about 1 % of arable land at country level. In 2011, organic agriculture contributed by 10 % to the increase of arable land. This was due to the financial support offered by the EU and government in relationship to the cultivated surface and crop, and livestock. The livestock grown in organic production system has declined for all the species, except goats, whose number increased 9.3 times, poultry whose livestock increased 5 times and bee families which doubled their number in the period 2006-2010 (Table 10).The decline of livestock was due to the lack of organized selling markets for organic products, high production costs, a relatively similar selling price as for the conventional agricultural products [9].
The average farm size in organic farming was 29.26 ha in 2011 compared to 39.83 in the year 2006.
Table 9.Evolution of the number of organic producers and agricultural land in Romania, 2006-2011
M.U. 2006 2007 2008 2009 2010 2011 2011/2006 % No of organic
operators
No 3,409 3,834 4,191 3,228 3,155 10,253 300.00
Organic agricultural land, of which:
ha 135,799 182,594 215,258 239,999 259,946 300,005 220.91
Cereals ha 45,605 65,112 86,454 110,014 148,034 158,825 348.26 Permanent crops
grassland and meadows
ha 51,200 57,800 46,007 39,233 31,579 89,489 174.78
Permanent crops-orchards and vineyards
ha 294 954 1,518 1,869 3,039 4,589 1560.88
Wild collection Ha 38,700 58,728 81,279 88,883 77,294 47,102 121.71 Source: Organic Agriculture in Romania, 2011, [16] Own calculations.
In 2011, 914.08 ha of which 511.04 ha in conversion and 403.04 ha organic certified surface belonged to organic vegetable growing. In 2011, organic vegetables productions accounted for 1,566.67 tones of which 11 tons (cauliflower, broccoli,
Table 10.Livestock in organic production system, Romania, 2006-2010
2006 2007 2008 2009 2010 2010/2006 %
Cattle 11,365 6,985 7,567 8,145 5,358 47.14
Dairy cows 8,236 4,889 4,297 4,303 2,332 28.31
Pigs 1,652 1,174 416 603 320 19.37
Sheep 86,180 59,680 121,175 51,470 18,883 21.91
Goats 117 215 4,296 4,738 1,093 934.18
Poultry 4,300 4,320 6,080 9,400 21,580 501.86
Bee families 30,796 37,260 52,599 59,414 64,836 210.53 Source: EuroStat, 2012, [20].
Organic fruits are produced on 3,149.41 ha orchards of which 1,538.8 ha for seed fruits, 240.19 ha for fruit bushes, 128.84 ha nut trees and 55.63 ha almond and nut trees.
Organic cereals (wheat and maize) and honey are the most important agricultural products besides vegetables and fruits. Romania is a major supplier of raw materials, being advantaged by the existence of fertile land suitable for organic farming. The share of the main organic products achieved in Romania is presented in Table 11.
Table 11.Processing of organic agricultural production in Romania
Agricultural product % Agricultural product
%
Fruits and vegetables 20 Dairy products (cheese, butter etc)
4
Tea, forest fruits, aromatic and spices herbs
19 Grain mill products
3
Bakery products 13 Meat and meat products
3
Grains, oilseeds, protein crops
10 Animal feeds 3
Vegetable oils 5 Wines from organic grapes
2
Source: Organic Agriculture in Romania, 2011, [16]
The organic food channels are represented by local specialized markets, e-commerce, supermarket and other channels. About 80 % of organic food is sold in supermarkets, 10 % of organic food consumption is represented by local products and 90 % products are imported compared to Poland where imports represent just 30 % and Czech Republic 40 % [12].
Organic food is preferred by more and more Romanians but the amount purchased is limited by low income/family, taking into account that organic food price is 20-30 % higher than conventional food.
The reasons why organic food is consumed in Romania are its special taste, proximity to the purchase place, and curiosity [6].
Organic agriculture lead to increased production cost because of the lower productivity but this disadvantage could be compensated by a higher price at delivery and an increased gross margin [3].
The increased demand for organic food on the domestic market and mainly on the European
oneă hasă stimulatedă Romania’să exportă ofă
organic food. If in 2009, the value of bio food export was Euro 80 millions, in 2010 it reached Euro 100 millions and in 2011 Euro 200 millions.
The most required bio products for export are grains of cereals, honey, berries, cheese, wines and bread products.
The main beneficiaries of the Romanian bio products are Germany, Austria and Belgium [1,5].
In 2010, 135,600 tones of organic products were exported, accounting for Euro 100 millions. The main exported products were cereals, oilseeds and proteical seeds, forest fruits, processed milk products, honey and sunflower oil. The main beneficiaries were Germany, Austria, Switzerland, the Netherlands, Italy, France and Denmark. Organic agriculture is deeply stimulated by special programmes established by C.A.P[14].
Romania’să organică farmingă receivedă Euroă 3ă
In the animal sector, poultry farmers could get Euro 1,500 for 500 poultry stock and Euro 3,000 for over 500 heads, cattle breeders could get Euro 800 for raising less than 20 heads and Euro 2,000 for more than 20 cattle; sheep and goats breeders could get Euro 500 for growing less than 20 heads, Euro 1,500 for 21-100 heads and Euro 3,500 for more than 100 heads.
The beekeepers could receive Euro750 E for keeping between 1-50 bee families, Euro 850 for 51-100 bee families and Euro 950 for apiaries larger than 100 bee families.
Also, from National Plan for Rural Development, farmers could benefit of payments for certifying organic farmland as follows: Euro 162 per ha for arable crops, Euro 335 per ha for vegetables, Euro 393 per ha for orchards, Euro 393 per ha for vineyards and Euro 270 per ha for medicinal and spicy herbs.
CONCLUSIONS
Organic agriculture is an extremely dynamic
sectorăbothăatăworld,ăEuropeanăandăRomania’să
level. The increased demand for organic food has stimulated the growth of organic agricultural land, livestock, production and trade with organic products.
The EU is one of the largest organic food producers and consumers. Romania has excellent conditions mainly its fertile soil to develop organic agriculture and increase export on the EU market. For this reason, the future strategy should be focused on the continuous growth of organic land, higher food quality, improvement of organic processes and domestic consumption as well as to extend export. The financial support is extremely important to strengthen and accelerate the development of organic farming in Romania.
REFERENCES
[1]Alecu, I.N., Alecu E., 2011, Agriculture and agricultural holdings statement in the EU member states.Ceres Press House, Bucharest, 381-402.
[2]Arbenz, M., 2012, Tackling the future challengers of organic Animal Husbandry, Proceedings of the 2nd IFOAM Organic Animal Husbandry Conference, Sept 12-14, 2012, Hamburg, Germany.
[3]Arion,ă F.,ă Mureşan,ă I.,ă Matis,ă R.,ă 2012,ă Whyă to
support ecological agriculture in the Common Agricultural Policies ? Case of Romania, Bulletin of UASVM Cluj, Horticulture, 69(2): 30-35.
[4]Badgley, C., Moghtader, J., Quintera, E., Zakem, E., Chapell,M.J., Aviles-Vasquez, K., Samulon, A., Perfecto, I., 2007, Organic agriculture and the global food supply. Renewable Agriculture and Food Systems, 22:86-108.
[5]Barbu, S. F., Bara, E., 2010 – Organic farming, a chance for Romanian agriculture, Research Journal of Agricultural Science, 42 (3): 412-417.
[6] Chiciudean, D., Funar, S., Arion, F., Chirea, G., Man, A., 2012, The factors of influence over the consumer buying behavior for organic food, Bulletin UASVM Cluj-Napoca, Horticulture, 69 (2): 68-71. [7]Cicea, C., Subic, J., Pirlogea, C., 2010, Considerations regarding investments efficiency in agriculture, Economia Seria Management, 13 (2): 321-331.
[8]Ciocoiu, N., 2006, New approaches to Risk Management in Agriculture, Economics of Agriculture:
Internatională Scientifică Meetingă “Multifunctională
Agriculture andăRuralăDevelopmentă(1)”–development of local communities, Special edition, Belgrad/Mali Zvornik, vol. LIII/No. 13-6676: 481-486.
[9]Constantin, F., 2012, Economic performance of organic farming in Romania and the EU, Economia Seria Management/Economy – Management Series, 13 (1): 108-119.
[10]Dreezens, E.C., Martijn, P.,Tenbult, G.K., De Vries, N.K., 2005, Food and Values: An examination of values underlying attitudes toward genetically modified and organically growth food products. Appetite, 44: 115-122.
[11]Hughner, R.S, Mc Donagh, P., Prothero, A., Schultz, C.J., Stanton, J., 2007, Who are organic food consumers? A compilation and review of why people purchase organic food, Journal of Consumer Behaviour, 6: 1-17.
[12]Ion, R.,2010, Analysis of organic farming sector in Romania, Economia Seria Management, Economy-Management Series, 13 (3): 449-455.
[13]Saba, A., Messina, F., 2003, Attitudes towards organic food and risk/benefit perceptions associated with pesticides. Food Quality and Preference, 14: 637-645.
[14]Vidican, R., Rotar, I., Carlier, L., 2006, Perspectives of the organic farming in Romania, Bulletin UASVM Cluj-Napoca, 62: 198-200.
[15]Willer, H, Sahota, A., Huber, B.,2012, The World of Organic Agriculture-Statistics and Emerging Trends, Sankt Petersburg, www.biofach.fibl.org
[16] Organic Agriculture in Romania, MARD 2012,
www.madr.ro, www.organic-market.info
[17] Organic World 2012, www.organicworld.net [18] Organic Europe, www.organic-europe.net
[19] FIBL/IFOAM Survey 2012, www.fibl.org [20]EuroStat, 2012, Certified organic livestock,
www.appsso.eurostat.ec.europa.eu
[21]OTA’să Organică Industryă Survey,ă 2012,ă Organică