Analysis of the Stresses in Corrugated Sheets under Bending
Julio Cesar Molinaa*, Juliano Fiorellib, Holmer Savastano Jr.b
aUniversity of the Wood Industrial Engineering, Universidade Estadual Paulista – UNESP, Rua Geraldo Alckmin, 519, Nossa Senhora de Fátima, CEP 18409-010 Itapeva, SP, Brazil
bCollege of Zootechny and Food Engineering, Universidade de São Paulo – USP, Av. Duque de Caxias Norte, 225, Centro, CEP 13635-900 Pirassununga, SP, Brazil
Received: March 27, 2013; Revised: November 9, 2013
This paper presents three different numerical models for the evaluation of the stresses in corrugated sheets under bending. Regarding the numerical simulations different approaches can be considered, i.e., a elastic linear analysis or a physical nonlinear analysis, that considers criteria to fail for the
sheet material. Moreover, the construction of the finite element mesh can be used shell elements or solid elements. The choice of each finite element must be made from the consideration of their
representativity before behavior to be simulated. Thus, the numerical modelling in this manuscript was performed from the three-dimensional models using the SAP2000Nonlinear software, version 7.42,
which has as base the finite elements method (FEM). It was considered shell elements in the build the mesh of finite elements and an analysis of type elastic linear in this case. Five mm thick sheets were evaluated considering three different longitudinal dimensions (spans), i.e., 1100 mm, 1530 mm and 1830 mm. The applied load to the models was 2500 N/m and it was verified that the spans of support of sheets have a significant influence on the results of stresses. The sheets with larger spans present larger stresses for the same applied load. The most intense values of tension occur in the troughs (low waves) of the sheets, on the lower surface, while the most intense values of compression occur in the crests (high waves), on the upper surface of the sheet. The flanks, which are the parts among the
troughs and crests of the sheets, are submitted to low levels of stresses. The numeric results of the stresses showed a good agreement with the results obtained from other researchers3 and these results can be used to predict the behavior of corrugated sheets under bending.
Keywords: corrugated sheet, numerical modelling, stress analysis
1. Introduction
In general, the test load of corrugated sheets is of
large interest for fiber-cement industries. This value serves as parameter of acceptance or rejection of the lots
of sheets produced. The asbestos cement is known to be
a very durable material and is used in the composition of corrugated sheets1. However, nowadays most published studies about fiber-cement sheets discuss the use of materials or compositions for sheets free of asbestos2. Thus, fiber-cement industries are migrating for new
technologies that use synthetic fibers in the production of
components for civil construction. However, technology
of the production of fiber cement without asbestos has
presented unsatisfactory results due to high production costs and to the low mechanical performance of the components compared to the conventional products. An alternative
to solve these problems is the use of fiber cement with
functionally graded, which consists in cement composites
reinforced with fibers presenting varying properties in a
local way3. Within this context, the knowledge of the stress distribution in corrugated sheets becomes important. The numerical simulation is an important tool in this case and
allows the analysis of the stresses in the corrugated sheet, no matter of the material used in their composition, since the experimental tests do not allow this type of analysis of a direct way.
Different approaches for the numerical simulations can be considered, i. e., an linear elastic analysis with geometric nonlinearity or a physical nonlinear analysis, that considers criteria to fail for the sheet material. The linear elastic analysis is simple to be performed, and can be used
for checking the global behavior of a structural element. For this purpose can be used the SAP2000NonLinear software, which has in its internal library finite elements
and other tools that facilitate the construction and analysis of numerical models. On the other hand, a physical
non-linear analysis is often used in the verification of located
points of interest as, for example, the concentration of stress at connections. Besides, with respect to the discretization
of the finite element mesh can be used shell elements or solid elements. In this case, can be used other commercial softwares as, for example, ANSYS, ABAQUS, DIANA and others that have finite elements with nonlinear properties.
However, the utilization of these softwares is more complex.
For both types of analysis presented, linear and nonlinear,
aspects does not require meshes very discretized.
This work is inserted in the particular scenery of the Brazilian section of fiber cement in which there is social motivation for banning fibers of asbestos. Thus, no matter the
material used in the composition of the corrugated sheets it
is important the knowledge of the behavior of final product
under bending, since the corrugated sheets have different distribution of stresses in the transverse and longitudinal directions of the component. There are no many studies involving the numerical analysis of corrugated sheets about the analysis of transverse and longitudinal stresses.
This manuscript presents the numerical results of stresses distribution in corrugated sheets under bending
considering a load of 2500 N/m (load/width of sheet). The
behavior of the sheets in the longitudinal and transverse directions are presented in terms of stresses as well as
the influence of span of sheet on the longitudinal stresses.
These results obtained in this study can help the industries and researchers to solve the main problems related to this product. Besides, the strategy of the numerical modelling
from the use of SAP2000NonLinear software is also presented. Therefore, the main contributions of this work are
the presentation of the distribution of stresses in corrugated sheets in transverse and longitudinal directions as well as show how these stresses behave due the increase of the size
longitudinal of span support of the sheet. Furthermore, it is worth saying that the method of analysis used in this work from the use of software SAP2000NonLinear is simple when
compared with other programs of numerical analysis as the
The space among supports (span) has an important role in the acting of fiber-cement corrugated sheets. The
recommended span for tests according to national standard4 is of 1100 mm for sheets of up to 6 mm of nominal thickness. In this work, three different spans for the corrugated sheets: 1100 mm, 1530 mm and 1830 mm were considered.
2.1.
Analyzed sheets
Corrugated sheets with the following configuration
were analyzed:
• Height: 51 mm;
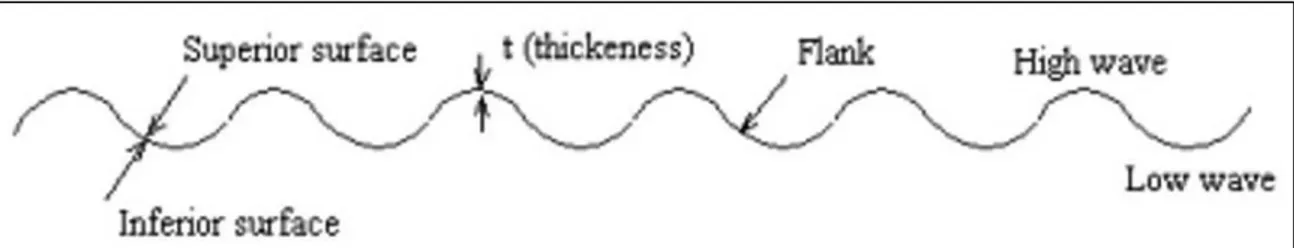
• Transverse width: 1100 mm; • Thickness: 5 mm.
Figure 1 shows the dimensions of the cross section of the sheets and Figure 2 shows the nomenclature used for
the corrugated sheets.
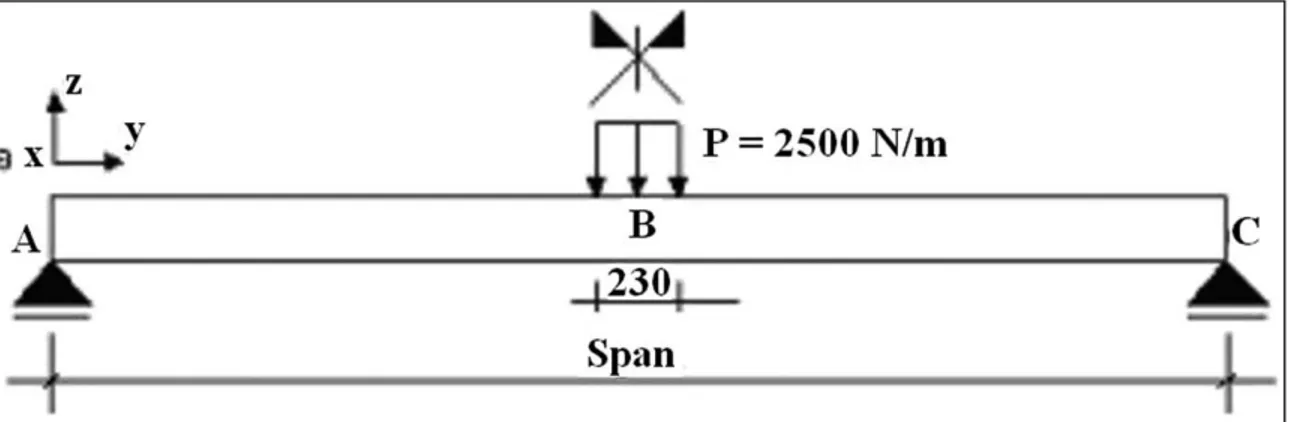
The load was distributed in the transverse width of the
sheets in a central strip of 230 mm. Figure 3 shows the load
and support conditions for the models analyzed.
For simplicity of the models, the sheets were supported without lateral balances, as shown in Figure 4. The width
of the sheets as well as the spans admitted for the models are indicated in Table 1.
2.2.
Load conditions
The load (2500 N/m) was applied on the high wave (troughs) of the sheets in a central strip of 230 mm in fractions of load as indicated in Figure 5. The fractions of
load were determined by experimental tests starting from
Figure 1. Cross section of the sheets considered in the numerical models.
the use of a carbon paper located between the cleaver and the high wave of the sheets3. Starting from this experimental tests it was observed that the load is distributed in lines from
the end of the cleaver until the points away from 50 mm
of the extremities3. The load of the cleaver is distributed in the waves in fractions of the total load3. It is important to mention that in a normalized test of bending, for the
verification of the performance of sheets, the transverse
load in the wave high is applied by the use of a cleaver
(test apparatus)4.
The calculation of the fractions of load applied in each
high wave is presented in the sequence. Figure 5 shows the
calculated values.
wave 2: (2500 N/m × 1.10 m) × 0.0741 = 203.775 N/4 = 50.94N
wave 4: (2500 N/m × 1.10 m) × 0.2098 = 576.950 N/4 = 144.24N
wave 6: (2500 N/m × 1.10 m) × 0.1640 = 451.000 N/4 = 112.75N
wave 8: (2500 N/m × 1.10 m) × 0.1768 = 486.200 N/4 = 121.55N
wave 10: (2500 N/m × 1.10 m) × 0.1590 = 437.250 N/4 = 109.31N
wave 12: (2500 N/m × 1.10 m) × 0.2163 = 594.825 N/4 = 148.71N
However, for the simulation of the effect of load below the region of cleaver, the load was applied in line, in the high
waves up to the distance of 50 mm from the extremities of cleaver as shows Figure 6.
Some Brazilian standards recommend for the tests of fiber-cement corrugated sheets the load of bending
equal to 5 kN/m2. Figure 7 shows the test apparatus used in experimental tests5 for the determination of the
strength in the corrugated sheets under bending. For the
corrugated sheets without asbestos, there are no standard recommendations about the limit value of load to be used in the tests under bending.
2.3.
Boundary conditions
To simulate the bending tests of the corrugated sheets considering the lengths indicated in Table 1 with an applied
load of 2500 N/m, in the strip of 230 mm, the following
boundary conditions were considered:
a) Restrain of the displacements in the x and z directions
in the sections of support;
b) Restrain of the displacement y at points located in the
central section.
Figure 8 shows the details of boundary conditions and
the mesh used for the corrugated sheets in the models.
2.4.
Mesh of finite elements
The mesh of the sheet was discredited in a total of
1152 elements to the sheet with span of 1100 mm and of 1536 elements for the sheets with spans of 1530 mm
and 1830 mm. The meshes of the numerical models were
analyzed from different levels of refinement, until the results
would lead to satisfactory answers in terms of displacements
and strains. For the mesh m1 (sheet with span of 1100 mm) were considered initially 768 finite elements and for
meshes m2, m3 and m4 were considered 864, 1152 and 1728
finite elements, respectively. The results obtained for the
Figure 3. Support and load conditions for the models analyzed under bending.
Figure 4. Support conditions admitted in the models.
Table 1. Support conditions and lengths admitted for the sheets under bending.
Length of the sheets (mm)
Support spans (mm)
1100 1100
1530 1530
configuration m1 were different from the results obtained for
configurations m2, m3 and m4, which were more discretized.
However, the results obtained for the configuration m1 were similar to those obtained to m2 configuration. It was observed greater numerical stability for m3 and m4 configurations with respect to m1 and m2. The results for configurations m3 and m4 were about the same but, however, the processing time for m4 was three times greater than the processing time for m3. For these reasons, was chose the configuration m3 for
the modeling of the sheets with span of 1100 mm. For the spans of 1530 mm and 1830 mm, with base on what was presented, the same study was made, and the number of finite
elements considered for the mesh m3 for these cases was
1536. There are specific computer programs for construction
of complex meshes as, for example, the TrueGrid software. The discretization of the mesh was made using the software SAP2000Nonlinear6, version 7.12, which has as
base the finite element method (MEF). Shell elements in the
composition of the mesh were used. The shell element has four nodes with six degrees of freedom per node, being three
translations and three rotations. Each shell element was built
having the same orientation for the quadrilaterals that formed
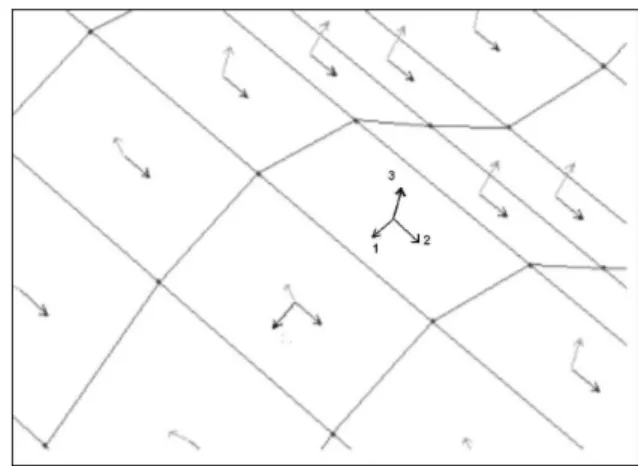
each one of the shell elements. In the SAP2000Nonlinear,
the local axe 3 is oriented in perpendicular direction to the surface of the element. This way the local axes 1, 2 and 3 from the shell elements were admitted with the same
orientation facilitating the discretization of the mesh of finite elements and subsequent the analysis of the results. Figure 9
shows the orientation of the local axes in the sheets and the
mesh of finite elements.
2.5.
Analysis considered in the models
The models were developed considering the physical
linearity of the material (stress is proportional to strain) and geometric non-linearity of the sheets (deformed configuration)7. Isotropic behavior for the material used
Figure 5. Load of 2500 N/m applied in fractions of the total load in the high waves 2, 4, 6, 8, 10 and 12 in the central strip of width equal
230 mm.
Figure 6. Fractions of load applied in line, in the high waves 2, 4, 6, 8, 10 and 12, in the central area of width 230 mm to the 50 mm
of the extremities of cleaver.
Figure 7. Test apparatus used for determination of the strength of the corrugated sheets6.
Figure 8. Boundary conditions: restrain of the displacements in the supports and in the central section of the sheet.
Figure 9. Orientation of the local axes of shell elements and mesh
in the composition of the sheets was admitted. The elastic properties of the sheet admitted for the models were:
• Module of elasticity (E): 9000 N/mm2 (9000 MPa); • Poisson ratio (υ): 0.2 (typical value for the fiber
cement used in the corrugated sheets).
2.6.
Stresses and strains evaluated in the model
To the considered load of 2500 N/m the analysis ofthe stresses with lager potential to cause damage to the component was made. The stresses with this potential are the followings:
• Longitudinal stress σ
max (maximum value of tension in the lower surface of the low waves);
• Longitudinal stress σ
min (maximum value of compression in the upper surface of the high waves).
The values of the main stresses, σ
max and σmin, were verified in the finite elements localized in the central section of the sheet, as indicated in Figures 10 and 11. The validation
of the numerical results presented in this manuscript was made from the comparison with the numerical results presented by other authors3. The comparison between results in this case presented a good agreement. The numerical results3 used to validate the model of this manuscript were validated through experimental bending tests conducted in
sheets of fiber-cement.
The maximum stresses of tension (σ
max) were verified in the low waves 3, 5, 7, 9, 11 and 13 while the maximum stresses of compression (σ
min) were verified in the high waves 2, 4, 6, 8, 10 and 12. In this case, the values of stress
correspond to the stress σ
11 (normal stress caused by bending moment acting around the neutral line in the × direction).
2.7.
Material properties
The conventional fiber cement without asbestos when
subjected to stresses above the stress in the elastic limit start
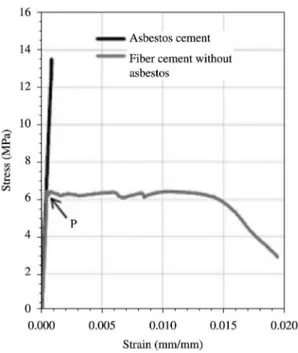
to present cracking and plastic deformations3. The tension strength of the asbestos cement is from 15 MPa to 20 MPa reaching up to 25 MPa. However, the average strength of the
asbestos cement produced in Brazil is 13.2 MPa3.
For the tests of corrugated sheets the minimum load
required by standard equates the maximum load that the
sheet supports under bending and not to the load of first crack
from which the tightness of sheet becomes compromised3. Point P in Figure 12 corresponds to the point of first crack of the matrix of fiber cement without asbestos, i.e., the matrix begins to crack when the tensile stress reaches values close to 6 MPa3. These values are equivalent about half of failure stress of the asbestos cement3.
The elasticity module suitable to the use in numerical models is that obtained from the direct tests of tension instead of bending in four points8.
3. Results and Discussion
The results of longitudinal stresses obtained from the
numerical simulations are shown in Figures 13, 14 and 15. The maximum stress values (compression and tension) for the sheets in the points showed in Figure 10 are shown in
Tables 2, 3 and 4.
3.1.
Longitudinal stresses
The maximum values of tension of stress (σ
max) in the lower surface of the sheets are summarized in Table 5.
Figure 10. Points in the sheets where verified the maximum stresses: σ
max (tension) and σmin (compression).
Figure 11. Finite elements in the central section of the sheet where
the maximum stresses σ
max and σmin were verified.
Table 2. Values of maximum longitudinal stresses in the model with span of 1100 mm.
σ
min (MPa) in the high wave (compression) σmax (MPa) in the low wave (tension)
2 4 6 8 10 12 3 5 7 9 11 13
7.79 10.64 9.85 10.07 9.02 10.68 8.51 9.81 8.90 8.71 9.94 7.63
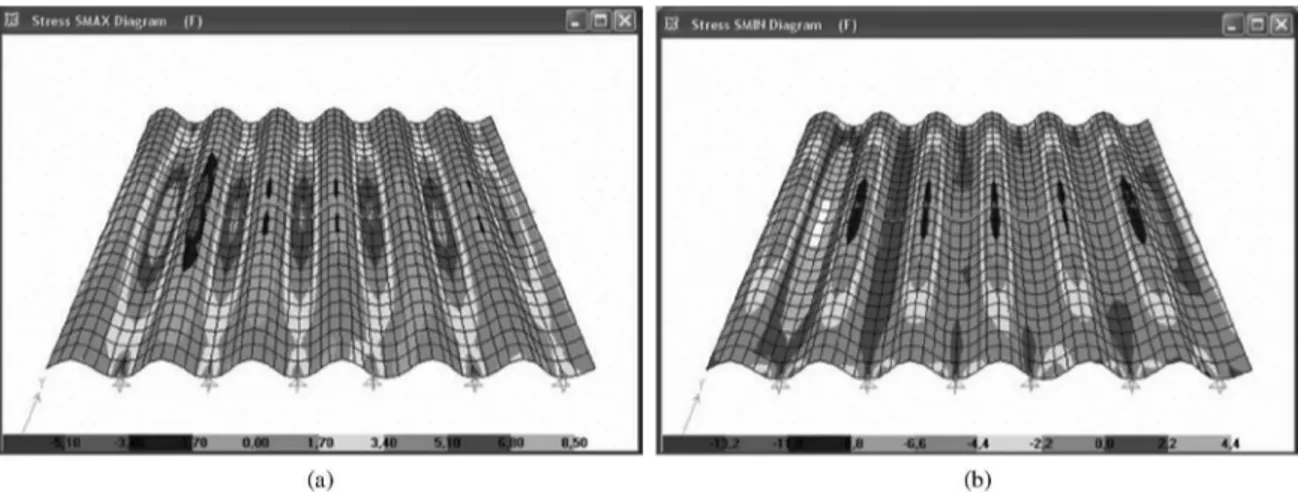
Figure 13. Stresses in the model with span of 1100 mm: (a) Maximum value of tension (σ
max) in the lower surface of the low wave, (b) Maximum value of compression (σ
min) in the upper surface of the high wave.
Figure 14. Stresses in the model with span of 1530 mm: (a) Maximum value of tension (σ
max) in the lower surface of the low wave, (b) Maximum value of compression (σ
min) in the upper surface of the high wave.
Figure 15. Stresses in the model with span of 1830 mm: (a) Maximum value of tension (σ
max) in the lower surface of the low wave, (b) Maximum value of compression (σ
Table 5. Values for the fiber-cement corrugated sheets with
thickness of 5 mm.
Span (mm) Load (N/m) σ
max (MPa)
1100 2500 9.94
1530 2500 13.78
1830 2500 16.46
Table 4. Values of maximum longitudinal stresses in the model with span of 1830 mm.
σ
min (MPa) in the high wave (compression) σmax (MPa) in the low wave (tension)
2 4 6 8 10 12 3 5 7 9 11 13
13.92 17.88 17.73 17.48 17.26 19.13 15.95 16.02 16.03 16.28 16.46 13.64
Table 3. Values of maximum longitudinal stresses in the model with span of 1530 mm.
σ
min (MPa) in the high wave (compression) σmax (MPa) in the low wave (tension)
2 4 6 8 10 12 3 5 7 9 11 13
11.38 15.04 14.56 14.28 13.99 15.67 12.88 13.10 13.12 13.36 13.78 11.11
Figure 16. Global view of the deformed configuration of the sheets
considering a vertical load of 2500 N/m under bending.
Figure 18. Simulation of the bending test of ABNT NBR 15210-2:
Distribution of stresses σ
1 (bottom surface) and σ3 (upper surface) in the central section (span of 1100mm) for bending load of 1 N/m.
Figure 17. Deformed configuration of the sheets: (a) Transverse
deformation in the center of span, (b) Longitudinal deformation
between supports.
3.2.
Strain of the sheets
The global, longitudinal and transverse strains of the
sheets are presented in Figures 16 and 17 in the follow.
3.3.
Comparison of the results obtained with the
other author
3Figure 18 shows the results of stresses in the central
section obtained by the other author3 considering a 3D model of corrugated sheet with 1100 mm for the comparison of the numerical results. The comparison between the results show
that the value of stress (σ
min) obtained in this manuscript for the wave 2 (maximum value of compression in the upper surface of the high waves) was about –0.0026 MPa (see Figure 1). Dn the other hand, the value of stress (σ
max) obtained for wave 3 (maximum value of tension in the lower surface of the low waves) was about +0,0034MPa. Strength values obtained according to Figure 18[3] were σ
3 = –0.0025 MPa and σ1 = +0.0033 MPa, where σ3 = σmin and σ
the stresses in the sheets are larger for larger spans. For
the simulation of the bending tests with vertical load of
2500N/m the most intense longitudinal stresses of tension
occur in the low waves, in the lower surface, in the central area of the sheet, while the most intense longitudinal stresses of compression occur in the high waves, in the
upper surface. The flanks are subjected to low levels of
stress. The stresses σ
max (in the low waves) and σmin (in the high waves) for the applied load of 2500 N/m act in the
longitudinal direction of the sheet, decreasing in intensity from the center of sheet to the points of supports. The
stresses in the sheets are more pronounced in the first low wave (number 3) when compared with the other stresses in the low waves. This behavior is due the configuration of
the support, which forms a balance, and load used in this area of the sheet that favors the increase of the stresses. The
tension of stress (σ
max) in the lower surface of the sheet is the critical stress and is responsible for the failure of the
material. The conventional fiber cements without asbestos
13.2 MPa. The limit numeric value for the minimum load in corrugated sheets without asbestos considering the tension
strength of the fiber cement is equal to 6 MPa and span of the sheet of 1100 mm is approximately 1547 N/m. The limit
numeric value estimated for the minimum load in corrugated sheets of asbestos cement considering the tension strength equal to 13.2 MPa and span of 1100 mm is approximately
3402 N/m. The strains of the sheets in transverse and longitudinal directions present different configurations for the vertical applied load of 2500 N/m in the center of the
span. The results of the analyzed models indicated that the stiffness of the sheet in the transverse direction is lower than longitudinal direction.
Acknowledgements
The authors gratefully acknowledge the technical support of LAMEM/EESC/USP, College of Zootechny and Food Engineering/USP and Polytechnic School/USP.
References
1. Bentur A and Mindess S. Fiber reinforced cementitious composites. London and New York: Elsevier Applied
Science; 1990.
2. Dias CMR. Effects of the aging in the microstructure and in the mechanical behavior of the fiber cements. [Dissertation]. São Paulo: Polytechnic School of the University of São
Paulo; 2005.
3. Dias CMC. Fiber cement with functionally graded. [Thesis]. São Paulo: Polytechnic School of the University of São
Paulo; 2011. 156 p.
4. Associação Brasileira de Normas Técnicas – ABNT.
NBR 15210-2: Corrugated sheet of fibercement without asbesto
and their accessories Part 2: Tests. ABNT; 2005.
5. Associação Brasileira de Normas Técnicas – ABNT.
NBR 6468-2: Sheets of fiber cement: Determination of strength
under bending. ABNT; 1993.
6. Computers & Structures INC. SAP2000NonLinear 7.42 version
Documentation. 1999.
7. Molina JC. Analysis of the dynamic behavior of the connectors formed by bonded-in steel rods for log-concrete composite
deck bridges. [Thesis]. São Carlos: São Carlos School of
Engineering, University of São Paulo; 2008. 240 p.
8. Baroonian A and Keer JG. Finite element modeling of fiber