Electronic copy available at: http://ssrn.com/abstract=1435323
Does active management add value ? The Brazilian mutual fund market
Track: Financial Markets, Investments and Risk Management
William Eid Junior
Full Professor
FGV/EAESP
Escola de Administração de Empresas de São Paulo
Fundação Getúlio Vargas
Av. Nove de Julho 2029 10º andar
São Paulo Brasil CEP 01313-902
Phone: 55 11 3281-7899
Fax: 55 11 3284-1789
Indexing: Eid Jr, William
Ricardo Ratner Rochman
Professor
FGV/EAESP
Escola de Administração de Empresas de São Paulo
Fundação Getúlio Vargas
Av. Nove de Julho 2029 10º andar
São Paulo Brasil CEP 01313-902
Phone: 55 11 3281-7899
Fax: 55 11 3284-1789
Indexing: Rochman, Ricardo Ratner
Key words
Electronic copy available at: http://ssrn.com/abstract=1435323
Does active management add value ? The Brazilian mutual fund market
Abstract
Does active management add or destroy value ? With a sample of 699 with four different main categories: stocks, fixed
income, hedge and exchange rate mutual funds we conclude that the active management add value to investors in stocks and
hedge funds. But in fixed income mutual funds the evidence is against the active management. We also analyze the
determinants of significant alphas. For stocks and hedge funds the evidence suggests that old, big and active funds generate
biggest alphas. In fixed income funds the evidence is not clear, only a positive relationship between size and alphas could be
found.
1. Introduction
From an investor point of view there is a fundamental question: is it better to invest in a passive fund or in an active one? In
other words, do the active managers have superior skills to select better investments?
Passive management means having a portfolio that mimics the market, that is, a portfolio that have all the available assets in
the same proportion as they exists in the market. The main advantages of this king of management are:
a. Passive funds have slow operational costs.
b. As the investment game is a zero sum game and the active funds have great operational costs, they must show a
worse performance then the passive ones.
c. In efficient markets there is no reason for the existence of active funds better performance.
An active portfolio own different assets than the market portfolio. Managers of this kind of fund seek for better performance
than the market. The main arguments in favor of active management are:
a. Markets are not perfectly efficient
b. In bear markets active managers add value.
c. Hot hands effect exists. Funds with better past performance tend to have better performance in the future. This
effect clearly shows the advantage of active management.
Our study tries to answer the original question in the Brazilian mutual fund industry.
There are a lot of academic studies looking for the difference between active and passive management. Jensen (1968) is the
seminal study. He analyses the performance of 115 mutual funds during the 20 years between 1945 e 1954. The main
conclusion is against the value of active management. He shows that in average the funds were not able to beat a passive
strategy. More than this, the funds were not capable to cover the operational expenses. The analysis was based on the today
well know Jensen’s alpha.
More recently, Grinblat and Titman (1989) shows that the smallest aggressive growth funds, and growth funds have a
positive gross performance when compared to passive funds. But they also have the biggest operational expenses resulting
in a non abnormal liquid performance. They also use the Jensen’s alpha.
Cahart (1997) uses a factor model that includes operational expenses that almost completely explain the persistence
phenomenon in mutual funds and concludes that there is no evidence of superior performance with active management.
Chen, Jegadeesh and Wermers (2000) analyses the portfolio assets in the mutual funds. Their sample covers all the mutual
funds in USA during the period comprised between 1975 and 1995. They show that the stocks that are in the mutual funds
portfolios do not show better performance than the others. But at the same time, looking for the mutual fund trades, they
discovered that the most actively traded stocks shows better performance than the others. But this advantage has short life,
less than one year. And the funds usually stay with stocks more than one year avoiding transaction costs.
Kallberg, Liu and Trzcinka (2000) analyses the performance of 128 REITs – Real State Investment Trusts between 1986
and 1998. They concluded that REITs active managers add value. These funds have positive Jensen’s alpha, even when
considering the performance liquid of operational expenses. And the active ones show biggest Alphas than the passive ones.
Another interesting conclusion is that the managers add value when the market shows a poor performance.
Wermers (2000) is another work that supports the hypothesis of active management value. He studies the period between
1974 and 1995 looking for the different components of funds performance as expenses, turnover, liquid return and others.
He shows that the funds had a superior gross return of 1,3 %, comparing to the market, and that 0,6% of the 1,3% comes
from stocks’ specific characteristics and the other 0,7% from the superior skills in selecting stocks. But the liquid return is
1% bellow the market, mainly due to operational expenses and poor performance of other assets in the portfolios than
stocks.
Lhabitant (2001) concludes that in the Swiss mutual fund market the active management does not add value to the investor.
He analyses the performance of 60 mutual funds between 1977 and 1990.
Kacperczyk, Sialm and Zheng (2005) studying 1711 mutual funds in the USA between 1984 and 1999 and using a dual
database – mutual funds returns and portfolio composition – concludes that active management adds value. Mainly in funds
3. Data and Methodology
The Brazilian mutual fund industry has in the beginning of 2006 aproximately 4000 funds. But only 1200 are open to the
public, the other ones being exclusives or closed to the public. This 1200 were our main target. From these 1200 mutual
funds we excluded the ones without 5 years of live and from the remaining we selected the ones that are classified in the
Anbid (National Bank Association) as Stock Funds, Exchange Rate Funds, Fixed Income Funds and Hedge Funds.
Our sample contains 699 different mutual funds between 01/31/2001 and 01/31/2006. The total NAV is R$ R$
365.360.633.960,84 and accounts for 46,17% from the total industry NAV. Table I shows the number of funds in each
category and also their nature in terms of management according to the Anbid classification.
Table I: The sample
Number of Funds Active Passive Total
Stock 129 34 163
Exchange Rate 15 40 55
Hedge 118 21 139
Fixed Income 148 194 342
Total 410 289 699
As a proxy to the risk free rate we used three different rates: the CDI (Interbank Depositary Receipts), the Selic (Treasury
Bonds Rate) and Savings Account Rate (poupança). We collected these rates in the Economatica database.
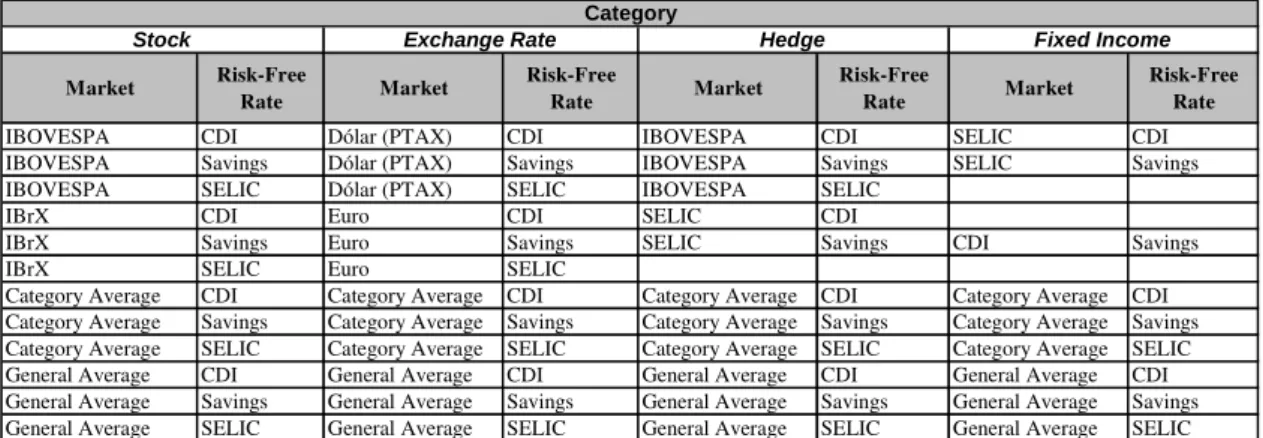
For each fund category we used four different market portfolios. Two directly associated with the category benchmark,
another one associated with the category average monthly log-returns and the last one associated with of our sample average
monthly log-return. Table 2 shows the different combinations of risk-free rate and market portfolio for each mutual fund
category:
Table II: Market and Risk-Free Rate
IBOVESPA CDI Dólar (PTAX) CDI IBOVESPA CDI SELIC CDI
IBOVESPA Savings Dólar (PTAX) Savings IBOVESPA Savings SELIC Savings IBOVESPA SELIC Dólar (PTAX) SELIC IBOVESPA SELIC
IBrX CDI Euro CDI SELIC CDI
IBrX Savings Euro Savings SELIC Savings CDI Savings
IBrX SELIC Euro SELIC
Category Average CDI Category Average CDI Category Average CDI Category Average CDI Category Average Savings Category Average Savings Category Average Savings Category Average Savings Category Average SELIC Category Average SELIC Category Average SELIC Category Average SELIC General Average CDI General Average CDI General Average CDI General Average CDI General Average Savings General Average Savings General Average Savings General Average Savings General Average SELIC General Average SELIC General Average SELIC General Average SELIC
Category
Stock Exchange Rate Hedge Fixed Income
Market Risk-Free
Rate Market
Risk-Free Rate Market Risk-Free
Rate Market
Data for Ibovespa Index, IBX Index and USD/R$ exchange rate were collected from the Economatica database. The
Euro/R$ exchange rate was collected from the Central Bank database. The daily return and mutual funds NAV were
collected from the Anbid database.
Our null hypothesis is that the active managed fund performance is not superior to the passive managed fund performance.
To test this hypothesis we used the Jensen’s (1968) model that measures the mutual fund performance trough the following
regression, using the MSE method:
(
Mt ft)
Pt PP ft
Pt
R
R
R
R
−
=
α
+
β
−
+
ε
Were RPt is the log-return in month t from the mutual fund P, Rft is one of our risk-free rates, RMt is the log-return of one of
our market portfolios, αP measures the ability in selecting assets, βP measures the sensibility between the mutual fund
log-return and the market portfolio log-log-return and εPt is a normally distributed variable with mean=0 and independent of RPt.
αp can be seen as the return difference between two portfolios: the one that we are studying and a passive one were with βP
units invested in the market portfolio and 1-βP units invested in the risk-free rate. A positive αp shows superior skills in
micro-previsions, and a negative one shows poor ability or much operational expenses.
In estimating the above equation, even with iid returns, we can find conditional heterodasticity that compromises the MSE
estimation efficiency. Henriksson (1984), and Chang e Lewellwn (1984) concludes that the errors are minimum, but we
decide to avoid this error correcting to heterocedasticity using the White (1980) procedure getting t-statistics adjusted and
with asymptotic validity.
We also look for the determinants of the mutual fund returns. Do to this we used cross-section regressions with the MSE
method. We regress the Jensen’s alpha of each fund against the following variables:
a. Active or passive management (ActiveP): a dummy variable that are 1 if the management is active and 0 otherwise.
We use the mutual funds that show a significant alpha, positive or negative. We expected a positive and significant
result for this variable.
b. Mutual fund Size (Ln(NAVP)): we use the log of NAV for each fund in 01/31/2006. Economic reasons like scale
and bargain power can justify the superior performance of greatest funds. But flexibility can justify a superior
performance of smallest funds.
c. National (NationalP): a dummy variable with is 1 if the mutual fund is managed by a Brazilian financial
organization and 0 if we are dealing with a foreign organization. We expected that the Brazilian managers do better
d. Mutual fund age (Ln(AgeP): the number of days log between the first day of mutual fund existence and 01/31/2006.
Younger mutual funds usually have biggest operational expenses like marketing. We expected that older mutual
funds have a better performance than the youngest ones.
e. Standard deviation (
(
)
ft Pt R
R −
σ
): the standard deviation of the difference between the mutual fund return and therisk-free rate was used as a proxy for mutual fund risk. The greatest the Jensen’s Alpha, the greatest the risk. That’s
what we expected.
Only mutual funds with Jensen’s Alpha significant at 15% level were considered for the cross section regression. For each
fund category we run the following regression:
(
P)
P(
P)
PP
P
β
β
Active
β
Ln
NAV
β
National
β
Ln
Age
ε
α
=
0+
1.
+
2.
+
3.
+
4.
+
(
P)
P(
P)
(
R R)
PP
P
β
β
Active
β
Ln
NAV
β
National
β
Ln
Age
β
σ
Pt ftε
α
=
0+
1.
+
2.
+
3.
+
4.
+
5.
−+
The difference between the two regressions above is the standard deviation insertion in the second one.
4. Results
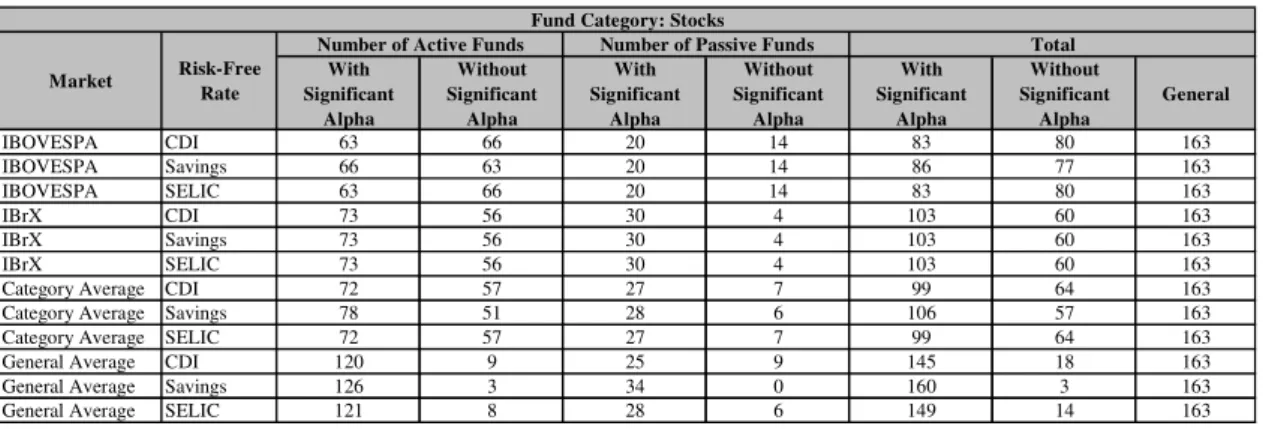
The first question that we want to answer is: does the active management of mutual funds add or destroy value? That is, do
we found significant Jensen’s Alphas? The answer depends on the mutual fund category. The following tables present the
results by category.
TABLE III: Stock Funds and Alphas
With Significant
Alpha
Without Significant
Alpha
With Significant
Alpha
Without Significant
Alpha
With Significant
Alpha
Without Significant
Alpha
General
IBOVESPA CDI 63 66 20 14 83 80 163
IBOVESPA Savings 66 63 20 14 86 77 163
IBOVESPA SELIC 63 66 20 14 83 80 163
IBrX CDI 73 56 30 4 103 60 163
IBrX Savings 73 56 30 4 103 60 163
IBrX SELIC 73 56 30 4 103 60 163
Category Average CDI 72 57 27 7 99 64 163
Category Average Savings 78 51 28 6 106 57 163
Category Average SELIC 72 57 27 7 99 64 163
General Average CDI 120 9 25 9 145 18 163
General Average Savings 126 3 34 0 160 3 163
General Average SELIC 121 8 28 6 149 14 163
Fund Category: Stocks
Number of Passive Funds Total
Market Risk-Free Rate
Number of Active Funds
Table III shows the results for stocks mutual funds. The result depends on the mutual fund benchmark. But only half of the
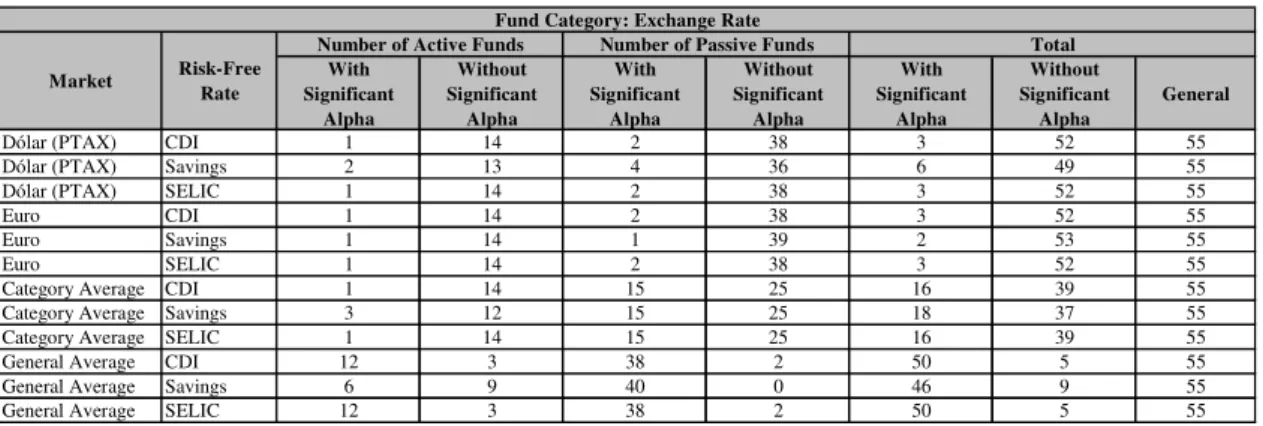
TABLE IV: Exchange Rate Funds and Alphas With Significant Alpha Without Significant Alpha With Significant Alpha Without Significant Alpha With Significant Alpha Without Significant Alpha General
Dólar (PTAX) CDI 1 14 2 38 3 52 55
Dólar (PTAX) Savings 2 13 4 36 6 49 55
Dólar (PTAX) SELIC 1 14 2 38 3 52 55
Euro CDI 1 14 2 38 3 52 55
Euro Savings 1 14 1 39 2 53 55
Euro SELIC 1 14 2 38 3 52 55
Category Average CDI 1 14 15 25 16 39 55
Category Average Savings 3 12 15 25 18 37 55
Category Average SELIC 1 14 15 25 16 39 55
General Average CDI 12 3 38 2 50 5 55
General Average Savings 6 9 40 0 46 9 55
General Average SELIC 12 3 38 2 50 5 55
Fund Category: Exchange Rate
Number of Active Funds Number of Passive Funds Total
Market Risk-Free Rate
Exchange rate mutual funds results are in table IV. And here we do not have the same evidence that we found in stocks
mutual funds. The only benchmark where we found significant alphas was in general average. And by construction this
benchmark must show worse performance, what conducts to diverse results.
TABLE V: Hedge Funds and Alphas
With Significant Alpha Without Significant Alpha With Significant Alpha Without Significant Alpha With Significant Alpha Without Significant Alpha General
IBOVESPA CDI 0 118 3 18 3 136 139
IBOVESPA Savings 2 116 5 16 7 132 139
IBOVESPA SELIC 0 118 3 18 3 136 139
SELIC CDI 117 1 21 0 138 1 139
SELIC Savings 90 28 19 2 109 30 139
Category Average CDI 46 72 18 3 64 75 139
Category Average Savings 108 10 20 1 128 11 139
Category Average SELIC 44 74 18 3 62 77 139
General Average CDI 14 104 8 13 22 117 139
General Average Savings 112 6 18 3 130 9 139
General Average SELIC 15 103 9 12 24 115 139
Fund Category: Hedge
Number of Passive Funds Total
Market Risk-Free Rate
Number of Active Funds
Table V presents the results for hedge funds with mixed evidence. As in stocks mutual funds, the results depend on the used
benchmark. The results are consistent with the use of CDI by the majority of mutual fund managers. In the case of Ibovespa
as benchmark, we cannot find a great number of significant alphas. As expected as the managers do not use this benchmark.
In the case of category average and general average we found a lot of significant alphas.
TABLE VI: Fixed Income Funds and Alphas
With Significant Alpha Without Significant Alpha With Significant Alpha Without Significant Alpha With Significant Alpha Without Significant Alpha General
SELIC CDI 147 1 191 3 338 4 342
SELIC Savings 130 18 174 20 304 38 342
CDI Savings 132 16 175 19 307 35 342
Category Average CDI 129 19 158 36 287 55 342
Category Average Savings 127 21 169 25 296 46 342
Category Average SELIC 128 20 157 37 285 57 342
General Average CDI 21 127 19 175 40 302 342
General Average Savings 132 16 181 13 313 29 342
General Average SELIC 21 127 19 175 40 302 342
Fund Category: Fixed Income
Number of Passive Funds Total
Market Risk-Free Rate
Finally in table VI we have the results for fixed income mutual funds. The majority of funds have significant Alphas, again
we have a clear evidence of value aggregation or destruction.
5. Management Value
Our first conclusion, looking at the results, is that generally we have value aggregation or destruction. The exception is the
exchange rate category. The next question is: managers adds or destroy value? And more, is there a difference between
active and passive managers?
In order to answer these questions we analyze the mutual funds that show significant alphas. Table VII presents the results
for stock mutual funds. The mean test for the active mutual funds alpha against the passive ones shows differences between
them in all the cases. And with few exceptions, like in the case of IbrX use as benchmark and savings as risk-free rate and
General average as benchmarks at the same time, the active managed funds add value and the passive ones destroy value.
Even the passive with positive alphas destroy value. The superiority of active managed funds is clear. Table V shows the
results for stock mutual funds:
TABLE VII: Stock Funds with Significant Alphas
Mean Standard
Deviation Number Mean
Standard
Deviation Number
IBOVESPA CDI 0,0046 0,0087 63 -0,0065 0,0054 20 diferentes diferentes IBOVESPA Savings 0,0065 0,0081 66 -0,0064 0,0052 20 diferentes diferentes IBOVESPA SELIC 0,0046 0,0087 63 -0,0065 0,0054 20 diferentes diferentes
IBrX CDI -0,0066 0,0076 73 -0,0125 0,0047 30 diferentes diferentes
IBrX Savings -0,0060 0,0084 73 -0,0129 0,0044 30 diferentes diferentes IBrX SELIC -0,0066 0,0076 73 -0,0125 0,0047 30 diferentes diferentes Category Average CDI 0,0021 0,0086 72 -0,0070 0,0051 27 diferentes diferentes Category Average Savings 0,0023 0,0086 78 -0,0076 0,0049 28 diferentes diferentes Category Average SELIC 0,0021 0,0086 72 -0,0070 0,0051 27 diferentes diferentes General Average CDI 0,0061 0,0067 120 -0,0015 0,0062 25 diferentes iguais General Average Savings -0,0171 0,0081 126 -0,0268 0,0054 34 diferentes diferentes General Average SELIC 0,0062 0,0067 121 -0,0011 0,0059 28 diferentes iguais
Fund Category: Stocks
Passive Funds with Significant Alphas
Variance Test (5%) Market Risk-Free
Rate
Active Funds with Significant Alphas
Mean Test (5%)
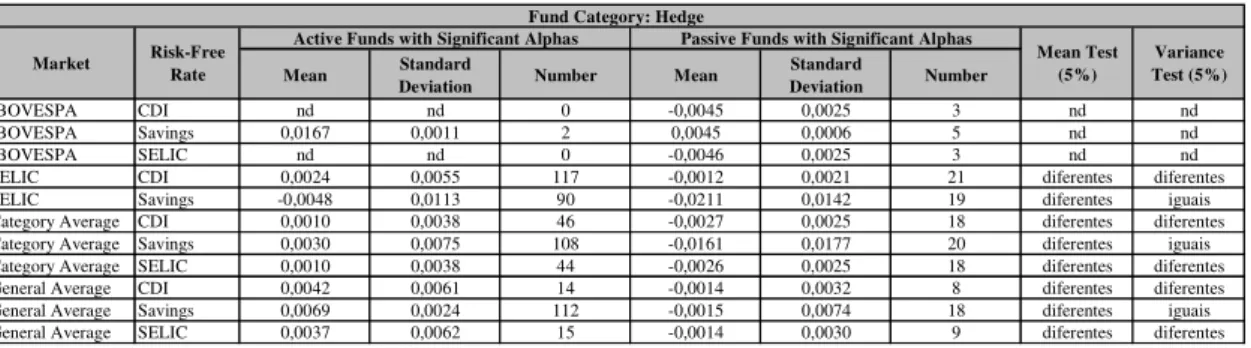
For hedge funds, as show in Table VIII, we conclude the same as in stock funds: active management add value and passive
management destroy value. The passive ones here are the so called balanced funds, the ones that have a fixed proportion
between stocks and fixed income.
TABLE VIII: Hedge Funds with Significant Alphas
Mean Standard
Deviation Number Mean
Standard
Deviation Number
IBOVESPA CDI nd nd 0 -0,0045 0,0025 3 nd nd
IBOVESPA Savings 0,0167 0,0011 2 0,0045 0,0006 5 nd nd
IBOVESPA SELIC nd nd 0 -0,0046 0,0025 3 nd nd
SELIC CDI 0,0024 0,0055 117 -0,0012 0,0021 21 diferentes diferentes SELIC Savings -0,0048 0,0113 90 -0,0211 0,0142 19 diferentes iguais Category Average CDI 0,0010 0,0038 46 -0,0027 0,0025 18 diferentes diferentes Category Average Savings 0,0030 0,0075 108 -0,0161 0,0177 20 diferentes iguais Category Average SELIC 0,0010 0,0038 44 -0,0026 0,0025 18 diferentes diferentes General Average CDI 0,0042 0,0061 14 -0,0014 0,0032 8 diferentes diferentes General Average Savings 0,0069 0,0024 112 -0,0015 0,0074 18 diferentes iguais General Average SELIC 0,0037 0,0062 15 -0,0014 0,0030 9 diferentes diferentes
Variance Test (5%) Fund Category: Hedge
Market Risk-Free Rate
Active Funds with Significant Alphas Passive Funds with Significant Alphas
The evidence for Fixed Income Funds is interesting. When using the same benchmark as the one used by managers, CDI or
Selic, we can see that managers destroy value, in active or in passive funds. Table IX shows the results:
Table IX: Fixed Income Funds with Significant Alphas
Mean Standard
Deviation Number Mean
Standard
Deviation Number
SELIC CDI -0,0008 0,0025 147 -0,0008 0,0015 191 iguais diferentes
SELIC Savings -0,0044 0,0039 130 -0,0030 0,0018 174 diferentes diferentes CDI Savings -0,0044 0,0039 132 -0,0030 0,0018 175 diferentes diferentes Category Average CDI 0,0000 0,0027 129 0,0000 0,0018 158 iguais diferentes Category Average Savings -0,0007 0,0040 127 0,0005 0,0031 169 diferentes diferentes Category Average SELIC 0,0001 0,0027 128 0,0000 0,0018 157 iguais diferentes General Average CDI -0,0054 0,0034 21 -0,0047 0,0016 19 iguais diferentes General Average Savings 0,0061 0,0015 132 0,0061 0,0010 181 iguais diferentes General Average SELIC -0,0055 0,0034 21 -0,0047 0,0016 19 iguais diferentes
Variance Test (5%) Mean Test
(5%) Fund Category: Fixed Income
Market Risk-Free Rate
Active Funds with Significant Alphas Passive Funds with Significant Alphas
As a first conclusion, we can say that stocks and hedge funds add value, meanwhile fixed income ones destroy value.
6. Jensen’s Alpha Determinants
Now we will look for the Alpha’s determinants. Do to that we will run the two regressions showed in the methodology.
Table X shows the first regression results for stock funds:
TABLE X: Stock Funds: First Regression
Intercept Active (dummy) Ln(NAV) National
(dummy) Ln(Age in days)
IBOVESPA CDI 0,04507 *** 0,0088 *** 0,0025 *** -0,0003 -0,0114 *** 0,625 IBOVESPA Savings 0,03993 *** 0,0104 *** 0,0025 *** 0,0011 -0,0109 *** 0,662 IBOVESPA SELIC 0,04506 *** 0,0088 *** 0,0025 *** -0,0003 -0,0114 *** 0,625 IBrX CDI 0,03958 *** 0,0056 *** 0,0021 *** 0,0000 -0,0107 *** 0,528 IBrX Savings 0,04444 *** 0,0062 *** 0,0024 *** 0,0007 -0,0119 *** 0,549 IBrX SELIC 0,03954 *** 0,0056 *** 0,0021 *** 0,0000 -0,0107 *** 0,528 Category Average CDI 0,05517 *** 0,0072 *** 0,0022 *** 0,0001 -0,0121 *** 0,584 Category Average Savings 0,06062 *** 0,0082 *** 0,0022 *** 0,0006 -0,0129 *** 0,599 Category Average SELIC 0,05515 *** 0,0072 *** 0,0022 *** 0,0001 -0,0121 *** 0,584 General Average CDI 0,03997 *** 0,0068 *** 0,0019 *** 0,0002 -0,0091 *** 0,491 General Average Savings 0,02903 ** 0,0094 *** 0,0017 *** 0,0018 * -0,0105 *** 0,431 General Average SELIC 0,03748 *** 0,0066 *** 0,0020 *** 0,0002 -0,0089 *** 0,498 *** = level of significance <= 5%; ** = level of significance between 5% e 10%; * = level of significance between 10% e 15%
R2 Market Risk-Free
Rate
Regression Coefficients Fund Category: Stocks
Active management, size and age are all significant variables. The evidence shows that an old, big and active fund generates
biggest alphas. At the same time we can see that there is no difference between funds managed by Brazilian financial
institutions and foreign ones.
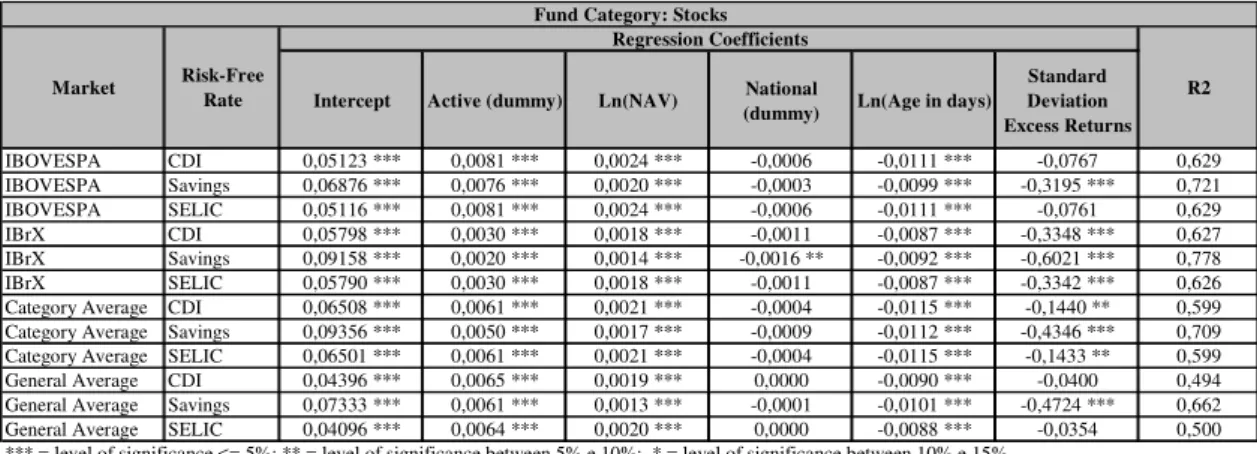
When we expand the regression, adding the risk variable, we see that the other variables maintain their significance, and the
new one is also significant, with a negative sign. That means that less risk generates biggest alphas. Table XI shows the
results.
Intercept Active (dummy) Ln(NAV) National
(dummy) Ln(Age in days)
Standard Deviation Excess Returns
IBOVESPA CDI 0,05123 *** 0,0081 *** 0,0024 *** -0,0006 -0,0111 *** -0,0767 0,629 IBOVESPA Savings 0,06876 *** 0,0076 *** 0,0020 *** -0,0003 -0,0099 *** -0,3195 *** 0,721 IBOVESPA SELIC 0,05116 *** 0,0081 *** 0,0024 *** -0,0006 -0,0111 *** -0,0761 0,629 IBrX CDI 0,05798 *** 0,0030 *** 0,0018 *** -0,0011 -0,0087 *** -0,3348 *** 0,627 IBrX Savings 0,09158 *** 0,0020 *** 0,0014 *** -0,0016 ** -0,0092 *** -0,6021 *** 0,778 IBrX SELIC 0,05790 *** 0,0030 *** 0,0018 *** -0,0011 -0,0087 *** -0,3342 *** 0,626 Category Average CDI 0,06508 *** 0,0061 *** 0,0021 *** -0,0004 -0,0115 *** -0,1440 ** 0,599 Category Average Savings 0,09356 *** 0,0050 *** 0,0017 *** -0,0009 -0,0112 *** -0,4346 *** 0,709 Category Average SELIC 0,06501 *** 0,0061 *** 0,0021 *** -0,0004 -0,0115 *** -0,1433 ** 0,599 General Average CDI 0,04396 *** 0,0065 *** 0,0019 *** 0,0000 -0,0090 *** -0,0400 0,494 General Average Savings 0,07333 *** 0,0061 *** 0,0013 *** -0,0001 -0,0101 *** -0,4724 *** 0,662 General Average SELIC 0,04096 *** 0,0064 *** 0,0020 *** 0,0000 -0,0088 *** -0,0354 0,500 *** = level of significance <= 5%; ** = level of significance between 5% e 10%; * = level of significance between 10% e 15%
R2 Market Risk-Free
Rate
Regression Coefficients Fund Category: Stocks
Table XII shows the results for hedge funds. They are quite similar to the stock funds results. But with one difference: here
the financial institution origin is significant. Hedge funds managed by Brazilian financial institutions generate biggest
alphas.
TABLE XII: Hedge Funds: First Regression
Intercept Active (dummy) Ln(NAV) National
(dummy) Ln(Age in days)
IBOVESPA CDI nd nd nd nd nd nd
IBOVESPA Savings nd nd nd nd nd nd
IBOVESPA SELIC nd nd nd nd nd nd
SELIC CDI 0,01378 0,0033 *** 0,0001 0,0008 -0,0021 0,075
SELIC Savings -0,01723 0,0141 *** 0,0026 *** 0,0049 *** -0,0064 * 0,318 Category Average CDI -0,00188 0,0027 *** 0,0011 *** 0,0021 *** -0,0027 ** 0,437 Category Average Savings -0,02271 0,0173 *** 0,0013 *** 0,0060 *** -0,0025 0,410 Category Average SELIC -0,00283 0,0026 *** 0,0011 *** 0,0020 *** -0,0026 ** 0,429 General Average CDI 0,00597 0,0040 * 0,0014 *** 0,0002 -0,0040 0,422 General Average Savings 0,00696 0,0077 *** 0,0004 *** 0,0029 *** -0,0021 ** 0,516 General Average SELIC 0,00988 0,0036 0,0015 *** 0,0005 -0,0046 0,402 *** = level of significance <= 5%; ** = level of significance between 5% e 10%; * = level of significance between 10% e 15%
Fund Category: Hedge
R2 Regression Coefficients
Market Risk-Free Rate
The evidence about the role of risk in hedge funds is mixed as we can see in table XII. When savings is the risk-free rate the
evidence shows that less risk generates biggest alphas. By other side, when the risk-free rate used is the CDI or Selic, more
risk generates biggest alphas. Table XIII shows the results.
TABLE XIII: Hedge Funds: Second Regression
Intercept Active (dummy) Ln(NAV) National
(dummy) Ln(Age in days)
Standard Deviation Excess Returns
IBOVESPA CDI nd nd nd nd nd nd nd
IBOVESPA Savings nd nd nd nd nd nd nd
IBOVESPA SELIC nd nd nd nd nd nd nd
SELIC CDI -0,00102 0,0056 *** 0,0004 * 0,0016 ** -0,0016 0,2167 *** 0,269 SELIC Savings 0,02644 0,0063 *** 0,0014 *** 0,0028 ** -0,0072 *** -0,6677 *** 0,637 Category Average CDI -0,00427 0,0028 *** 0,0012 *** 0,0022 *** -0,0027 ** 0,0335 0,451 Category Average Savings 0,02414 ** 0,0089 *** 0,0004 0,0031 *** -0,0041 *** -0,7170 *** 0,827 Category Average SELIC -0,00640 0,0028 *** 0,0013 *** 0,0022 *** -0,0026 ** 0,0429 * 0,450 General Average CDI -0,00856 0,0021 0,0024 *** 0,0035 -0,0052 0,1896 *** 0,609 General Average Savings 0,01655 *** 0,0057 *** 0,0003 ** 0,0022 *** -0,0027 *** -0,1551 *** 0,619 General Average SELIC -0,00520 0,0018 0,0025 *** 0,0032 -0,0057 ** 0,1915 *** 0,624 *** = level of significance <= 5%; ** = level of significance between 5% e 10%; * = level of significance between 10% e 15%
Fund Category: Hedge
R2 Market Risk-Free
Rate
Finally we look at the fixed income funds. There is weak evidence about the role of active management in destroying value,
Brazilian financial institutions reducing alphas and also the fund age in reducing alphas. More robust are the evidences
relating fund size and biggest alphas. Table XIV shows the results.
TABLE XIV: Fixed Income Funds: First Regression
Intercept Active (dummy) Ln(NAV) National
(dummy) Ln(Age in days)
SELIC CDI 0,01025 *** 0,0002 0,0002 *** -0,0004 *** -0,0019 *** 0,164 SELIC Savings -0,00118 -0,0014 *** 0,0001 ** -0,0001 -0,0006 0,070 CDI Savings -0,00099 -0,0014 *** 0,0001 * 0,0000 -0,0006 0,066 Category Average CDI 0,00972 *** 0,0002 0,0004 *** -0,0001 -0,0021 *** 0,212 Category Average Savings 0,01214 ** -0,0010 *** -0,0001 -0,0012 *** -0,0011 * 0,064 Category Average SELIC 0,01034 *** 0,0003 0,0004 *** -0,0001 -0,0021 *** 0,212 General Average CDI -0,00974 -0,0004 0,0002 -0,0001 0,0001 0,055 General Average Savings 0,01167 *** 0,0000 0,0000 -0,0003 ** -0,0008 *** 0,046 General Average SELIC -0,00979 -0,0004 0,0002 -0,0001 0,0001 0,055 *** = level of significance <= 5%; ** = level of significance between 5% e 10%; * = level of significance between 10% e 15%
R2 Market Risk-Free
Rate
Regression Coefficients Fund Category: Fixed Income
Including the risk variable we see almost the same as in the previous regression, with a more strong relationship between
fund age and biggest alphas. The evidence about the impact of risk in generating alphas is inconclusive, as we can see in
table XV:
TABLE XV: Fixed Income Funds: Second Regression
Intercept Active (dummy) Ln(NAV) National
(dummy) Ln(Age in days)
Standard Deviation Excess Returns
SELIC CDI 0,00940 *** 0,0001 0,0002 *** -0,0004 *** -0,0018 *** 0,0650 * 0,170 SELIC Savings 0,00647 -0,0006 *** 0,0001 ** 0,0001 -0,0012 -0,5207 *** 0,222 CDI Savings 0,00654 -0,0006 ** 0,0001 0,0001 -0,0012 *** -0,5268 *** 0,220 Category Average CDI 0,00492 -0,0002 0,0004 *** -0,0002 -0,0016 *** 0,2987 *** 0,306 Category Average Savings 0,02208 *** 0,0003 -0,0001 ** -0,0010 *** -0,0020 *** -0,9133 *** 0,344 Category Average SELIC 0,00551 * -0,0002 0,0004 *** -0,0002 -0,0017 *** 0,3052 *** 0,309 General Average CDI -0,01687 -0,0014 0,0002 0,0004 0,0009 0,3172 *** 0,233 General Average Savings 0,01184 *** 0,0000 0,0000 -0,0003 ** -0,0008 *** -0,0134 0,046 General Average SELIC -0,01689 -0,0014 0,0002 0,0004 0,0009 0,3174 *** 0,233 *** = level of significance <= 5%; ** = level of significance between 5% e 10%; * = level of significance between 10% e 15%
R2 Market Risk-Free
Rate
Regression Coefficients Fund Category: Fixed Income
7. Conclusions
Our initial question was: is it better to invest in active or passive mutual funds? We do not have a simple answer. For some
categories the answer is yes, for other the answer is no. For hedge funds and stock funds is clearly that active management
adds value. That is, managers have a superior capacity in managing the investor’s resources. In the case of fixed income the
evidence is against active management. Active managers destroy value. It is important remember that fixed income mutual
funds represents almost 85% of the total NAV in Brazilian mutual fund industry. For exchange rate funds there was no
The analysis of alpha’s determinants indicates also that they depend on the mutual fund category. For stock funds the
investors have to choose active, old and big ones. And also funds with lower risk. The manager’s origin has no effect in
generating alphas.
Also in the hedge funds category investors must look for active, old and big ones. But here the manager’s origin is
important and Brazilian managers show better results. And more risky bring better results when we use the same
benchmarks that are used by managers: CDI and Selic.
In the fixed income category the results are not clear. Only the relationship between size and alphas is a clear one. Big funds
generate biggest alphas.
As a general conclusion we can say that there is evidence of value aggregation in active management in stock and hedge
funds, but not in fixed income ones.
New research must be done with more sample segregation and also with the analysis of a broad range of alpha determinants.
References:
1. CAHART, M.M.- (1997)- On Persistence of Mutual Fund Performance – The Journal of Finance, Vol 52, Nº 1,
March, pp 57-82
2. CHANG, E.C.; LEWELLEN, W.G. – (1984) - “Market timing and mutual fund investment performance”, Journal
of Business, v.57, p.57-72.
3. GRINBLAT, M. ; TITMAN, S. – (1989) – Mutual Fund Performance: An Analysis of Quarterly Portfolio
Holdings – The Journal of Business, Vol 62, nº 3, July, pp 393-416
4. HENRIKSSON, R.D. – (1984) - “Market timing and mutual fund performance: an empirical investigation”,
Journal of Business, v.57, p.73-96.
5. JENSEN, M.C. – (1968) - The Performance of Mutual Funds in the Period 1948-1964 – Journal of Finance 23 nº 2
May pp 389-416
6. KACPERCZYK, M. ; SIALM, C.; ZHENG, L. – (2005) - On the Industry Concentration of Actively Managed
Equity Mutual Funds – The Journal of Finance, Vol 60, nº 4, August, pp 1983-2011
7. LHABITANT, F.S. (2001) – On Swiss Timing and Selectivity: in the Quest of Alpha – Working Paper nº 27 –
HEC Lausanne – June
8. SHARPE, W. F. – (1991) - The Arithmetic of Active Management – Financial Analysts’ Journal – Vol 47 Nº 1
9. WERMERS, R. (2000) – Mutual Fund Performance: An Empirical Decomposition in Stock-Picking Talent, Style,
Transaction Costs, and Expenses – The Journal of Finance, Vol 55, nº 4, August, pp 1655-1695
10. WHITE, H. – (1980) “A heteroscedasticity-consistent covariance matrix estimator and a direct test for
heteroscedasticity”, Econometrica, v.48, p. 817-838