DANIELA BATISTA OSS
ENERGY AND PROTEIN REQUIREMENTS OF CROSSBRED
(HOLSTEIN X GYR) YEARLING BULLS
AND
ASSESSMENT OF TECHNIQUES FOR MEASURING METHANE
EMISSIONS AND ENERGY EXPENDITURE OF CATTLE
VIÇOSA
MINAS GERAIS – BRAZIL
2016
ii ―And once the storm is over, you won‘t remember how you made it through, how you managed
to survive. You won‘t even be sure, whether the storm is really over. But one thing is certain. When you come out of the storm, you won‘t be the same person who walkedin. That‘s what this
iii DEDICATION
I would like to dedicate this thesis to my father (Gilvan Ribeiro Batista), my mother (Rozânia Maria Oss Batista) and my sister (Bruna Batista Oss), for all of their love and support.
iv ACKNOWLEDGEMENTS
First and foremost, I am very grateful for the family I have. I would like to thank them for all the words of encouragement and incentive, which have helped me stay strong and carry on.
I would like to thank my adviser, Marcos Inácio Marcondes. I feel very lucky for having him as my main instructor. I have learned a lot about ruminant nutrition, dairy cattle, and nutrient requirements of cattle from him. Besides and mainly, about leadership. Thanks for being so friendly, accessible, and patient most of the time. This was essential to keep me focused to conclude this work.
This work would not have been possible without support from EMBRAPA - Gado de Leite (Empresa Brasileira de Pesquisa Agropecuária). I gratefully acknowledge the following researchers: Luiz Gustavo Ribeiro Pereira, Fernanda Samarini Machado, and Thierry Ribeiro Tomich. Thank you for the opportunity to work with all of you and for the opportunity to learn about respirometry and energy metabolism in ruminants. I also would like to thank all the employees and technicians of EMBRAPA who worked with me and ―for me‖ to get the experiment and analysis done.
I also gratefully acknowledge EMBRAPA and CAPES (Coordenação de Aperfeiçoamento de Pessoal de Nível Superior) for the doctorate and doctorate sandwich scholarships. The financial support of CNPq (Conselho Nacional de Desenvolvimento Científico e Tecnológico) and FAPEMIG (Fundação de Amparo à Pesquisa do estado de Minas Gerais) is also fully appreciated.
I really appreciate all the help, guidance and collaboration of many people, including Professor Dr. Mario Luiz Chizzotti and Professor Dr. Sebastião de Campos Valadares Filho from the Universidade Federal de Viçosa. Also, Dr. Tim A. McAllister and Dr. Gabriel de Oliveira Ribeiro Junior from the Agricultural and Agri-Food Canada (AAFC). And all the contributions from Dr. Alexandre L. Ferreira from the Universidade Federal de São João del-Rei.
v I would like to thank the interns and workmates without whom surely I would not be able to carry out the experiment. Mainly to: João Paulo Pacheco, Alex Lopes, Ronan Lopes, Tadeu Eder, Marcelo Castro, Aline Trece, Anderson Trece, Rafael Guerra, Elves Godinho, and Andreia Machado from UFV, and Diego Santos, Sávio Moreira, Larissa Nazareth, Yasmin Melo and Narjara Gentil from EMBRAPA.
Thanks to the friends that I already had before the doctorate program, mainly: Julia Cani and Bruno Andreatta Scottá. In addition, to the friends that I made during the program, mainly: Tainá Silvestre, Bárbara Cardoso, Carlos Alberto, Aline Gomes da Silva, Erick Darlisson, Camila Cunha, Marlinda Jolomba, Walter Pequeno, Vanessa Carvalho, Fleming Sena, Cláudia Horne, Rob Gruninger, and Gabriel Ribeiro. Thank you to all for your help and support. All of you made everything lighter, happier, and comforting.
vi BIOGRAPHY
Daniela Batista Oss, daughter of Gilvan Ribeiro Batista and Rozânia Maria Oss Batista, was born in Montanha/ES – Brazil on February 23, 1985.
She started the undergrad in Animal Science at Universidade Federal do Espírito Santo (UFES), and obtained a Bachelor of Science degree in Animal Science in 2009. In 2010, she started the Master Science program, with major in forage and pastures and ruminant nutrition at the Universidade Estadual do Norte Fluminense Darcy Ribeiro (UENF). In February 15, 2012, she obtained a Scientiae Magister Degree in Animal Science.
In the same year, she started her doctorate program with a major in ruminant nutrition and dairy cattle production at the Universidade Federal de Viçosa (UFV). From July 2014 to July 2015, she was a visiting student at the Agriculture and Agri-Food Canada (AAFC), in Lethbridge, AB – Canada, where part of her doctorate program was performed.
vii TABLE OF CONTENTS
ABSTRACT ... ix
RESUMO ... xii
GENERAL INTRODUCTION ... 1
REFERENCES ... 5
CHAPTER 1 ... 10
Energy and Protein Requirements of Crossbred (Holstein × Gyr) Growing Bulls ... 10
Abstract ... 11
Introduction ... 12
Materials and Methods ... 13
Results ... 24
Discussion ... 32
Conclusions ... 36
References ... 37
CHAPTER 2 ... 42
Interpretive Summary ... 42
Technical note: Assessment of the O2P-HR method using respiration chambers and comparative slaughter for measuring the heat production of cattle ... 43
ABSTRACT ... 44
Technical note... 45
ACKNOWLEDGMENTS ... 51
REFERENCES ... 51
CHAPTER 3 ... 57
An evaluation of the face mask system based on short-term measurements compared with the sulfur hexafluoride (SF6) tracer, and respiration chamber techniques for measuring CH4 emissions ... 57
ABSTRACT ... 58
Introduction ... 59
Materials and methods ... 61
Results ... 68
Discussion ... 70
Conclusions ... 74
ix ABSTRACT
OSS, Daniela Batista, D.Sc. Universidade Federal de Viçosa, February, 2016. Energy and protein requirements of crossbred (Holstein x Gyr) yearling bulls and assessment of techniques for measuring methane emissions and energy expenditure of cattle. Adviser: Marcos Inácio Marcondes. Co-adviser: Luiz Gustavo Ribeiro Pereira.
The facts that justify the development of this work are: 1 – There is few information about nutrient requirements of crossbreeds Holstein x Gyr cattle, which is widely used in Brazil; 2 – Pressure to reduce livestock greenhouse gases has prompted greater interest in research to reduce enteric methane emissions from ruminants and consequently in the development and validation of techniques for measuring methane; 3 – Considering that energy expenditure is one of the most element in overall energy budget of cattle, to have measurement techniques that are suited to different production conditions it is important to studies that seek understand energy metabolism and partition of cattle. Therefore, this work was developed from three studies. The first one aimed to estimate the energy and protein requirements of crossbred (Holstein × Gyr) yearling bulls. Twenty-four 10 months old bulls (initial body weight = 184.1 ± 23.36 kg) were used in a comparative slaughter trial. Six bulls were slaughtered at the beginning of the experiment as the reference group to estimate initial empty body weight (EBW) and energy and protein contents of the remaining animals. The remaining bulls were assigned to a completely randomized design with 3 DM intake levels, with 6 replicates. The levels of DM intake were: 1.2% of BW, 1.8% of BW and ad libitum – target orts 5%. Bulls were fed a diet consisting of 59.6% corn silage and 40.4% concentrate on a DM basis. The equation adjusted for the relationship between EBW and BW was EBW= 0.861±0.0031 × BW. While the relationship between empty body gain (EBG) and
average daily gain (ADG) may be demonstrated using the equation: EBG= 0.934±0.0111 × ADG.
The net energy requirements for maintenance (NEm) were 74.8±2.89 kcal/EBW0.75/d, the
metabolizable energy requirements for gain (MEm) were 120.8 kcal/EBW0.75/d. The efficiency of
the use of metabolizable energy for maintenance (km) was 61.9%. The equation adjusted to
estimate the net energy for gain (NEg) was: NEg=0.049±0.0011 ×EBW0.75 × EBG0.729±0.0532. The
efficiency of the use of metabolizable energy for gain (kg) observed was 30.8%. The
x adjusted to estimate the net protein requirements for gain was: NPg= (87.138±65.1378 × EBG) +
(40.436±21.3640 × NEg). The efficiency of the use of metabolizable protein for gain (k) observed
was 53.6%. We conclude that the estimates of energy and protein requirements were not similar to those estimated from the other assessed systems, thus we recommend using the estimates herein presented to balance diets of crossbred (Holstein × Gyr) growing bulls. The second study aimed to compare short- term measurement (30 min/d for 3 d) face mask system (FM), with SF6
tracer and respiration chamber (RC) techniques for measuring methane emissions. The same animals, treatments and diet used in the first study were used in the second and third study. Methane emissions were measured first using the SF6 tracer technique, followed by the FM and
RC techniques, respectively. Methane collection was initiated for a period of 24 h, with the procedure repeated on 5 consecutive days. Two weeks later, the FM technique was evaluated and a single 30-min CH4 measurement was performed each day for 3 d by collecting measurements 6
h after feeding. After 4 weeks, methane emissions from bulls were estimated using indirect open-circuit respiration chambers (RC) by placing bulls in the chambers for two 24 h periods of methane measurements. The concordance correlation coefficient (CCC) for CH4 emission (g/d)
were: 0.82, 0.82 and 0.74 for comparisons of SF6 vs RC, FM vs RC and FM vs SF6, respectively.
Methane emission adjusted for differences in DMI did not differ among techniques, averaging 21.5 g/kg DMI (P=0.238). However, the day-to-day (21.3%) and animal-to-animal (13.4%) variation in CH4 yield was greater for the FM technique as compared to SF6 (18.8% and 6.8%)
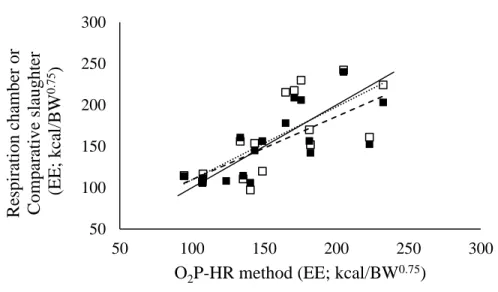
and RC (12.9% and 7.5%) techniques. This higher variation has a negative impact on power of an experiment using FM, and it would require more animals (replicates) to detect treatment difference with 80% of power. The third study aimed to assess the O2P-HR (oxygen pulse (O2P)
and heart rate (HR)) technique with respiration chamber (RC) and comparative slaughter (CS) methods for measuring energy expenditure (EE) of cattle. The O2P-HR method is an alternative
technique for measuring EE, that is based on long-term measurements (24 h periods) of the HR of free-range animals, and on short-term measurement of oxygen pulse (O2P; mL of O2
consumed/heart beat) which is measured by attaching a face mask (FM) to the animal‘s nose shortly (20 min). For both comparison (O2P-HR vs RC and O2P-HR vs CS), the regression
analysis indicated that the slopes were not different from unity and the intercepts were not different from zero (P>0.050), which is an indicative of high accuracy of the O2P-HR method.
xi comparison with CS, indicating a moderate precision of the O2P-HR method. The
between-animal CV was higher for the O2P-HR method (16.6%) when compared to RC (7.7%) or CS
(6.3%). The CCC were moderate, 0.70 for O2P-HR vs RC and 0.73 for O2P-HR vs CS. The O2
P-HR method generated EE measurements that were comparable with high accuracy and moderate precision to those estimated using RC and CS. The O2P-HR method may presented a negative
impact on power of an experiment due to its high between-animal coefficient of variation. In the same way, the FM technique for measuring methane emissions and the O2P-HR for measuring
xii RESUMO
OSS, Daniela Batista, D.Sc. Universidade Federal de Viçosa, Fevereiro de 2016. Exigências nutricionais de energia e proteína de tourinhos mestiços (Holandês × Gir) e avaliação de técnicas para mensuração de emissão de metano e produção de calor em bovinos. Orientador: Marcos Inácio Marcondes. Coorientador: Luiz Gustavo Ribeiro Pereira.
Os principais fatos que justificam o desenvolvimento deste trabalho são: 1 – Informações sobre exigências nutricionais de raças mestiças, largamente utilizadas no Brasil, são escassas; 2 – Uma pressão mundial para reduzir emissões de gases de efeito estufa, como metano, por ruminantes, aumentou o interesse por pesquisadores em diversas partes do mundo, em pesquisas para redução dessas emissões e consequentemente para o desenvolvimento e validação de técnicas para realizar mensurações precisas e acuradas e 3 – Considerando que o gasto energético (produção de calor) de bovinos é um dos elementos principais no orçamento da energia disponível para esses animais, a avaliação de técnicas que são aplicáveis a diferentes condições de produção são fundamentais para estudos sobre o metabolismo e partição energética de bovinos. Sendo assim, este trabalho foi desenvolvido a partir de três estudos. O primeiro foi estimar as exigências nutricionais de energia e proteína de tourinhos mestiços (Holandês × Gir). Vinte e quatro tourinhos de 10 meses de idade com peso inicial de 184.1 ± 23.36 kg (média ± desvio padrão) foram utilizados em um experimento de abate comparativo. Seis animais foram abatidos no início do experimento para determinação do peso de corpo vazio (PCVZ) dos animais e também o conteúdo inicial de proteína e energia no PCVZ dos mesmos. Os outros 18 animais foram distribuídos em um delineamento inteiramente casualizado. Os tratamentos foram 3 níveis de consumo de matéria seca (MS): 1,2% do PV, 1,8% do PV e ad libitum. Os tourinhos foram alimentados com uma dieta constituída por 59,6% de silagem de milho e 40,4% de concentrado, com base na MS. A relação encontrada entre PCVZ e PV demonstrou que o PCVZ corresponde a 86,1±0,31% do PV dos animais, enquanto que a relação encontrada entre ganho de corpo vazio
(GPCVZ) e ganho médio diário (GMD) demonstrou que o GPCVZ corresponde a 93,4±1,11% do
GMD dos animais. As exigências de energia líquida e metabolizável para mantença (ELm e
EMm) observada neste estudo foi 74.8±2.89 kcal/PCVZ0.75/d e 120.8 kcal/PCVZ0.75/d,
respectivamente. A eficiência do uso da energia metabolizável para mantença (km) observada foi
xiii ELg = 0.049±0.0011 ×PCVZ0.75 × GPCVZ0.729±0.0532. A eficiência do uso da energia metabolizável
para ganho (kg) observado foi de 30,8%. A exigência de proteína metabolizável para mantença
(PMm) detectada neste estudo foi de 3.05 g/kg PV0.75. A equação ajustada para estimar as
exigências de proteína líquida para ganho (PLg) foi: PLg = (87.138±65.1378 × GPCVZ) +
(40.436±21.3640 × ELg). A eficiência do uso da proteína metabolizável para ganho (k) foi de
53,6%. Comparando as estimativas de exigências geradas neste estudo com as estimativas segundo dois diferentes sistemas de exigências nutricionais de bovinos, um que utilizou animais de raças europeias de corte como banco e outro que utilizou raças mestiças de corte (Zebu × Bos taurus) como banco de dados para gerar seus modelos, verificamos uma pequena variação nas estimativas e recomendamos o uso das exigências apresentadas neste trabalho para balancear dietas de tourinhos mestiços (Holandês × Gir). O segundo estudo teve como objetivo comparar a técnica da máscara facial (MF) para mensuração da emissão de metano por bovinos com as técnicas mais largamente e tradicionalmente utilizadas para mensuração de metano entérico: a técnica do gás traçador SF6 e câmaras respirométricas (CR). Os mesmos animais, tratamentos e
dietas que foram utilizados no estudo de exigências foram utilizados neste estudo e no estudo que será descrito posteriormente a esse. As emissões de metano foram mensuradas primeiramente utilizando a técnica do SF6, posteriormente a técnica da máscara facial e
finalmente as câmaras respirométricas, de forma não simultânea e sim consecutiva. A técnica do SF6 foi realizada por 5 dias consecutivos, 2 semanas depois a técnica da máscara fácil foi
conduzida realizando uma única medição de 30 minutos por dia, por 3 dias, para cada animal. As mensurações foram realizadas após 6 horas à alimentação dos tourinhos. Após 4 semanas, os animais foram avaliados nas câmaras respirométricas por 2 dias consecutivos. As emissões de metano (g/d) foram altamente concordantes entre as técnicas avaliadas, com coeficientes de correlação e concordância de ordem de 0,82, 0,82 e 0,74 para as comparações entre SF6 vs CR,
MF vs CR e MF vs SF6, respectivamente. Quando as emissões de metano foram ajustadas para o
consumo de matéria seca (CMS; g/kg CMS), as técnicas não diferiram entre si (P=0,238). No entanto, a técnica da máscara facial apresentou maiores coeficientes de variação entre dias (21,3%) e entre animais (13,4%) em rendimento de metano (g/kg CMS) comparada a técnica do SF6 (18,8% e 6,8%) e CR (12,9% e 7,5%). A técnica da máscara facial gerou resultados de produção de metano que foram comparáveis com os resultados gerados pela técnica do SF6 e CR,
xiv (animais) por tratamentos é baixo levando a uma diminuição do poder do experimento em detectar diferenças entre tratamentos. O terceiro estudo objetivou comparar a técnica baseada no pulso de oxigênio (O2) e batimentos cardíacos (O2P-BC) para estimar o gasto energético dos
animais com as técnicas do abate comparativo (AC) e câmara respirométrias (CR). A técnica O2P-BC consiste em mensurar o consumo de O2 por períodos curtos de tempo (30 min/d) e
mensurar os batimentos cardíacos por períodos de 24 horas. Para as comparações entre O2P-BC
vs AC e O2P-BC vs CR as análises de regressão linear indicaram que os coeficientes angulares
não foram diferente de 1 e que os interceptos não foram diferentes de 0 (P>0,050), o que são indicativos de uma alta acurácia do método O2P-BC. Por outro lado, os coeficientes de
determinação para as duas comparações, r2, foi 0,52 e 0,53 entre O2P-BC vs AC e O2P-BC vs
CR, respectivamente, indicando uma moderada precisão do método O2P-BC. O método O2P-BC
apresentou maior coeficiente de variação (CV) entre animais (16,6%) quando comparado com CR (7,7%) e AB (6,3%). Os coeficientes de correlação e concordância foram moderados para ambas comparações: 0,70 para O2P-BC vs CR e 0,73 para O2P-BC vs AC. O método O2P-BC
gerou mensurações de gasto energético que foram comparáveis àqueles mensurados utilizando CR e AC, com alta acurácia e moderada precisão. O método O2P-BC pode apresentar um
impacto negativo no poder de um experimento para detectar diferenças de tratamentos devido ao seu maior CV. Igualmente, a técnica da máscara facial para mensurar metano entérico e o método O2P-BC para estimar gasto energético de bovinos, são técnicas alternativas que oferecem
1 GENERAL INTRODUCTION
The animal scientific community is always investigating ways to make animal production systems more cost-effective, which is, greater performance associated with low cost production.
Considering that nutrition is a key factor in performance, health and welfare of cattle, since 1959 there has been coordinated action by public organizations to review the literature on the nutrient
requirements of farm livestock and update advice on feeding standards (AFRC, 1993).
Knowledge about nutrient requirements of cattle is essential to avoid excessive or insufficient nutrient supply for these animals. Energy supply is the factor that first determine
animal performance. With regard to protein, the adequate supply of this nutrient is important because: it is the most expensive nutrient in animal diets and consequently, its oversupply can
decrease production efficiency, and animals excrete N via feces and urine causing air and water pollution.
Nutrient requirements may vary according species, breeds, sex, age, season, temperature, physiological stage and other factors (NRC, 1996). Many nutrient requirements systems of farm animals are available, including: NRC (1996, 2001; USA) AFRC (1993; United Kingdom),
INRA (1988; France), CSIRO (2007; Australia) and BR-CORTE (Valadares Filho et al., 2010; Brazil). Undoubtedly, all of them have the responsibility to move the science forward by
including models in their systems that was constructed on a substantial amount of data, taking into account the factors that may influence the nutrient requirements of cattle, as mentioned above.
2 of Brazil, the utilization of systems in which Holstein × Zebu animals are utilized for meat or milk production is significant, thus the nutrient requirement of these crossbred cattle become
necessary to optimize the production.
Thus, studies about nutrient requirements of cattle are important make cattle raising
systems more cost-effective. In a continuous attempt to achieve a greater efficiency, understanding the energy metabolism such as energy partition of cattle is also essential. According to Ferrel and Oltjen (2008), at energy partition, one of the largest energy losses of
feed energy are as fecal energy and heat production (energy expenditure). Energy losses as energy expenditure may represent more than 40% of the gross energy intake (Kurihara et al.,
1999), and energy losses in form of enteric methane may represent a range of 2-14% of feed energy (McAllister et al., 1996). However, the worry around methane emission from ruminants is mainly because it is a greenhouse gas, and due to that, a pressure to reduce livestock
greenhouse gases has prompted greater interest in research to reduce enteric methane emissions from cattle (Martin et al., 2010; Patra, 2012).
To develop strategies to understand and to minimize energy losses as enteric methane emissions or energy expenditure it is important to have measurements techniques that are suited to different production conditions. A number of techniques are available for measuring methane
emissions and energy expenditure, all with their own specific advantages and disadvantages, which will be addressed ahead.
Techniques for measuring energy expenditure of cattle
Animals expend energy, or in other words produce heat, because of metabolic reactions associated with maintenance and production metabolism and other ―non-productive‖ functions as
3 energy expenditure may enable determination of individual efficiency; the lower the energy expenditure in relation to production of an animal the higher the efficiency of an animal,
suggesting that selection of domestic ruminants for directly increased efficiency is a promising means of improving livestock efficiency (Brosh and Aharoni, 2005; Aharoni et al., 2006).
The heat production is usually measured directly by using respiration chambers. The approach is based on measuring gas exchange and changes in inhaled O2 and exhaled CO2 and
CH4. In this case, the Brouwer‘s formula (Brouwer, 1965) is often used to calculate heat
production from the consumption (O2) and the production (CO2 and CH4) of these gases.
However, the use of indirect calorimetry allows the evaluation of animals only under controlled
and closed conditions.
Another way to reach the energy expenditure of cattle is using the comparative slaughter method by which energy expenditure is estimated (measured indirectly) by the difference
between the metabolizable energy intake and retained energy in the empty body weight (EBW) of the animals. The comparative slaughter allows the determination of the heat production under
production conditions, however requires sacrificing animals.
Even so, significant effort has been invested to develop methods for measuring the energy expenditure of animals in their natural environmental. The O2P-HR method is an alternative
technique that allows to measure energy expenditure of cattle in the environmental where they are being raised. The O2P-HR (oxygen pulse and heart rate) method is based on long-term
measurement of heart rate and on short-term measurement of O2P. The accuracy and precision of
these two measurements are essential to the accuracy and precision of the O2P-HR (Brosh,
4 The theory behind the O2P-HR method is that the O2 used by mammals is transported to
the tissues by the heart; consequently, calibration of heart rate recording to energy expenditure
may be a great candidate for use of heat production measurement of free-ranging cattle (Brosh, 2007).
The O2P-HR method was already previously used (Arieli et al., 2002; Barkai et al., 2002)
and it seems to have a great potential for agricultural application, however, further studies are needed to evaluate the method in different experimental conditions, as well as to validate its
approach with the most used methods for measuring energy expenditure in cattle.
Techniques for measuring methane emissions from cattle
There are two techniques able to measure methane over the duration of an entire day: respiration chamber and the sulphur hexafluoride tracer technique (SF6). The SF6 technique (later
modified by Deighton et al., 2014) have been widely used in several studies because, unlike the
chambers, it offers the possibility for measuring methane emissions from free-ranging animals under their own environmental (Grainger et al., 2010; Hegarty et al., 2014). However, only
respiration chambers are able to measure methane emitted by flatus and able to demonstrate the daily variation pattern in emissions (Crompton et al., 2010).
These two techniques were widely compared with each other, and in general, there was
agreement between them across the studies (Grainger et al., 2007; Muñoz et al., 2012; Pinares-Patiño et al., 2011). Both techniques have their own strengths and weaknesses. Some of the
strengths were already mentioned above, but with regard to the weaknesses, basically, respiration chambers require high capital investment and the SF6 technique is very labor intensive.
There is an increasing interest in short-term (spot) measurements techniques to measure
5 methane production has caused these methods to be developed for verifying mitigation on-farm (DoE, 2013). Several methods based on short-term measurements are available, including
GreenFeed (Hammond et al., 2015), ventilated hood boxes or chambers (Troy et al., 2013), portable accumulation chambers (Goopy et al., 2015), face mask system (Kawashima, 2001) and
others. Short-term measurements techniques are being used but their accuracy and precision are poorly defined yet (Cottle et al., 2015). Therefore, studies of variation and comparison with the most used techniques around the world are needed for providing a basis for future application of
these methods.
REFERENCES
Aharoni, Y., A. Brosh, and E. Kafchuk. (2006) The efficiency of utilization of metabolizable energy for milk production: A comparison of Holstein with F1 Montbeliarde 3 Holstein cows. Animal Science, 82: 101–109.
AFRC (1993) Energy and Protein Requirements of Ruminants. Wallingford, UK: Agricultural and Food Research Council. CAB International. 159p.
Arieli, A., A. Kalouti, Y. Aharoni, and A. Brosh (2002) Assessment of energy expenditure by daily heart rate measurement – validation with energy accretion in sheep. Livestock
Production Science, 78: 99–105
Barkai, D., S. Landau, A. Brosh, H. Baram, and G. Molle (2002) Estimation of energy intake from heart rate and energy expenditure in sheep under confinement or grazing condition.
6 Brosh, A., and Aharoni, Y. (2005) Individual variation in production efficiency of dairy and beef cows. Page 113 in Proc. ADSA-ASASCSAS Joint Annu. Meet. Cincinnati, OH. Fed. Anim. Sci. Soc., Savoy, IL
Brosh, A. 2007. Heart rate measurements as an index of energy expenditure and energy balance in 405 ruminants: A review. Journal of Animal Science, 85: 1213-1227.
Brouwer, E. 1965. Report of sub-committee on constants and factors. Pages 441–443 in Energy Metabolism of Farm Animals, Academic Press, London, UK.
Cottle, D. J., Velazco, J., Hegarty, R. S. and Mayer, D. G. (2015) Estimating daily methane production in individual cattle with irregular feed intake patterns from short-term methane emission measurements. animal, 9: 1949-1957.
Crompton, L.A., Mills, J.A.N., Reynolds, C.K. and France, J., 2010. Fluctuations in methane emission in response to feeding pattern in lactating dairy cows. In: Sauvant, D., Van Milgen, J., Faverdin, P., Friggens, N. (Eds.), Modelling Nutrient Digestion and Utilization in Farm Animals. Wageningen Academic Publishers, Wageningen, the Netherlands, pp. 176–180.
CSIRO (2007) Nutrient Requirements of Domesticated Ruminants. Collingwood, VIC: Commonwealth Scientific and Industrial Research Organization. Australia. 270 p.
Deighton, M. H., Williams, S. R. O., Hannah, M. C., Eckard, R. J., Boland, T. M., Wales, W. J., & Moate, P. J. (2014). A modified sulphur hexafluoride tracer technique enables accurate determination of enteric methane emissions from ruminants. Animal Feed Science and
Technology, 197: 47-63.
DoE 2013. Guidance for on-farm measurement of agricultural greenhouse gas emissions and soil carbon. Retrieved February 10, 2016, from
7 Ferrell, C. L. and Oltjen, J. W. (2008). ASAS CENTENNIAL PAPER: Net energy systems for beef cattle—Concepts, application, and future models. Journal of Animal Science, 86: 2779-2794.
Goopy, J. P., D. L. Robinson, R. T. Woodgate, A. J. Donaldson, V. H. Oddy, P. E. Vercoe, and R. S. Hegarty (2015) Estimates of repeatability and heritability of methane production in sheep using portable accumulation chambers. Animal Production Science, In Press.
Grainger, C., Clarke, T., McGinn, S.M., Auldist, M.J., Beauchemin, K.A., Hannah, M.C., Waghorn, G.C., Clark and H., Eckard, R.J. (2007). Methane emissions from dairy cows measured using the sulfur hexafluoride (SF6) tracer and chamber techniques. Journal of
Dairy Science, 90: 2755–2766.
Grainger, C., Williams, R., Eckard, R. J., & Hannah, M. C. (2010). A high dose of monensin does not reduce methane emissions of dairy cows offered pasture supplemented with grain. Journal of Dairy Science, 93: 5300-5308.
Hammond, K.J., Humphries, D.J., Crompton, L.A., Green, C. and Reynolds, C.K. (2015) Methane emissions from cattle: estimates from short-term measurements using a GreenFeed system compared with measurements obtained using respiration chambers or sulphur hexafluoride tracer. Animal Feed Science and Technology, 203: 41-52.
Hegarty, R. S., Goopy, J. P., Herd, R. M. and McCorkell, B. (2007). Cattle selected for lower residual feed intake have reduced daily methane production. Journal of Animal Science, 85: 1479-1486.
8 Kawashima, T. (2001) Measurement of methane production from ruminants by ventilated
flow-through method with a face mask. Tsukuba workshop on ‗Development of new monitoring method for methane emission from ruminants‘, NILGS, Japan pp. 16-19.
Kurihara, M., Magner, T., Hunter, R. A. and McCrabb, G. J. (1999). Methane production and energy partition of cattle in the tropics. British Journal of Nutrition, 81: 227-234.
Martin, C., Morgavi, D. P. and Doreau, M. (2010). Methane mitigation in ruminants: from microbe to the farm scale. animal, 4: 351-365.
McAllister, T. A., Cheng, K. J., Okine, E. K. and Mathison, G. W. (1996). Dietary, environmental and microbiological aspects of methane production in ruminants. Canadian
Journal of Animal Science, 76: 231-243.
Muñoz, C., Yan, T., Wills, D.A., Murray, S. and Gordon, A.W. (2012) Comparison of the sulfur hexafluoride tracer and respiration chamber techniques for estimating methane emissions and correction for rectum methane output from dairy cows. Journal of Dairy Science, 95: 3139-3148.
National Research Council – NRC (1996) Nutrients requirements of beef cattle. 7.ed. Washington, DC: National Academy Press. 242 p.
National Research Council – NRC (2001) Nutrients requirements of dairy cattle. 7.ed. Washington, DC: National Academy Press. 381 p.
Patra, A. K. (2012). Enteric methane mitigation technologies for ruminant livestock: a synthesis of current research and future directions. Environmental Monitoring and Assessment, 184: 1929-1952.
9 technique using respiration chambers for estimation of methane emissions from sheep.
Animal Feed Science and Technology, 166: 201-209.
Rotta, P. P., Valadares Filho, S. C., Detmann, E., Costa, L. F., Villadiego, F. A. C., Burgos, E. M. G. and Silva, F. A. S. (2013) Nutrient requirements of energy and protein for Holstein× Zebu bulls finished in feedlot. Semina: Ciências Agrárias, 34: 2523-2534.
Troy, S., J. A. Rooke, C. A. Duthie, D. Ross, J. J. Hyslop, R. Roehe, and T. Waterhouse. (2013). Measurement of methane from finishing cattle fed either a forage-based or high concentrate diet from both feeder-mounted samplers and respiration chambers. Greenhouse Gases and Animal Agriculture Conference. Advances in Animal Biosciences, 4:551.
Valadares Filho SC, Marcondes MI, Chizzotti, ML, Paulino PVR (2010) Nutrient Requirements of Zebu Beef Cattle – BR-CORTE. Visconde do Rio Branco, MG, Brazil: Suprema Gráfica e Editora. 185 p.
10 CHAPTER 1
Energy and Protein Requirements of Crossbred (Holstein × Gyr) Growing
Bulls
Daniela Batista Oss1,2¶&, Marcos Inácio Marcondes1*¶, Fernanda Samarini Machado3¶, Thierry Ribeiro Tomichi3¶, Mariana Magalhães Campos3¶, Marcelo Messias Duarte Castro1&, Tadeu Eder da Silva1& and Luiz Gustavo Ribeiro Pereira3
1
Universidade Federal de Viçosa, Departamento de Zootecnia, Viçosa, MG, Brazil
2
CAPES, Ministério da Educação, Brasília, DF, Brazil
3
Empresa Brasileira de Pesquisa Agropecuária, Embrapa Gado de Leite, Juiz de Fora, MG, Brazil
These authors contributed equally to this work
&
These authors also contributed equally to this work
*
Corresponding author: marcosinaciomarcondes@gmail.com
11
Abstract
The objective of this study was to estimate the energy and protein requirements of
crossbred (Holstein × Gyr) growing bulls. Twenty-four 10 months old bulls (initial body weight (BW) = 184 ± 23.4 kg) were used in a comparative slaughter trial. Six bulls were slaughtered at
the beginning of the experiment as the reference group, in order to estimate initial empty body weight (EBW) and energy and protein contents of the remaining animals. The remaining bulls were assigned to a completely randomized design with 3 levels of DM intake, with 6 replicates.
The levels of DM intake were: 1.2% of BW, 1.8% of BW and ad libitum – target orts 5%. The remaining bulls were slaughtered at the end of the experiment. Bulls were fed a diet consisting of
59.6% corn silage and 40.4% concentrate on a DM basis. The equation adjusted that demonstrate the relationship between EBW and BW was EBW= 0.861±0.0031 × BW. While the relationship
between empty body gain (EBG) and average daily gain (ADG) may be demonstrated using the
equation: EBG = 0.934±0.0111 × ADG. The net energy requirements for maintenance (NEm) was
74.8±2.89 kcal/EBW0.75/d, the metabolizable energy requirements for gain (MEm) was 120.8
kcal/EBW0.75/d. The efficiency of the use of metabolizable energy for maintenance (km) detected
was 61.9%. The equation adjusted to estimate the net energy for gain (NEg) was:
NEg=0.049±0.0011 ×EBW0.75 × EBG0.729±0.0532. The efficiency of the use of metabolizable energy
for gain (kg) observed was 30.8%. The metabolizable protein requirements for maintenance
(MPm) was 3.05 g/kg BW0.75. The equation adjusted to estimate the net protein requirements for
gain was: NPg= (87.138±65.1378 × EBG) + (40.436±21.3640 × NEg). The efficiency of the use of
metabolizable protein for gain (k) observed was 53.6%. We conclude that the estimates of energy
12
Introduction
Experiments that seek estimate nutrient requirements of specific breeds may be justified
due to the need of increasing the database to enable new meta-analysis to allow updates and validations of more consistent models. Undoubtedly, all nutrient requirements systems around
the world have the responsibility to move the science forward by including models in their systems that was constructed on a substantial amount of data.
The Bos taurus indicus cattle and their crossbreds are commonly used in dairy and beef
production in tropical regions. The objective of using Bos taurus indicus for crossbreeding (Bos
taurus indicus × Bos taurus taurus) is to overcome limitations regarding hot and humid weather,
intense sunshine, parasites and utilization of poor quality forages [1].
The dairy Gyr (Bos taurus indicus) breed has mainly been selected for milk yield and it is found throughout in countries such as Brazil. The desirable characteristics in dairy Gyr have
raised the interest of other tropical countries, resulting in the exportation of semen and animals to Africa and Central and South America [2]. In Brazil for example, about 70% of milk production
comes from crossbred (Holstein × Zebu) cows, being the most common crossbreeding Holstein × Gyr [3].
Surely, the Nutrient Requirements of Dairy Cattle [4] is the most widely system used to
balance diets for dairy cattle. However, the equations to estimate energy and protein requirements presented by this system for growing animals are from a study involving mostly
beef British breeds [5] which was the same adopted by the Nutrient Requirements of Beef Cattle [6]. The Nutrient Requirements of Dairy Cattle [4] adopted the same equations because they
13 then, it seems that experiments seeking estimating nutrient requirements of dairy growing cattle have faded.
In an attempt to provide information regarding nutrient requirements of cattle used in tropical regions (mainly Nellore and Nellore × Bos taurus taurus), Brazilian researchers
published a nutrient requirements system for beef cattle, the BR-CORTE [8]. Although this was a great step taken by Brazilian researchers, and considering that crossbred Holstein × Gyr cattle is very representative in countries including Brazil, and others from Africa and Central and
South America, it is undeniable that estimates of nutrient requirements of this crossbreeding is still a gap.
Therefore, we believe that determining the nutrient requirements of crossbred cattle (Holstein × Gyr) and providing appropriate knowledge to balance diets is absolutely necessary to avoid excessive or insufficient nutrient supply for these animals [9]. In addition, information
about requirements of Holstein × Gyr is scarce in the literature [10, 11]. Taking into account that the greater operational cost of production in meat or dairy production is due to nutrition, it can
generate a big economic impact in cattle production systems in tropical conditions once the Holstein × Gyr cattle are very representative in the meat and dairy market.
Given these reasons, the objective of this study was to estimate energy and protein
requirements for maintenance and gain of crossbred (Holstein × Gyr) growing bulls.
Materials and Methods
14 Livestock Bioefficiency and Sustainability at the Embrapa Gado de Leite (Embrapa Dairy Cattle), in Coronel Pacheco, MG, Brazil, from August 2013 to February 2014.
Animals, diet and experimental design
Twenty-four Holstein × Gyr crossbred 10 months old bulls (initial body weight = 184 ±
23.4 kg) were used. Initially, all bulls were treated for ectoparasites and endoparasites (Ivomec, Paulina, São Paulo, Brazil). The bulls were randomly subdivided into 4 groups of 6 animals at
the beginning of the experiment. One of those groups was designated as baseline reference group, and it was slaughtered at the beginning of the experiment to estimate initial body weight (EBW) and initial body energy and protein content of the other animals. The 3 remaining groups
were fed at 3 levels of DM intake: (1) 1.2% of BW (close to maintenance level); (2) 1.8% of BW or (3) ad libitum – target 5% orts. These treatments were chosen intending to achieve a variability in the metabolizable energy and protein intake (MEI and MPI) to obtain a better model‘s adjustment. One animal from the ad libitum group had to be removed from the
experiment due to health issues. Bulls were housed in a tie stall system with free access to water.
The diet was formulated according to BR-CORTE [8] for an average daily gain (ADG) of 1.2 kg/d. Throughout the study, bulls were fed a diet consisting of corn silage and concentrate
(59.6: 40.4 DM basis) once daily. The concentrate was composed of: soybean meal, ground corn, urea, mineral mix and limestone (Table 1). The feed ingredients of the concentrate were collected for analysis at the time concentrate was manufactured. Representative samples of
15 basis) from each day. Feed DM offered and refused were weighed to determine total daily dry matter intake (DMI).
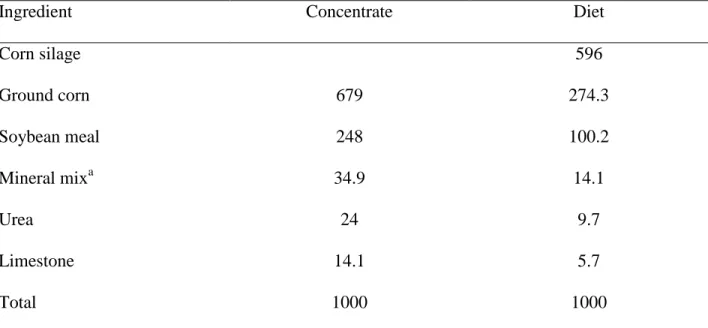
Table 1. Composition of the concentrate and experimental diet (g/kg; DM basis)
Ingredient Concentrate Diet
Corn silage 596
Ground corn 679 274.3
Soybean meal 248 100.2
Mineral mixa 34.9 14.1
Urea 24 9.7
Limestone 14.1 5.7
Total 1000 1000
aGuarantee levels: Ca: 200 g/kg min; P: 60 g/kg; Mg: 20 g/kg; K: 35 g/kg; S: 20 g/kg; Na: 70g/kg; Co: 15 mg/kg;
16 Table 2. Chemical composition of the ingredients used in experimental diets (g/kg; DM basis)
Item Corn silage Concentrate Diet
Dry matter 307.2 891.8 543.4
Organic matter 947.7 924.8 938.4
Crude protein 77.3 252.5 148.1
Ether extract 24.4 35.1 28.8
NDFa 464.6 145.8 335.8
NFCb 381.4 491.3 425.8
GEc (Mcal/kg) 4.3 4.3 4.3
a
Neutral detergent fiber; bNon-fibrous carbohydrates; cGross energy
The samples were analyzed for contents of dry matter (DM; [12] method 930.15), ash ([12] method 924.05), crude protein (CP; [12] method 984.13), ether extract (EE; [12] 1990;
method 920.39), neutral detergent fiber (NDF; [13]) with heat stable amylase and expressed exclusive of residual ash, and non-fibrous carbohydrates (NFC; [14]). Gross energy was determined using an adiabatic calorimeter (model C-5000, Labcontrol IKA, São Paulo, SP). The
bulls were weighed at 15 d intervals at 0730 AM before feeding (0830 AM) to calculate ADG. The animals from the 3 remaining groups were slaughtered at the end of the experiment to
determine their final EBW and final body energy and protein content. The experiment lasted 173 d, 171 d and 168 d for the groups 1.2% of BW, 1.8% of BW and ad libitum respectively, when the slaughter was performed.
17 Two digestibility trial were conducted at 2 points throughout the experiment: 2 months after the reference slaughter and 2 months before the final slaughter. The total feces and urine
were collected for three consecutive days from all animals from the remaining groups [15]. At the end of each collection day, feces of each animal were weighed. The feces were sampled after
homogenization. The samples were weighed, dried in a forced-ventilation oven (55oC) for 72 h, and ground through a 1 mm screen (Wiley mill; A. H. Thomas, Philadelphia, PA). One composite sample per animal, based on the DM weight for every collection day was prepared for
chemical analysis. The same chemical analysis that were performed for experimental diet were performed for feces to calculate the DM, nutrients and energy digestibility coefficients.
Metabolizable energy content was determined by multiplying digestible energy by 0.82 [6]. The urine collection was performed by using collecting rubber funnels attached to the bulls. Each funnel had a hose to carry the urine to an individual polyethylene container
containing 20% H2SO4 intending to reduce N and purine derivative losses. Also, each container
was kept immersed in ice. After each 24 h collection day, the total urine excreted was weighed
and measured. The contents of each container were homogenized and a 50 mL sample was taken and stored at -20oC for further laboratory analysis.
A nitrogen balance was performed at each digestibility trial to estimate digested nitrogen
(DN) and retained nitrogen (RN). The DN was calculated as the difference between N intake and fecal N, while the RN was calculated as the difference between the DN and the urinary nitrogen.
The metabolizable protein intake (MPI) was calculated as the sum of the true microbial protein digestible and the digestible ruminally undegraded protein (DRUP) intakes. The microbial protein production was calculated from the purine derivative excretion that is the sum
18 concentrations by the daily urinary volume [16]. The true fraction and digestibility adopted for microbial protein was 80% and 80%, respectively [4]. The ruminally undegraded protein (RUP)
intake was calculated as the difference between the crude protein intake and the rumen-degradable protein (RDP) intake. The digestibility adopted for RUP was 80%. The RDP intake
was calculated taking into account an efficiency of N utilization in the rumen of 90% [4].
Slaughter and sampling
All bulls were fasted for 16 h to obtain the shrunk body weight (SBW) before slaughter. Bulls from the same group were slaughtered on the same day. Bulls were slaughtered by using captive bolt stunning followed by bleeding. The blood was sampled at the moment of bleeding to
avoid sampling after coagulation. After bleeding, the gastrointestinal tract was removed and it was washed out to winkle out all digesta. The heart, lungs, liver, spleen, kidneys, the fat around the kidney, pelvis and heart (KPH fat), diaphragm, mesentery, tails, trimmings, and cleaned
gastrointestinal tracts were weighed. The carcasses, head, leather, limbs and blood were also weighed to determine the EBW.
The rumen, reticulum, omasum, abomasum, small and large intestines, KPH fat, mesentery, liver, heart, kidneys, lung, tongue, spleen, diaphragm, esophagus, trachea, tails and
reproductive tract of each bull were homogenized in an industrial cutter for 20 min. A sample then was taken to compose a ―sample of organs and viscera‖.
After removing the leather, the head and limbs were ground in a bone crusher for 20 min. A sample then was taken to compose a ―sample of head and limbs‖. The leather of each animal
was sampled in two parts to represent the shoulder, three parts to represent the dorsal line, two
19 and one part to represent the head, which altogether represented the entire leather [17]. All parts of the leather were minced in about 2 cm2 small pieces. A sample then was taken to compose a ―sample of leather‖.
After slaughter, the carcasses of each animal were split into two half-carcasses which
were chilled at 4°C for 18 h. After the 18 h-period, the left half-carcass was ground in a bone crusher for 20 min and it was transferred to an industrial cutter to be homogenized for 20 min. After homogenization, a sample was taken to compose a ―sample of carcass‖.
All samples from each animal (blood, organs and viscera, head and limbs, leather and carcass) were previously lyophilized before to be ground in a knife mill (2 mm) and after in an
industrial blender by adding liquid nitrogen. A composite sample of the whole animal was made by using relative individual proportion (DM basis) in the EBW. It was homogenized by using an industrial blender by adding liquid nitrogen for further laboratory analysis.
The DM, CP, EE, ash, and GE contents were determined on the composite sample of the whole animal, following the methods described above for experimental diet ingredients and
feces.
Procedures used to verify relationship among live, shrunk and
empty body weight and between average daily gain and empty body
gain
To verify the relationship among live, shrunk and empty body weight a linear regression
was performed as follows:
[Equation 1]
20 Where EBW is empty body weight (kg), SBW is shrunk body weight (kg) and BW is live body weight (kg) and β0 and β1 are regression parameters.
To verify the relationship between average daily gain and empty body gain a linear regression was performed as follows:
[Equation 2]
Where EBG is empty body gain (kg/d), ADG is average daily gain (kg/d) and β0 and β1
are regression parameters.
Procedures used to estimate energy requirements
To estimate the net energy requirements for maintenance (NEm) it was used a non-linear
exponential model to describe the relationship between heat production (HP) and metabolizable energy intake (MEI) according to the model [18]:
[Equation 3]
Where HP is the heat production (Mcal/EBW0.75), MEI is the metabolizable energy intake (Mcal/EBW0.75), and β0 and β1 are regression parameters. Under this model, β0 represents the
NEm.
By the iterative method, the point where MEI equals to HP can be determined, and this
point is considered the metabolizable energy requirement for maintenance (MEm).
21 above in Digestibility trial section and the RE was determined as the difference between the final energy content and initial energy content in the EBW.
The efficiency of use of metabolizable energy for maintenance (km) was obtained from the relation between the NEm and the MEm [6], by the following:
[Equation 4]
To predict the net energy requirements for gain (NEg) the following model was used [19]:
[Equation 5]
Where RE is the retained energy (Mcal/d), EBW0.75 is the metabolic empty body weight, EBG is the empty body weight gain (kg/d) and β0 and β1 are regression parameters. Under this
model, RE represents the NEg.
To estimate the metabolizable energy requirements for gain (MEg), it was needed to
estimate the efficiency of the use of metabolizable energy for gain (kg). The kg was estimated as
the slope of the regression of RE on the MEI for gain as the following model [20]: [Equation 6]
Where RE is retained energy (Mcal/EBW0.75/d), MEIg is metabolizable energy intake for
gain (Mcal/EBW0.75/d) which was estimated as the difference between total MEI (Mcal/EBW0.75/d) and MEIm (Mcal/EBW0.75/d) estimated as described above, and β0 and β1 are
regression parameters. Under this model, β1 represents the kg.
The MEg was then obtained from the relation between the NEg and the MEg, by the
22 [Equation 7]
Procedures used to estimate protein requirements
The metabolizable protein for maintenance (MPm) was estimated by the relationship
between the intercept (β0) from the linear regression between the metabolizable protein intake
(MPI) and the empty body gain (EBG) as following [21]:
[Equation 8]
Where MPI is metabolizable protein intake (g/d), EBG is empty body gain (kg/d), and β0
and β1 are regression parameters. The MPm was then estimated by the relation between the β0 and
the average metabolic body weight (BW0.75) as following [6]:
[Equation 9]
Where MPm is the metabolizable protein requirements for maintenance (g/kg BW0.75), β0
is the parameter determined from the Equation 8 and BW0.75 is the average metabolic body weight.
The net protein requirements for gain (NPg) was estimated by using a model involving
EBG and RE, as following [6, 8]:
[Equation 10]
23 Where RP is retained protein (g/d); EBG is empty body gain (kg/d), RE is retained energy (Mcal/d) and and β0 and β1 are regression parameters.
The efficiency of the use of metabolizable protein for gain (k) was estimated by the linear relationship between retained nitrogen (RN) and digested nitrogen (DN) according to the
following model:
[Equation 11]
Where RN is retained nitrogen (g/d), DN is digested nitrogen (g/d) and β0 and β1 are
regression parameters. The RN and DN were determined as described above in Digestibility trial section. The RN and DN from both digestibility trial were pooled together to analyze the linear
relationship between them once there was no statistical difference between the RN and DN from both digestibility trials. Under the Equation 11, the β1 is the efficiency of the use of
metabolizable protein for gain (k).
The relation between the NPg and the k was used to estimate the metabolizable protein
requirements for gain (MPg):
[Equation 12]
Where MPg is the metabolizable protein requirements for gain (g/kg EBW0.75/d), NPg is
the net protein requirements for gain (g/kg EBW0.75/d ) and k is the efficiency of the use of metabolizable protein for gain.
24 The DM, nutrients and energy intake and digestibility coefficients were analyzed using a mixed model (PROC MIXED of SAS Inst. Inc., Cary, NC) where digestibility trail was
considered random effect in the model and treatments as fixed effects. The level of 0.05 was used as critical level of probability and the Tukey-Kramer test was used to detect difference
between treatments.
The models described above were fit as linear and non-linear models built by the feature PROC MIXED and PROC NLIN of SAS respectively. The data analyzed as non-linear models
were adjusted by the Gauss-Newton method. For all models, outliers were removed when the studentized residuals were greater than |2|, and 0.05 was used as critical level of probability to
verify the significance of parameters of the models.
Results
The DM, nutrients and energy intake and digestibility coefficients
The DM, nutrients and energy intake were different among treatments (Table 3). The
treatment 1.2% of BW presented greater DM, nutrients and energy digestibility coefficients when compared to treatments 1.8% of BW and ad libitum. The treatment 1.8% of BW presented greater DM, OM, NFC and GE digestibility coefficients compared to ad libitum treatment (Table
25 Table 3. Least square means, standard error and significance of effects for nutrient (kg) and energy (Mcal) intake according to levels of DM supply
Item
DM intake level
SE P-value
1.2 % of BW (n=6)
1.8% of BW (n=6)
Ad Libitum
(n=5)
DMIa 2.20c 4.24b 7.66a 0.584 0.001
OMIb 2.06c 3.97b 7.18a 0.361 0.001
CPIc 0.33c 0.64b 1.19a 0.056 0.001
EEId 0.06c 0.12b 0.23a 0.011 0.001
NDFIe 0.72c 1.38b 2.47a 0.133 0.001
NFCIf 0.94c 1.83b 3.30a 0.161 0.001
TDNIg 1.64c 2.95b 5.07a 0.270 0.001
GEIh 9.38c 18.08b 32.67a 1.645 0.001
DEIi 6.91c 12.38b 21.19a 1.552 0.001
MEIj 5.67c 10.15b 17.37a 1.273 0.001
a
dry matter intake; borganic matter intake; ccrude protein intake; dether extract intake; eneutral detergent fiber intake;
fnon-fiber carbohydrates intake; gtotal digestible nutrients intake; hgross energy intake; idigestible energy intake; j
metabolizable energy intake
26 Table 4. Least square means, standard error and significance of effects for nutrient (g/kg) and energy (kcal/Mcal) digestibility coefficients according to levels of DM supply
Itema
DM intake level
SE P-value
1.2 % of BW (n=6)
1.8% of BW (n=6)
Ad Libitum
(n=5)
DM 744a 698b 659c 9.6 0.001
OM 760a 712b 674c 9.3 0.001
CP 727a 691b 679b 11.6 0.001
EE 886a 829b 808b 21.3 0.001
NDF 632a 540b 514b 16.6 0.001
NFC 860a 841a 781b 10.3 0.001
GE 737a 685b 648c 10.7 0.001
aDigestibility coefficients of: DM = dry matter; OM = organic matter; CP = crude protein; EE = ether extract; NDF
= neutral detergent fiber; NFC = non-fiber carbohydrates and GE = gross energy a-c Means within intake level in a row followed by different letters differ (P≤0.05)
Energy and protein requirements
The descriptive database of the bulls that were used in this study is shown in Table 5. The summary of all equations fit for estimating the total requirements of energy and protein of
27 Table 5. Descriptive of the database (mean ± SD) used to obtain the energy and protein requirements of crossbred (Holstein × Gyr) growing bulls
Item
DM intake level
1.2 % of BW (n = 6)
1.8% of BW (n = 6)
Ad Libitum
(n = 5)
BWinitiala (kg) 181.5 ± 22.42 187.8 ± 29.32 182.6 ± 21.13
BWfinalb (kg) 190.5 ± 24.71 281.3 ± 50.62 388.2 ± 48.77
EBWinitialc (kg) 151.6 ± 18.73 156.9 ± 24.49 152.5 ± 17.64
EBWfinald (kg) 166.3 ± 18.62 244.6 ± 44.43 343.8 ± 46.00
DMIe (%BW) 1.25 ± 0.027 1.90 ± 0.034 2.76 ± 0.188
ADGf (kg/d) 0.05 ± 0.061 0.55 ± 0.130 1.22 ± 0.232
EBGg (kg/d) 0.09 ± 0.039 0.51 ± 0.128 1.14 ± 0.229
REh (Kcal/EBW0.75) 10.0 ± 3.54 28.8 ± 5.16 54.8 ± 8.45 MEIi (Kcal/EBW0.75) 133.3 ± 5.17 199.8 ± 9.35 285.0 ± 23.14 HPj (Kcal/EBW0.75) 123.3 ± 4.59 171.0 ± 9.44 230.1 ± 25.12 RPk (g/EBW0.75) 37.1 ± 9.38 120.1 ± 28.25 232.2 ± 44.29
PMIl (g/EBW0.75) 5.1 ± 0.18 8.1 ± 0.48 12.8 ± 1.42
REf m (%) 52.7±11.93 58.1±7.51 64.2±2.75
REpn(%) 47.3±11.93 41.9±7.51 36.1±2.75
EBGpo(g/kg EBW) 605±27.7 561±28.5 519±30.7
EBGfp(g/kg EBW) 236±29.0 304±44.3 395±25.1
a
BWinitial = initial body weight; b
BWfinal = final body weight; c
EBWinitial = initial empty body weight; d
EBWfinal = final
28 retained protein; lPMI = protein metabolizable intake; mREf = percentage of RE deposited as fat; nREp = percentage
of RE deposited as protein; oEBGf = proportion of fat in EBG; pEBGp = proportion of protein in EBG.
Table 6. Abstract of estimative models of energy and protein requirements of crossbred (Holstein × Gyr) growing bulls
Item Equation Unit
SBW 0.976 × BW kg
EBW 0.882 × SBW kg
EBW 0.861 × BW kg
EBG 0.934 × ADG kg/d
Energy requirements
NEm 0.075 × EBW0.75 Mcal/d
km 61.9 %
MEm 0.121 × EBW0.75 Mcal/d
NEg 0.049 × EBW0.75 × EBG0.729 Mcal/d
kg 30.8 %
MEg NEg/ Kg Mcal/d
MEt MEm + MEg Mcal/d
TDN MEt/0.82/4.409 kg/d
Protein requirements
MPm 3.05 × BW0.75 g/d
NPg (87.138 × EBG) + (40.436 × NEg) g/d
29
MPg NPg/k g/d
MPt MPm + MPg g/d
MicP 110 × TDN g/d
RDP 1.11 × MicP g/d
RUP [(MPt – (MicP × 0.64)]/0.80 g/d
CP RDP + RUP g/d
Relationship among live, shrunk and empty body weight and between average
daily gain and empty body gain
The equation adjusted from the relationship between SBW and BW was (MSE=19.009; r2=0.997):
[Equation 13]
The equation adjusted from the relationship between EBW and SBW was (MSE=51.179;
r2=0.942):
[Equation 14]
The equation adjusted from the relationship between BW and EBW was (MSE=8.720; r2=0.972):
[Equation 15]
30 Similarly, the intercept of the linear regression between ADG and EBW was not different of zero (P=0.0981) and the equation adjusted from the relationship between ADG and EBG was
(MSE=0.001; r2=0.973):
[Equation 16]
Energy requirements
The NEm observed in our study was 74.8 kcal/EBW0.75/d according to the following
equation (MSE=0.00005; r2=0.969):
[Equation 17]
Through iterative method the MEm was determined as 120.8 kcal/EBW0.75/d, and km was
61.9%.
To estimate the NEg the following equation was adjusted (MSE=0.044; r2=0.991):
[Equation 18]
The kg observed in this study was 30.8% (Fig 1).
Fig 1. The relationship between retained energy (RE) and metabolizable energy intake for gain (MEIg) of Holstein × Gyr crossbred growing bulls. This figure shows the linear relationship between retained energy and metabolizable energy intake for gain (MEIg) of
31 gain (kg)is the slope of the regression. The equation adjusted was: RE = 0.006±0.0026 + 0.308±0.0284
× MEIg (MSE=0.00004; r2=0.894;).
Protein requirements
The parameter β0 observed from the Equation 8 was 181.0 ± 27.8. Then, the equation
adjusted to estimate the MPm was:
[Equation 19]
As the average BW0.75 was 59.3 ± 9.82 kg, thus the MPm estimated in this study was 3.05
g/BW0.75/d.
The equation adjusted to estimate the NPg was (MSE=314.89; r2=0.903):
[Equation 20]
The k observed in this study was 53.6% (Fig 2).
Fig 2. The relationship between retained nitrogen (RN; g/d) and digested nitrogen (DN; g/d) of Holstein × Gyr crossbred growing bulls. This figure shows the linear relationship between retained nitrogen (RN; g/d) and digested nitrogen (DN; g/d) of Holstein × Gyr crossbred
growing bulls where the efficiency of use of metabolizable protein for gain (k)is the slope of the regression. The equation adjusted was: RN = -16.525±3.9685 + 0.5358±0.0489 × DN (MSE=90.999;
32
Discussion
The DM, nutrients and energy intake and digestibility coefficients
Naturally, animals under restricted DM supply when compared to ad libitum treatment
presented lower nutrients and energy intake (P=0.001; Table 3).
The DM, OM, CP, EE, NDF, CNF and energy digestibility coefficients were 12.9%,
12.8%, 7.1%, 9.7%, 22.9%, 10.1%, and on average 13.7% greater for the 1.2% of BW treatment (maintenance) when compared with the ad libitum treatment. The decrease in digestibility according to the increase of DM intake was previously reported [22]. This occurs due to a higher
ruminal digesta passage rate [23], which results in a short time available to digestion by the microbial population in the rumen [24]. When the level of intake is decreased, as occurred for
maintenance treatment (1.2% of BW), there is a greater retention time of particle in the rumen and in total gastrointestinal tract, besides a reduction in the average size of ruminal and rectal particle [25].
Relationship among live, shrunk and empty body weight and
between average daily gain and empty body gain
The average ratio between SBW and EBW in this study was 0.882, value that was close
33 The average ratio between ADG and EBG was 0.934, while the ratio reported by the BR-CORTE [8] was 0.966 for crossbred cattle (Nellore × Bos taurus taurus) and the ratio reported
by the NRC dairy cattle [4] and CSIRO system [26] were 0.960 and 0.917 respectively.
Energy requirements
In our study the NEm observed was 74.8 kcal/EBW0.75. The NEm requirements of beef
cattle (British breeds) have been estimated as 77 kcal/EBW0.75 [6, 18] while the NRC dairy cattle [4] uses a value of 80 kcal/BW0.75. The NEm requirements of B. indicus proposed by the NRC
beef cattle [6] is 70 kcal//EBW0.75. The NEm reported by the BR-CORTE [8] for crossbred cattle
was 74.2 kcal/EBW0.75. Although the BR-CORTE‘s database contained only 7 animals (of 753) Nellore × Holstein, its reported NEm is very similar to ours.
It was latter observed for finishing Holstein × Zebu bulls a NEm equal to 78.7
kcal/EBW0.75 [11] what is coherent once as animals grow, the energy requirements increase. The NEm requirements of crossbred Holstein × Gyr bulls estimated in this study is intermediate to
those observed for purebred cattle (Bos taurus indicus or Bos taurus taurus) and slightly lower than that indicated for growing dairy cattle by the NRC dairy cattle [4]. It is possible to observe
(S1 Spreadsheet) that our result generated an intermediate value for estimates of NEm when
compared to the estimates generated from the NRC dairy and beef cattle [4, 6] and the
BR-CORTE [8]. This suggests that dairy crossbreds Bos taurus taurus × Bos taurus indicus present a higher requirement than beef crossbreds Bos taurus taurus × Bos taurus indicus but a lower requirement when compared to purebreds.
The MEm estimated in this current study was 120.8 kcal/EBW0.75 and the km was 61.9%,