cows during pre- and postpartum
Ana Paula Saldanha Franzoni(1), Joana Ribeiro da Gloria(1), Anna Luiza Belli de Souza Alves Costa(1),
Ronaldo Alves Martins(1), Thiago Fernandes Amaral(2), Rafael Alves de Azevedo(1),
Ernane Ferreira Campos(3) and Sandra Gesteira Coelho(1)
(1)Universidade Federal de Minas Gerais, Escola de Veterinária, Campus Pampulha, Avenida Antônio Carlos, no 6.627, CEP 31270-901 Belo Horizonte, MG, Brazil. E-mail: [email protected], [email protected], [email protected], [email protected], [email protected], [email protected] (2)Faculdade Alis de Bom Despacho, BR 262, Km 480, Caixa Postal 160, CEP 35600-000 Bom Despacho, MG, Brazil. E-mail: [email protected] (3)ReHagro, Rua Santa Fé, no 100, Sion, CEP 30320-130 Belo Horizonte, MG, Brazil. E-mail: [email protected]
Abstract – The objective of this work was to describe the effect of genetic composition on body condition score (BCS), on total lactation production, and on metabolic and hormone profiles of Holstein x Gyr cows under the same pre- and postpartum management conditions. The genetic groups ½ (n=8), ¾ (n=10), and ≥⅞ (n=10) Holstein x Gyr (HG) were evaluated within the same farm, and all of them showed typical lactation curves. The time required to reach peak production did not differ between groups. The groups also did not differ as to time to reach the lowest BCS after calving or to recover BCS after calving, nor as to their BCS values in the week of first ovulation, number of weeks required for first ovulation, and service period. However, ½ HG cows had higher BCS at calving, but also greater BCS loss postpartum. Total lactation production and plasma insulin concentrations of ¾ HG cows postpartum were similar to those of cows specifically selected for milk production. Using parameters obtained with Holstein cows to determine management conditions in farms with crossbred cows can have unwanted consequences, since these animals have different metabolic and hormone profiles.
Index terms: Bos indicus, Bos taurus, GH, IGF-1, lactation curve, transition period.
Perfis metabólico e hormonal de vacas Girolando em pré e pós-parto
Resumo – O objetivo deste trabalho foi descrever o efeito da composição genética no escore de composição corporal (ECC), na produção total da lactação, e nos perfis metabólico e hormonal de vacas Girolando sob mesmo manejo pré e pós-parto. Os grupos genéticos ½ (n=8), ¾ (n=10) e ≥⅞ (n=10) Holandês x Gir (HG) foram avaliados em uma mesma fazenda, e todos eles apresentaram curvas de lactação típicas. O tempo necessário para atingir o pico de produção não diferiu entre os grupos. Os grupos também não diferiram quanto ao tempo gasto para atingirem o menor ECC ou para recuperarem o ECC após o parto, nem quanto aos seus valores de ECC na semana da primeira ovulação, ao número de semanas requeridas para primeira ovulação e ao tempo de serviço. No entanto, vacas ½ HG tiveram maior ECC ao parto, mas também maior perda de ECC no pós-parto. Já a produção total de leite na lactação e as concentrações de insulina no plasma de vacas ¾ HG no pós-parto foram similares aos das vacas selecionadas para produção de leite. O uso de parâmetros obtidos com vacas Holandesas para determinação do manejo em fazenda com vacas cruzadas pode ter consequências indesejáveis, uma vez que esses animais apresentam perfis metabólico e hormonal distintos.Termos para indexação: Bos indicus, Bos taurus, GH, IGF-1, curva de lactação, período de transição.
Introduction
Milk production in the tropics is a constant challenge due to the lower adaptability of specialized dairy breeds to this climate and to the somewhat worse environmental, nutritional, and sanitary conditions compared with temperate regions. The energy cost at critical temperatures leads to nutritional imbalances
and metabolic disorders that increase production costs,
resulting in lower total lactation production (Campos G. et al., 2007). In this context, the Holstein x Zebu cross
emerged as an alternative to reduce impacts on dairy production and cow reproduction in several regions of
environmental conditions and it has been intensely used in dairy crossbreeding, being the preferred breed for this purpose in the country (Pereira et al., 2012; Weller et al., 2016).
Although crossbred animals represent the majority used for milk production in Brazil, their nutritional and reproductive management is based on data
from Holstein animals, with little knowledge about
metabolism and homeorhesis during the transitional
period, associated with ½ and ¾ Holstein x Zebu
crosses. In addition, there are few evaluations of the performance of these genetic compositions when subjected to the same nutritional management, during a same period, in a same environment. These characteristics are desirable for this type of study, in order to eliminate variables not related to genetic composition.
The objective of this work was to describe the effect of genetic composition on body condition score, on total lactation production, and on metabolic and
hormone profiles of Holstein x Gyr cows under the
same pre- and postpartum management conditions.
Materials and Methods
The protocols used in this study were approved by the animal ethics committee of Universidade
Federal de Minas Gerais (UFMG, protocol number
370/2013). The trial was performed from January 2014
to February 2015, in Pitangui, in the state of Minas Gerais, Brazil. The temperature and humidity index (THI) was calculated using the model proposed by
Armstrong (1994) from data obtained in a weather
station of Bom Despacho, also located in Minas Gerais. Pluriparous Holstein x Gyr (HG) cows (n=28) were used from three weeks before the expected calving date
until the end of lactation. Their genetic composition was
½ HG (n = 8), ¾ HG (n = 10), and ≥⅞ HG (n=10; six ⅞ HG, two 15/
16HG, and two Holstein cows). All animals
were subjected to the same management conditions during prepartum (rotational grazing with Urochloa
spp. (syn. Brachiaria spp.) grass, supplemented with corn silage and concentrate supplied once a day in the morning), and were allocated to paddocks with shade, water and mineral salt ad libitum.
Throughout lactation, the animals were confined
during the day and released to graze at night, in a rotational system with Megathyrsus maximus (Jacq.)
B.K.Simon & S.W.L. Jacobs, 2003 (syn. Panicum
maximum Jacq.) 'Mombasa' grass, with one-day
occupation period, from January to April 2014 and
from November 2014 to February 2015. From May to
October 2014, the cows were allocated to a paddock with shade, mineral salt and water ad libitum, and were fed a complete diet composed of corn silage, soybean meal, ground corn, minerals, and vitamins; the diet was provided twice a day, after milking, in the feeding lane.
The cows were milked twice a day, at intervals of
12 hours, in a fishbone milking parlor with 24 sets (2x12=24) and an automatic cluster removal system,
without the presence of their calves and without
oxytocin. Milk production was weighed weekly,
between the second and ninth week postpartum, and monthly, until the end of lactation, using the
Alpro FloMaster Pro milk meter (DeLaval Brasil,
Jaguariúna, SP, Brazil). Production data were obtained in two consecutive days, considering the average between the two weighings. After 70 days postpartum (after the blood sampling period), all cows received a subcutaneous injection of 500 mg rbST (Lactotropin)
every 14 days, up to 14 days before the expected
dry-off date.
Blood samples were collected to determine plasma concentrations of progesterone, insulin, insulin-like
growth factor 1 (IGF-1), growth hormone (GH), glucose, and non-esterified fatty acids (Nefa). Sampling was done at nine, seven, and five days before the expected
calving date, as well as once a week until the ninth
week postpartum (in the first week postpartum, two
samplings were collected on days three and seven). Samples for Nefa and glucose concentrations, up to the seventh week postpartum, were obtained in the morning before diet supply, by venipuncture of the coccygeal vein using Vacutainer (5 mL) with sodium
fluoride for glucose analyzes and EDTA for the other
analyzes. The blood was immediately centrifuged at 3,500 g, for 15 min, and the plasma was divided into 1.5 mL aliquots and immediately stored at -20°C. In the blood sampling days, the BCS was assessed according
to Gottschall et al. (2012).
The following variables were evaluated: time until
first ovulation, in weeks, for progesterone level to rise
above 1.0 ng mL-1 (Bisinotto et al., 2015); service period;
lactation length, in days; BCS at calving, obtained on
ovulation, determined on the week in which plasma progesterone concentrations were above 1.0 ng mL-1;
BCS loss, considered as the difference between BCS at calving and the lowest BCS after calving; days to the lowest BCS after calving; and days to recover BCS after calving, in days to recover BCS after calving.
Nefa and glucose were analyzed with colorimetric
methods, at the clinical pathology laboratory of UFMG, using the Cobas Mira Plus device (Roche Diagnóstica
Brasil Ltda., São Paulo, SP, Brazil). The enzymatic kits
used to determine glucose and Nefa were CGL1611 and FA 115 (Randox Brasil, São Paulo, SP, Brazil), respectively. Progesterone, insulin, IGF-1, and GH were
analyzed at the laboratory of animal endocrinology of Universidade Estadual Paulista Júlio de Mesquita
Filho. Insulin and progesterone were quantified by
radioimmunoassay. The Porcine Insulin RIA kit with 250 tubes (Merck Millipore Brazil, Barueri, SP, Brazil) was used for insulin analysis, and the intra- and
inter-assay coefficients of variation (CVs) were 9.94 and 10.72%, respectively. For progesterone analysis,
the IM1188 Progesterone RIA kit (Beckman Coulter do Brasil Com. e Imp. de Prod. de Lab. Ltda., Barueri, SP, Brazil) was used, and the intra- and inter-assay
CVs were 3.12 and 8.06%, respectively. The IGF-1
was determined with the in-house Elisa method, and the intra- and inter-assay CVs were 7.50 and 10.43%,
respectively. The GH was quantified by Elisa using the biotin-streptavidin-peroxidase amplification system in
a competitive assay, and the intra- and inter-assay CVs were 10.8 and 4.6%, respectively.
Lactation curves were adjusted for each animal by the incomplete gamma function (Wood, 1967), which was used to estimate: total and peak production, days to reach peak production, average lactation curve for each genetic group, and average monthly milk production
during the first and second months of lactation. The fixed effect of genetic group was evaluated
on the following variables: average monthly milk
production during the first and second months of
lactation; total lactation production; days to reach peak production; peak milk production; weeks to
first ovulation; service period; lactation length; BCS at calving; BCS in the week of first ovulation; BCS
loss; days to the lowest BCS after calving; days to recover BCS after calving; and plasma concentrations
of Nefa, glucose, insulin, IGF-1, and GH. The analyses
were carried out using the SAS software, version 9.0
(SAS Institute, Inc., Cary, NC, USA). The normality
of the data was verified with Shapiro-Wilk’s test, and homoscedasticity, with Bartlett’s test.
The analysis of variance was performed for: average
monthly milk production during the first month, days
to reach peak production, total lactation production, days to the lowest BCS after calving, days to recover
BCS after calving, BCS in the week of first ovulation, weeks to first ovulation, and service period. Duncan’s
test was used to compare the adjusted means of the genetic groups. The variables days to the lowest BCS after calving, days to recover BCS after calving,
weeks to first ovulation, and service period were log
transformed. The variables BCS loss, BCS at calving,
and BCS in the week of first ovulation were analyzed with the Kruskal Wallis test. IGF-1, average monthly
milk production during the second month, peak milk production, and lactation length were analyzed with
the Kruskal Wallis test, followed by Dunn’s test to compare means. Nefa, insulin, GH, and glucose data were assessed using a mixed model methodology specific for repeated measure analysis, and the adjusted means were compared by Tukey’s test. The variables
Nefa and insulin were log transformed.
The statistical analysis was performed by dividing the trial into periods: prepartum, with samples collected
nine, seven, and five days prepartum; first month
postpartum, with samples collected between 3 and 28 days postpartum; and second month postpartum, with samples collected between 28 and 63 days postpartum.
Results and Discussion
The maximum, minimum, and mean values for the THI during the trial were 84, 61, and 70, respectively. The maximum THI recommended for crossbred animals is 79, and ½ Holstein x Zebu (HZ) cows have higher tolerance to exceeding values than ⅞ HZ, whereas ¾ HZ cows present intermediate tolerance
(Azevedo et al., 2005).
All evaluated groups showed initial production with an ascending phase until peak milk production was reached, followed by a descending phase; this
was the case for 75% of the ½ HG cows. This pattern, described in the literature as a typical curve (Glória et al., 2010), is expected for lactation curves of Bos taurus
present study (Table 1). Jacopini et al. (2016), however,
verified peak production between 34 and 45 days for pluriparous cows from different Holstein x Gyr
crosses. It should be noted that, for some time, it was
believed that HZ crossbred animals showed no peak
production, because of their atypical lactation curve; however, according to several authors, this could be due to the lack of records during pre-peak production
(Oliveira et al., 2007; Glória et al., 2010).
The peak milk production of ¾ HG cows was higher than that of ½ HG cows, while ≥⅞ HG cows
were statistically similar to both groups (Table 1).
The fact that ≥⅞ HG animals did not show higher
peak milk production was probably due to their lower
adaptability to thermal stress (Campos G. et al., 2007),
since all groups were subjected to the same overall and nutritional managements.
The time required to reach peak production did not differ between groups, but the average number of days
necessary for the ½ HG and ¾ HG groups to reach the
peak was higher (Table 1) than the 21 days obtained
by Glória et al. (2010) for pluriparous ½ HG cows. In addition, lactation length was longer for the ≥⅞ HG than for the ½ HG group, because animals with a higher
percentage of zebu genes have a shorter lactation length
(Glória et al., 2006). The total lactation production of ¾ HG and ≥⅞ HG cows was greater than that of ½ HG, showing that the higher the Gyr proportion in
the crossing, the greater the chance of reduced milk production, as also reported by McManus et al. (2008).
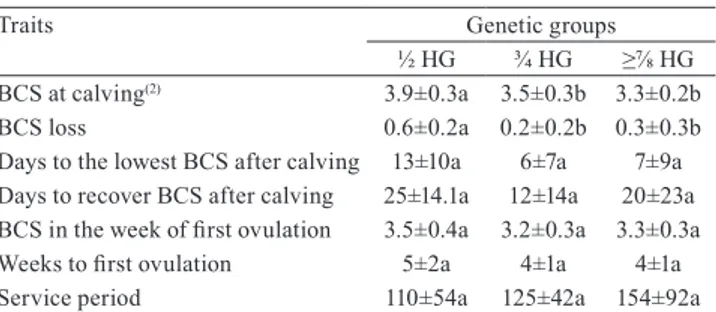
½ HG cows had higher BCS at calving, but greater
BCS loss postpartum (Table 2). These results corroborate those of Akbar et al. (2015), Locher et al. (2015), and Mishra et al. (2016), who found higher mobilization of body reserves in cows with greater body weight at
calving, during early lactation. However, there was no
difference as to the number of days until reaching the lowest BCS after calving, the number of days required to recover BCS after calving (Table 2), and Nefa values during all periods (Table 3). Despite the greater BCS
loss postpartum, the ½ HG group quickly recovered
the BCS. According to Mulligan et al. (2006), in order
to avoid metabolic disorders, the maximum BCS loss
up to two months postpartum should be between 0.5 and 0.75 points. All genetic groups showed a BCS loss
below these values until the first month of lactation,
and no metabolic disorders were recorded.
In the week of first ovulation, there were no differences between the groups for weeks to first
ovulation, service period, and BCS (Table 2). It should be pointed out that negative energy balance (NEB) and metabolic adaptations are the most important factors related to reduced fertility in dairy cows (Alves et al., 2009), and both the duration and severity of NEB are correlated with the return to ovarian activity after calving (Butler et al., 2003). The large mobilization
of body reserves can extend the interval from calving to first estrus and ovulation in high-producing dairy
cows (Roche et al., 2009), which seems to happen in crossbred cows (Borges et al., 2009).
No significant differences were found between
the different groups or weeks evaluated regarding the Nefa values (Table 3), which were lower than 0.123 mmol L-1. Nefa increases during early lactation
when cows do not consume the needed amount of dry matter (DM) to meet the energy demand (Roche et al., 2009) and when the BCS is above 4.0 (Pires et al., 2013). Considering the low Nefa concentration for all
Table 1. Average±standard deviation of peak milk
production (PMP), days to reach peak milk production, lactation length, and total lactation production (TLP) of crossbred Holstein x Gyr (HG) cows(1).
Traits Genetic group
½ HG ¾ HG ≥⅞ HG
PMP (kg per day) 21±9b 31±3a 28±3ab Days to reach PMP 60±25a 45±12a 63±27a Lactation length (days) 231±105a 324±97ab 345±36a TLP (kg per lactation) 3,968±2,795b 7,925±1,955a 6,935±2,039a
(1)Means followed by equal letters do not differ by Dunn’s test, at 5%
probability.
Table 2. Average±standard deviation of body condition
score (BCS) at calving, BCS loss, days to the lowest BCS after calving, days to recover BCS after calving, BCS in the week of first ovulation, weeks to first ovulation, and service period of crossbred Holstein x Gyr (HG) cows(1).
Traits Genetic groups
½ HG ¾ HG ≥⅞ HG
BCS at calving(2) 3.9±0.3a 3.5±0.3b 3.3±0.2b
BCS loss 0.6±0.2a 0.2±0.2b 0.3±0.3b Days to the lowest BCS after calving 13±10a 6±7a 7±9a Days to recover BCS after calving 25±14.1a 12±14a 20±23a
BCS in the week of first ovulation 3.5±0.4a 3.2±0.3a 3.3±0.3a
Weeks to first ovulation 5±2a 4±1a 4±1a
Service period 110±54a 125±42a 154±92a
(1)Means followed by equal letters do not differ by Dunn’s test, at 5%
groups, at all times, it is possible to infer that cows were in an adequate pre- and postpartum nutritional status.
At prepartum, glucose concentration was higher
in the ½ HG genetic group. However, no difference was verified between groups during the first month of lactation. In the second month, ½ HG cows showed higher glucose concentrations than ≥⅞ HG cows
(Table 3). These variations, coupled with total lactation
production data, make it possible to infer that ½ HG
cows do not use as much glucose for milk production as the other groups do.
The insulin concentration for ½ HG was similar to that observed in the ¾ HG and ≥⅞ HG groups, but ¾ HG cows showed higher insulin concentrations than ≥⅞ HG during prepartum (Table 3). In the first month
of lactation, there was no effect of genetic groups on
insulin concentration, but there was a significant one of weeks. Insulin concentration (μU mL-1) in the first month was similar in the first (9.45±5.16) and second (8.01±5.26) weeks postpartum. However, during the
second week postpartum, insulin concentration was lower than in the third (10.34±6.78), fourth (11.81±4.14),
and fifth (11.54±8.65) weeks.
According to Rhoads et al. (2004), the decrease in insulin concentration is connected to a decline in DM intake and to NEB. Moreover, the decoupling
of the somatotropic axis is associated with the decrease in insulin concentration, since the exogenous
administration of insulin results in increased mRNA
of the GH and IGF-1 receptors in the liver, increased IGF-1 concentrations, and decreased GH concentrations in pregnant and lactating Holstein cows. In the
present study, BCS did not decrease and Nefa did not vary immediately at postpartum. Therefore, it can be inferred that cows did not present NEB able to decrease insulin concentrations to the point of decoupling the
somatotropic axis. In the second month postpartum, insulin concentration was higher for the ½ HG genetic group than for ¾ HG and ≥⅞ HG (Table 3), showing that ½ HG cows directed their metabolism earlier towards weight gain, because they are not specifically selected
for milk production, which had already been indicated by their higher glucose concentration in the second
month postpartum compared with ≥⅞ HG animals. The IGF-1 concentration at prepartum was similar between ¾ HG cows and the other groups (Table 3), but the values for ½ HG were greater than those for ≥⅞ HG cows. Cows selected for milk production
Table 3. Average±standard deviation of plasma concentrations of non-esterified fatty acids (NEFA), glucose, insulin,
growth hormone (GH), and insulin-like growth factor 1 (IGF-1) of Holstein x Gyr (HG) crossbred cows at prepartum, in the first month postpartum, and in the second month postpartum(1).
Metabolites and hormones
Genetic group p-value
½ HG ¾ HG ≥⅞ HG Genetic group WtC Genetic group x WtC
Prepartum
Nefa (mmol L-1) 0.11±0.09 0.11±0.08 0.08±0.05 0.69 0.07 0.59
Glucose (mg Dl-1) 59.75±3.70a 56.74±3.20b 55.73±3.07b 0.01 0.48 0.08
Insulin (µU mL-1) 8.69±2.82ab 9.48±2.92a 6.99±2.14b 0.04 0.17 0.81
GH (ng mL-1) 10.12±5.71 9.15±4.10 10.21±5.64 0.83 0.16 0.06
IGF-1 (ng mL-1) 213.86±40.00a 189.34±42.50ab 170.73±31.19b 0.04 0.28 0.74
First month postpartum
Nefa (mmol L-1) 0.12±0.10 0.09±0.06 0.11±0.06 0.69 0.25 0.06
Glucose (mg Dl-1) 60.65±7.48 57.45±5.05 57.17±4.57 0.29 0.26 0.56
Insulin (µU mL-1) 13.51±8.77 9.61±5.04 8.10±3.07 0.12 0.01 0.05
GH (ng mL-1) 10.61±7.24 10.23±4.81 12.03±7.55 0.70 0.003 0.28
IGF-1 (ng mL-1) 180.98±67.62 162.29±37.86 162.81±55.91 0.48 0.001 0.11
Second month postpartum
Nefa (mmol L-1) 0.07±0.05 0.10±0.04 0.10±0.05 0.12 0.96 0.32
Glucose (mg Dl-1) 62.95±6.4ab 57.54±7.72bc 56.55±4.69c 0.04 0.69 0.82
Insulin (µU mL-1) 22.10±18.94a 9.94±4.40b 8.86±3.95b 0.01 0.47 0.80
GH (ng mL-1) 9.68±4.38 9.61±4.25 13.71±13.71 0.19 0.01 0.06
IGF-1 (ng mL-1) 277.57±113.65a 169.44±41.32b 186.71±90.09b 0.01 0.001 0.001
have lower plasma IGF-1 concentration (Lucy et al., 2009; Hammon et al., 2010); however, in the first
month postpartum, no difference was observed in these concentrations between the genetic groups,
whereas, in the second month, ½ HG cows followed
the same pattern found for insulin. Insulin stimulates
the expression of the GH receptor in the liver and, consequently, sensitizes it to secrete IGF-1, which exerts a negative feedback on GH production and
secretion by the pituitary gland (Butler et al., 2003).
This result reinforces the hypothesis that ½ HG animals
directed their metabolism earlier towards weight gain, in comparison with the other genetic groups, since the
negative feedback of IGF-1 limits homeorhesis actions of the GH for milk production and insulin stimulates
glucose use by the peripheral tissues. As a result, it directs the metabolism to the anabolic phase, reducing glucose availability for lactose production in the mammary gland.
Plasma concentrations of the GH were similar
between genetic groups in the three studied periods (Table 3). According to Rhoads et al. (2004) and Lucy
et al. (2009), the selection of Holstein cows aiming to
increase milk production results in a greater secretion
of the GH; however, this was not observed for the
crossbred animals evaluated.
The results obtained for the GH and IGF-1 are in
alignment with the idea that crossbred cows presented
no decoupling of the somatotropic axis, because they did not show low concentrations of IGF-1 in the
immediate postpartum period and did not present a
considerable variation in GH plasma concentration
between pre- and postpartum. The high concentration of circulating insulin since prepartum may have
stimulated the liver to express mRNA for the GH
receptor and, consequently, to produce and secrete
IGF-1. According to Butler et al. (2003), the expression of GH receptors in the liver is rapidly influenced by the nutritional status of the animal, which again justifies
the results found, considering none of the genetic groups had a NEB.
Conclusions
1. ½ Holstein x Gyr (HG) cows have greater ability
to increase body condition score postpartum, when compared with the other genetic groups evaluated, mainly due to their plasma insulin pattern.
2. Total lactation production and plasma insulin
levels of ¾ HG cows at postpartum are similar to those of cows specifically selected for milk production.
3. Using Holstein parameters to determine
management conditions in farms with crossbred cows can have unwanted consequences, since these animals
have different metabolic and hormone profiles.
Acknowledgments
To Fazenda Queima Ferro, for allowing the use of animals and facilities; to Fundação de Amparo à Pesquisa do Estado de Minas Gerais (Fapemig, project number APQ-01884-12), for funding the research; and to professor Guilherme de Paula Nogueira and the team
from the endocrinology laboratory of Universidade
Estadual Paulista Júlio de Mesquita Filho (Unesp), for
promptly performing laboratory analyzes.
References
AKBAR, H.; GRALA, T.M.; VAILATI RIBONI, M.; CARDOSO, F.C.; VERKERK, G.; MCGOWAN, J.; MACDONALD, K.; WEBSTER, J.; SCHUTZ, K.; MEIER, S.; MATTHEWS, L.; ROCHE, J.R.; LOOR, J.J. Body condition score at calving affects systemic and hepatic transcriptome indicators of inflammation
and nutrient metabolism in grazing dairy cows. Journal of Dairy
Science, v.98, p.1019-1032, 2015. DOI: 10.3168/jds.2014-8584.
ALVES, N.G.; PEREIRA, M.N.; COELHO, R.M. Nutrição e
reprodução em vacas leiteiras. Revista Brasileira de Reprodução
Animal, n.6, p.118-124, 2009. Suplemento.
ARMSTRONG, D.V. Heat stress interaction with shade and
cooling. Journal of Dairy Science, v.77, p.2044-2050, 1994. DOI: 10.3168/jds.S0022-0302(94)77149-6.
AZEVEDO, M. de; PIRES, M. de F.Á.; SATURNINO, H.M.; LANA, Â.M.Q.; SAMPAIO, I.B.M.; MONTEIRO, J.B.N.;
MORATO, L.E. Estimativas de níveis críticos para vacas leiteiras
1/2, 3/4 e 7/8 Holandês-Zebu em lactação. Revista Brasileira
de Zootecnia, v.34, p.2000-2008, 2005. DOI:
10.1590/S1516-35982005000600025.
BISINOTTO, R.S.; LEAN, I.J.; THATCHER, W.W.; SANTOS,
J.E.P. Meta-analysis of progesterone supplementation during
timed artificial insemination programs in dairy cows. Journal of
Dairy Science, v.98, p.2472-2487, 2015. DOI:
10.3168/jds.2014-8954.
BORGES, Á.M.; CARVALHO, B.C. de; RUAS, J.R.M. Manejo
reprodutivo da vaca mestiça: estado da arte. Revista Brasileira
de Reprodução Animal, n.6, p.157-162, 2009. Suplemento.
BUTLER, S.T.; MARR, A.L.; PELTON, S.H.; RADCLIFF, R.P.; LUCY, M.C.; BUTLER, W.R. Insulin restores GH responsiveness
effects on expression of IGF-I and GH receptor 1A. Journal of
Endodontics, v.176, p.205-217, 2003. DOI: 10.1677/joe.0.1760205.
CAMPOS G., R.; CUBILLOS, C.; RODAS, Á.G. Indicadores metabólicos en razas lecheras especializadas en condiciones
tropicales en Colombia. Acta Agronômica, v.56, p.85-92, 2007.
COBUCI, J.A.; EUCLYDES, R.F.; COSTA, C.N.; LOPES, P.S.; TORRES, R. de A.; PEREIRA, C.S. Análises de persistência na lactação de vacas da raça Holandesa, usando produção no dia do controle e modelo de regressão aleatória. Revista Brasileira
de Zootecnia, v.33, p.546-554, 2004. DOI:
10.1590/S1516-35982004000300004.
GLÓRIA, J.R. da; BERGMANN, J.A.G.; QUIRINO, C.R.; RUAS,
J.R.M.; MATOS, C.R.A.; PEREIRA, J.C.C. Curvas de lactação
de quatro grupos genéticos de mestiças Holandês-Zebu. Revista
Brasileira de Zootecnia, v.39, p.2160-2165, 2010. DOI: 10.1590/
S1516-35982010001000009.
GLÓRIA, J.R.; BERGMANN, J.A.G.; REIS, R.B.; COELHO,
M.S.; SILVA, M.A. Efeito da composição genética e de fatores de meio sobre a produção de leite, a duração da lactação e a produção de leite por dia de intervalo de partos de vacas mestiças
Holandês-Gir. Arquivo Brasileiro de Medicina Veterinária
e Zootecnia, v.58, p.1139-1148, 2006. DOI:
10.1590/S0102-09352006000600024.
GOTTSCHALL, C.S.; ALMEIDA, M.R.; TOLOTTI, F.; MAGERO, J.; BITTENCOURT, H.R.; MATTOS, R.C.; GREGORY, R.M. Avaliação do desempenho reprodutivo de vacas de corte lactantes submetidas à IATF a partir da aplicação do GnRH, da manifestação estral, da reutilização de
dispositivos intravaginais e da condição corporal. Acta Scientiae
Veterinariae, v.40, p.1012-1021, 2012.
HAMMON, H.M.; METGES, C.C.; SCHULZ, A.; JUNGHANS, P.; STEINHOFF, J.; SCHNEIDER, F.; PFUHL, R.; BRUCKMAIER, R.M.; WEIKARD, R.; KÜHN, C. Differences in milk production,
glucose metabolism, and carcass composition of 2 Charolais ×
Holstein F2 families derived from reciprocal paternal and maternal
grandsire crosses. Journal of Dairy Science, v.93, p.3007-3018, 2010. DOI: 10.3168/jds.2009-2931.
JACOPINI, L.A.; BARBOSA, S.B.P.; LOURENÇO, D.A.L.;
SILVA, M.V.G.B. da. Desempenho produtivo de vacas Girolando
estimado pelo modelo de Wood ajustado por metodologia bayesiana. Archives of Veterinary Science, v.21, p.43-54, 2016.
LOCHER, L.; HÄUSSLER, S.; LAUBENTHAL, L.; SINGH, S.P.; WINKLER, J.; KINOSHITA, A.; KENÉZ, A.; REHAGE, J.; HUBER, K.; SAUERWEIN, H.; DÄNICKE, S. Effect of
increasing body condition on key regulators of fat metabolism in subcutaneous adipose tissue depot and circulation of nonlactating dairy cows. Journal of Dairy Science, v.98, p.1057-1068, 2015. DOI: 10.3168/jds.2014-8710.
LUCY, M.C.; VERKERK, G.A.; WHYTE, B.E.; MACDONALD, K.A.; BURTON, L.; CURSONS, R.T.; ROCHE, J.R.; HOLMES, C.W. Somatotropic axis components and nutrient partitioning
in genetically diverse dairy cows managed under different feed allowances in a pasture system. Journal of Dairy Science, v.92, p.526-539, 2009. DOI: 10.3168/jds.2008-1421.
MCMANUS, C.; TEIXEIRA, R. de A.; DIAS, L.T.; LOUVANDINI,
H.; OLIVEIRA, E.M.B. Características produtivas e reprodutivas de vacas Holandesas e mestiças Holandês × Gir no Planalto
Central. Revista Brasileira de Zootecnia, v.37, p.819-823, 2008. DOI: 10.1590/S1516-35982008000500006.
MISHRA, S.; KUMARI, K.; DUBEY, A. Body condition scoring
of dairy cattle: a review. Research & Reviews: Journal of
Veterinary Sciences, v.2, p.58-65, 2016.
MULLIGAN, F.J.; O’GRADY, L.; RICE, D.A.; DOHERTY, M.L.
A herd health approach to dairy cow nutrition and production diseases of the transition cow. Animal Reproduction Science, v.96, p.331-353, 2006. DOI: 10.1016/j.anireprosci.2006.08.011.
OLIVEIRA, H.T.V.; REIS, R.B.; GLÓRIA, J.R.; QUIRINO, C.R.; PEREIRA, J.C. Curvas de lactação de vacas F1 Holandês-Gir
ajustadas pela função gama incompleta. Arquivo Brasileiro de
Medicina Veterinária e Zootecnia, v.59, p.233-238, 2007. DOI:
10.1590/S0102-09352007000100037.
PEREIRA, R.J.; VERNEQUE, R.S.; LOPES, P.S.; SANTANA JR., M.L.; LAGROTTA, M.R.; TORRES, R.A.; VERCESI FILHO, A.E.; MACHADO, M.A. Milk yield persistency in Brazilian Gyr cattle based on a random regression model.Genetics and
Molecular Research, v.1, p.1599-1609, 2012. DOI: 10.4238/2012.
June.15.9.
PIRES, J.A.A.; DELAVAUD, C.; FAULCONNIER, Y.; POMIÈS, D.; CHILLIARD, Y. Effects of body condition score at calving
on indicators of fat and protein mobilization of periparturient
Holstein-Friesian cows. Journal of Dairy Science, v.96, p.6423-6439, 2013. DOI: 10.3168/jds.2013-6801.
RHOADS, R.P.; KIM, J.W.; LEURY, B.J.; BAUMGARD, L.H.; SEGOALE, N.; FRANK, S.J.; BAUMAN, D.E.; BOISCLAIR,
Y.R. Insulin increases the abundance of the growth hormone receptor in liver and adipose tissue of periparturient dairy cows.
Journal of Nutrition, v.134, p.1020-1027, 2004.
ROCHE, J.R.; FRIGGENS, N.C.; KAY, J.K.; FISHER, M.W.; STAFFORD, K.J.; BERRY, D.P. Invited review: body condition
score and its association with dairy cow productivity, health, and welfare. Journal of Dairy Science, v.92, p.5769-5801, 2009. DOI: 10.3168/jds.2009-2431.
SANTANA JR., M.L.; PEREIRA, R.J.; BIGNARDI, A.B.; VERCESI FILHO, A.E.; MENÉNDEZ-BUXADERA, A.; EL FARO, L. Detrimental effect of selection for milk yield on genetic tolerance to heat stress in purebred Zebu cattle: genetic
parameters and trends.Journal of Dairy Science, v.98, p.9035-9043, 2015. DOI: 10.3168/jds.2015-9817.
WELLER, M.M.D.C.A.; ALBINO, R.L.; MARCONDES, M.I.; SILVA, W.; DANIELS, K.M.; CAMPOS, M.M.; DUARTE,
M.S.; MESCOUTO, M.L., SILVA, F.F.; GUIMARÃES, S.E.F.
Effects of nutrient intake level on mammary parenchyma growth
and gene expression in crossbred (Holstein× Gyr) prepubertal
heifers. Journal of Dairy Science, v.99, p.9962-9973, 2016. DOI: 10.3168/jds.2016-11532.
WOOD, P.D.P. Algebraic model of the lactation curve in cattle.
Nature, v.216, p.164-165, 1967. DOI: 10.1038/216164a0.