PREDICTING THE POPULARITY OF ONLINE
UNDERSTANDING, MODELING AND
PREDICTING THE POPULARITY OF ONLINE
CONTENT ON SOCIAL MEDIA APPLICATIONS
Tese apresentada ao Programa de Pós--Graduação em Computer Science do In-stituto de Ciências Exatas da Universidade Federal de Minas Gerais como requisito par-cial para a obtenção do grau de Doutor em Computer Science.
Orientadora: Jussara Marques Almeida
Belo Horizonte
UNDERSTANDING, MODELING AND
PREDICTING THE POPULARITY OF ONLINE
CONTENT ON SOCIAL MEDIA APPLICATIONS
Thesis presented to the Graduate Program in Computer Science of the Universidade Federal de Minas Gerais in partial fulfill-ment of the requirefulfill-ments for the degree of Doctor in Computer Science.
Advisor: Jussara Marques Almeida
Belo Horizonte
Diniz de Figueiredo, Flavio Vinicius
F475u Understanding, Modeling and Predicting the Popularity of Online Content on Social Media
Applications / Flavio Vinicius Diniz de Figueiredo. — Belo Horizonte, 2015
xxiv, 178 f. : il. ; 29cm
Tese (doutorado) — Universidade Federal de Minas Gerais
Orientador: Jussara Marques Almeida
1. popularity. 2. trends. 3. time series. 4. user generated content. 5. ugc. 6. youtube. 7. lastfm. 8. twitter. 9. facebook. 10. social media. I. Título.
Antes de tudo, agradeço a minha família: Mother, Father, Fabricio, Vinicius (o mais novo membro), Dudu e Aline, por todo o apoio ao longo dos anos. Sou grato também por ter tido Vanessa como companheira durante todo este tempo.
Agradeço aos amigos/amigas por todos os momentos de: felicidade, bebidas, bares, festivais, shows, caronas, viagens e conversas (aleatórias ou filosóficas). Tais experiências me guiaram para eu ser a pessoa que sou hoje. Para evitar esquecer de alguém, prefiro mencionar que sou grato os membros dos grupos: Sem Sintomas, LSD, NetsysLab-UBC, Lê Cabral, VoD e Vodinho. Como também a segunda família da casa do Seu João, por facilitar minha vinda até BH. Além disso, agradeço aquelas pessoas que me abrigaram quando estava fora do país, tomando um papel mais amplo do que apenas “room mates” e sim de amizade.
Por fim, agradeço também a Jussara Almeida, pela orientação nos últimos 7 anos, como também os vários outros orientadores que me ajudaram durante o doutorado: Fabrício Benevenuto, Christos Faloutsos, Marcos Gonçalves, Krishna Gummadi e Bruno Ribeiro. Como não pode faltar, agradeço também ao Cnpq, Capes, Google Brasil e IBM Research pelo financiamento durante os últimos 5 anos.
Hoje em dia, o fenômeno denominado de mídia social emergiu como a forma predo-minante de publicação de conteúdo na Internet. Devido a esse grande sucesso, um entendimento de como os usuários criam, compartilham e disseminam conteúdo online pode trazer informações cruciais para criadores de conteúdo, provedores de Internet, marqueteiros online, dentre outros. Neste contexto, essa tese discute três principais objetivos sobre como a popularidade de mídia social evolui online. Inicialmente, ap-resentamos um estudo sobre como diferentes atributos textuais, sociais e do próprio conteúdo se relacionam com a popularidade do conteúdo de mídia social. Este estudo é feito com base em uma caracterização em larga escala do YouTube, a principal apli-cação de compartilhamento de vídeos hoje em dia, como também com base em um estudo com usuários usando a ferramenta de crowdsourcing Amazon Mechanical Turk. No nosso segundo objetivo, propomos diferentes métodos de previsão de popularidade com objetivos de prever tanto a evolução de popularidade (ou tendências), como tam-bém valores futuros de popularidade do conteúdo de mídia social. Diferentemente de outros trabalhos, levamos em conta o equilíbrio entre o interesse restante no conteúdo após a predição e corretude das previsões, um fator negligenciado por abordagens an-teriores de previsão. Por fim, apresentamos um estudo de como atividades dos usuários (e.g., assistir, compartilhar, curtir etc.) se relacionam com a popularidade do conteúdo de mídia social. Este terceiro trabalho é feito com bases de dados do YouTube, Twitter e do Last.FM. Na nossa análise, focamos em duas características complementares do comportamento de usuários: a revisita ao um mesmo conteúdo ao longo do tempo, como também as mudanças de interesse em conteúdos distintos ao longo do tempo. Os resultados dessa tese são discutidos com uma enfâse de aplicações como marketing online, provisionamento de conteúdo e plataformas de dados analíticos.
Social media has emerged as the de-facto form of publishing on the Internet nowa-days. Given the success of social media applications, understanding how users create, share and disseminate social media content online can provide valuable insights for content generators, online advertisers and Internet service providers (ISPs), among others. Motivated by this great success of social media applications, the objectives of this dissertation are threefold. Firstly, we aim at understanding how different textual, content and social features relate to the evolution of popularity of social media content. We achieve this based on a large scale characterization of the YouTube application, currently the largest video sharing platform, as well as a small scale crowdsourced user study. Secondly, we propose novel popularity prediction methods to predict not only future popularity values, but also the popularity evolution trends that social media content will achieve at future dates. Our proposed methods differ from previous work in two key aspects: (1) popularity trends are exploited to build specialized models of popularity values, and (2) our methods take into account not only the prediction accu-racy, but also the remaining interest in the content after prediction, aiming at finding a good tradeoffbetween both. Lastly, we present two novel data mining techniques to un-derstand how user activities (e.g., viewing, liking, sharing etc.) relate to the evolution of popularity of social media content. In this last step, we tackle two complementary effects of user activities: the revisit behavior of users to the same content, as well as the attention flows of users between different pieces of content. Our case studies on this last step are three different social media applications: YouTube, Twitter and LastFM. The three complementary studies presented in this dissertation are discussed in light of real world applications (e.g., advertising, provisioning and analytics platforms) that may benefit from our results.
1.1 Example of a Video’s Page on YouTube. . . 3
1.2 Example of Popularity Time Series for YouTube (top row) and Twitter (bottom). . . 4
1.3 Pictorial Representation of our Research Goals . . . 8
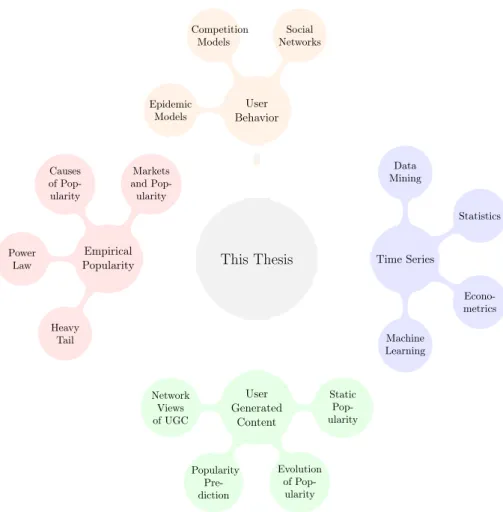
2.1 Mind Map of the Themes Related to this Dissertation . . . 11
2.2 Synthetic Power-law Datasets. . . 13
2.3 Example of Connections in a Social Media Application . . . 16
2.4 Examples of Popularity Evolution Trends on Twitter [146] . . . 19
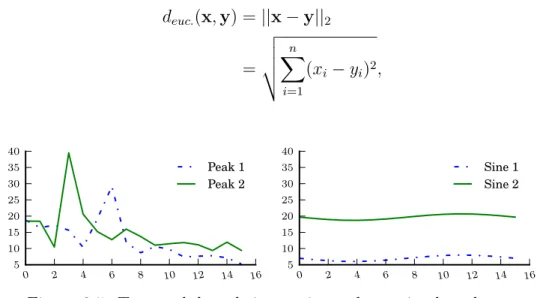
2.5 Two peak based time series and two sine based ones . . . 30
2.6 Thesis Roadmap (Related Work) . . . 33
3.1 YouTube’s Insight Data Example (Some Referrers Were Trimmed) . . . 39
3.2 Cumulative Distributions of Time Until Video Achieves at Least 10%, 50% and 90% of its Total Observed Popularity (time normalized by video’s lifes-pan). . . 43
3.3 Cumulative Distributions of the Fraction of Total Views on the First, Second and Third Peak Days/Weeks. . . 44
3.4 Popularity Trends (Cluster Centroids) in Both Random and Top Datasets. 47 3.5 Fraction of Views From Each Referrer Category. . . 52
3.6 Time Until the First Referrer Access (normalized by video’s lifespan). . . . 53
3.7 Fractions of Videos Per Category (a,b) and Fraction of Views Per Referrer (c,d) For Each Cluster. . . 55
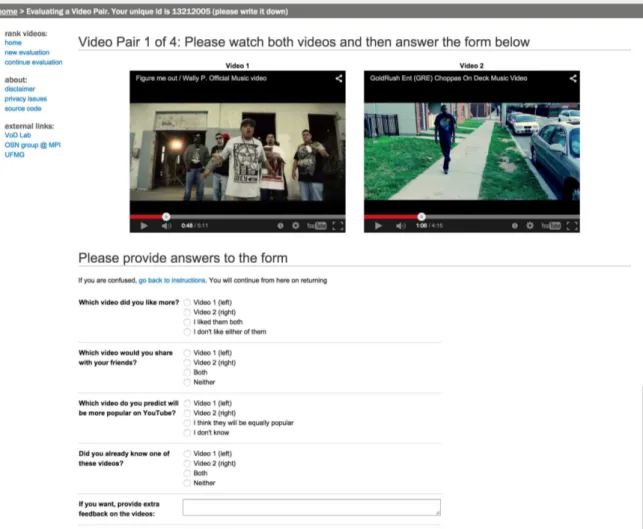
4.1 Example of a Video Pair Evaluation on YouRank . . . 67
4.2 YouRank Forms - Demographic Survey (top); Video Evaluation Form (bot-tom) . . . 68
4.3 Level of Agreement vs Popularity Gap in Pairs of Videos . . . 72
values after 48 hours. Each variable has been incremented by one due to
log transformed x and y axes. . . 81
5.2 Correlations Between the Predictors Number of Visitsvp,tr, Facebook Likes fp,tr and Twitter Mentions (Tweets) mp,tr in 5 minutes and their respective values after 48h. Each variable has been incremented by one due to log transformed x and y axis. . . 81
5.3 Correlations Between the Predictors Number of Visitsvp,tr, Facebook Likes fp,tr and Twitter Mentions (Tweets) mp,tr. Each variable has been incre-mented by one due to log transformed x and y axis. . . 82
5.4 Correlation Between vp,tr and vp,tt for Selected Hosts. . . 83
5.5 Popularity Evolution of Two Selected Pages. . . 83
6.1 Popularity Evolution of Two YouTube Videos. . . 95
6.2 Example of Alignment of Time Series (dashed lines) for Probability Com-putation. . . 100
6.3 Pictorial Representation of Our Solution . . . 105
6.4 Remaining Interest (RI) and Correlations Between Popularity and RI for Correctly Classified Videos. . . 111
7.1 Different YouTube Videos as Captured by the Phoenix-R Model. . . 117
7.2 Distributions (CCDF) of #AudienceRevisits. . . 121
7.3 Individual Shocks that Account for the Phoenix-RModel. . . 124
7.4 Scalability of Phoenix-R . . . 131
8.1 The A-FLUX Model: Data Representation by Tensor X (left), the Re-peated Consumption Modulated Markov Model (center) and the Inter-artist Model (right). . . 140
8.2 The Inter-Artist Attention Flow Model. . . 143
8.3 Infinite Markov modulated Attention Model Showing the Transitions Be-tween the First Three States. . . 146
8.4 Time Series of Monthly Plays of a User Broken Down by Attention Genes. User attention is too complex for user-artist latent factor analysis. . . 150
8.5 Evolution of Gene Activity Showing Attention Elasticity and Artist Com-petition. . . 153
8.6 Evidence of competition and cooperation between attention genes. . . 155 8.7 Comparison With Temporal Tensors (Truth,A-FLUX, Time Decomposition).157
1.1 Definitions of Social Media, User Generated Content, Online Information
and User Activities . . . 6
3.1 Crawled Datasets (after cleanup) . . . 40
3.2 Distribution of Video Age . . . 40
3.3 Summary of Features . . . 41
3.4 Normalized Time Until at Least 90% of Total Views, Grouped by Video Age (mean µ, and standard deviation ). . . 45
3.5 Fraction of Views on Peak Day Grouped by Video Age (meanµ, and stan-dard deviation ). . . 45
3.6 Summary of Popularity Trends . . . 48
3.7 Referrer Categories and Statistics (tview: number of views (x109);fview: the fraction of views;ftime: fraction of times a referrer from the given category was the first referrer of a video). . . 50
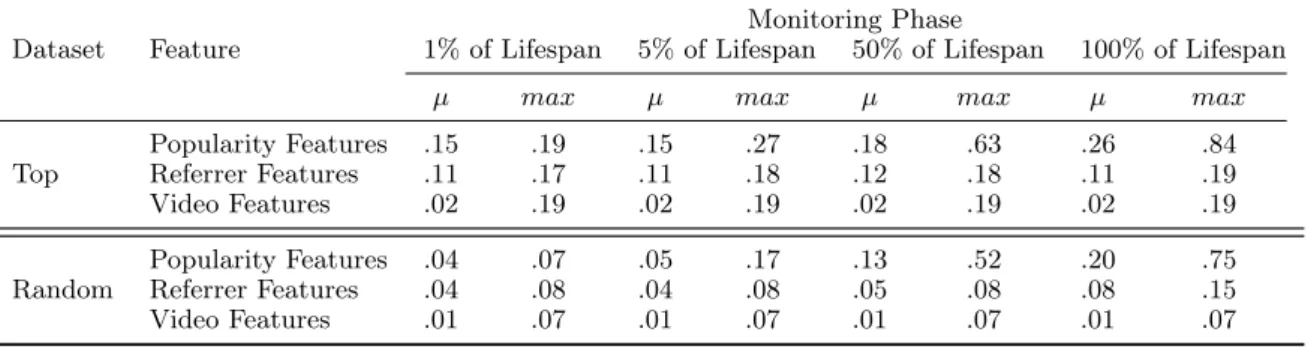
3.8 Average (µ) and Maximum (max) Maximal Information Coefficient (MIC) Values per Feature Type for Popularity Trend. . . 57
3.9 Average (µ) and Maximum (max) Maximal Information Coefficient (MIC) Values per Feature Type for Total (Observed) Popularity Value. . . 57
4.1 Answers to S3, S4 and S5 in the Demographic Survey (Fig. 4.2). . . 70
4.2 Fraction of Video Pairs that Rejected the Fleiss’ Kappa Null Hypothesis of 0. The columns correspond to the questions in Figure4.2. . . 71
4.3 Average Values of for Pairs that Rejected the Null Hypothesis of 0. The columns correspond to the questions in Figure 4.2. . . 71
4.4 Fractions of Cases of Consensus that Match YouTube’s Popularity. Values with * (**) are above random chance with p-value = 0.05 (0.01) . . . 73
6.1 Notation. Vectors (x) and matrices (X), in bold, are differentiated by lower and upper cases. Streams (ˆx) are differentiated by the hat accent (ˆ). Sets (D) are shown in fancy letters and variables (d) are shown in regular lower
case letters, respectively. . . 98
6.2 Classification Using Centroids Only vs. Using All Class Members: Averages and 95% Confidence Intervals. . . 108
6.3 Best Values for Vector Parameters and ✓ (Averages and 95% Confidence Intervals) for the Top Dataset . . . 109
6.4 Best Values for Vector Parameters and ✓ (Averages and 95% Confidence Intervals) for the Random Dataset . . . 109
6.5 Comparison of Trend Prediction Methods (Averages and 95% Confidence Intervals) for the Top Dataset . . . 110
6.6 Comparison of Trend Prediction Methods (averages and 95% confidence intervals) for the Random Dataset . . . 111
6.7 Mean Relative Squared Error Various Prediction Models and Lags (aver-ages and 95% confidence intervals) . . . 113
7.1 Comparison of Phoenix-RWith Other Approaches . . . 119
7.2 Datasets of User Activities Mined With Phoenix-R . . . 120
7.3 Relationships between Revisits, Audience and Popularity. . . 122
7.4 Quartiles of the Ratio #AudienceRevisits for Various Time Windows w. . . 122
7.5 Comparison of Phoenix-Rwith TemporalDynamics [112] and SpikeM [91]: Average RMSE values (with 95% confidence intervals in parentheses). Sta-tistically significant (p-value of 0.01) results (including ties) are shown in bold. . . 131
7.6 Comparing Phoenix-R with TemporalDynamics [112] for Prediction. The values on the table are RMSE. Statistically significant results are in bold . 133 8.1 Summary of our Last.FM datasets . . . 139
8.2 Genes Extracted From the Last.FM-Groups Dataset. Top source and des-tination artists, and demographics of top-50 users. Sources, desdes-tinations, and users are sorted by probabilitiesp(s|z),p(d|z), p(u|z). BR = Brazil, US = USA, NL = Netherlands, DE = Germany, PL = Poland, FI = Finland. Age statistics: 1st,2nd and 3rd quartiles, minimum and maximum values. . 148
Agradecimentos ix
Resumo xi
Abstract xiii
List of Figures xv
List of Tables xix
1 Introduction 1
1.1 Motivation . . . 2
1.2 Problem Statement . . . 5
1.3 Research Goals . . . 7
1.4 Contributions and Outline of this Dissertation . . . 8
2 Background and Related Work 11 2.1 Empirical Studies on Popularity . . . 12
2.1.1 Probability Distributions of Popularity . . . 12
2.1.2 The Effects of Markets on Popularity . . . 14
2.2 Popularity of Social Media Objects . . . 15
2.2.1 Static Views of Popularity of Social Media Objects . . . 16
2.2.2 Popularity Evolution Over Time on Social Media Applications . 18 2.2.3 Prediction of Popularity of Social Media Objects . . . 20
2.3 Popularity Through the Lens of User Activities . . . 22
2.4 Time Series Statistics and Data Mining . . . 24
2.4.1 Time Series Representation . . . 25
2.4.2 Linear Regression Models . . . 27
3 On the Dynamics of Social Media Popularity 35
3.1 Introduction . . . 35 3.2 Datasets . . . 38 3.3 Understanding Video Popularity Growth . . . 42 3.3.1 How Early do Videos Reach Most of their Observed Views (Q1)? 42 3.3.2 Is Popularity Concentrated in Bursts (Q2)? . . . 44 3.3.3 Discussion . . . 45 3.4 Popularity Temporal Dynamics (Q3) . . . 46 3.5 Referrer Analysis (Q4) . . . 50 3.5.1 Which Referrers are More Important for Video Popularity (Q4a)? 50 3.5.2 How Early do Referrers Appear (Q4b)? . . . 51 3.5.3 Discussion . . . 53 3.6 Associations Between Various Features and Popularity (Q5) . . . 54
3.6.1 What Kinds of Content and Referrers are Responsible for Each Popularity Trend? (Q5a) . . . 54 3.6.2 What are the Correlations Between Features and Popularity
Trends and Values? (Q5b) . . . 56 3.6.3 Discussion . . . 58 3.7 Summary . . . 59
4 Users Perception of Content and Popularity 63
4.1 Introduction . . . 63 4.2 Methodology . . . 65 4.2.1 Datasets . . . 65 4.2.2 Human Intelligence Tasks . . . 66 4.2.3 Evaluation Metrics . . . 68 4.2.4 Representativeness and Reproducibility . . . 69 4.3 Results . . . 69 4.3.1 Demographic Survey . . . 70 4.3.2 Can Users Reach Consensus? . . . 71 4.3.3 When There Is Consensus, Does It Match the Relative Popularity
of Videos on YouTube? . . . 73 4.4 Summary . . . 74 5 News Content Popularity Prediction Using Time Series Trends 77
5.3 Datasets . . . 80 5.4 Baseline Methods and Our Approach . . . 84 5.4.1 Baseline Methods . . . 84 5.4.2 Our Approach . . . 86 5.4.3 Evaluation Methodology . . . 88 5.5 Results . . . 89 5.6 Summary . . . 91 6 Early Prediction of Popularity Trends of User Generated Content 93
6.1 Introduction . . . 94 6.2 Problem Statement . . . 97 6.3 Our Approach . . . 98 6.3.1 Trend Extraction . . . 98 6.3.2 Trend Prediction . . . 99 6.3.3 Putting It All Together . . . 104 6.4 Evaluation Methodology . . . 105 6.5 Experimental Results . . . 106 6.5.1 Are shapelets better than a reference dataset? . . . 107 6.5.2 TrendLearner Results . . . 108 6.5.3 Applicability to Regression Models . . . 112 6.6 Summary . . . 114
7 Revisit Behavior in Social Media 115
7.1 Introduction . . . 115 7.2 Definitions and Background . . . 117 7.2.1 Definitions . . . 118 7.2.2 Existing Models of Object Popularity Dynamics . . . 118 7.3 Content Revisit Behavior in Social Media . . . 120 7.3.1 Datasets . . . 120 7.3.2 Main findings . . . 120 7.4 The Phoenix-R Model . . . 123 7.4.1 Deriving the Model . . . 123 7.4.2 Fitting the Model . . . 127 7.5 Experiments . . . 129 7.5.1 Is Phoenix-R Better than Alternatives? . . . 130
8 Mining User Attention Flows 135
8.1 Introduction . . . 136 8.2 OMSS Datasets . . . 138 8.3 The A-FLUX Model . . . 140 8.3.1 Data Representation and Notation . . . 141 8.3.2 Inter-Artist Attention Flow Model . . . 142 8.3.3 Fixation Model . . . 145 8.4 Results . . . 146 8.4.1 Applying
A-FLUX
to the Datasets . . . 147 8.4.2 User Attention Evolution and Gene Persistence . . . 149 8.4.3 Attention Elasticity and Competition . . . 150 8.5 Model Validation . . . 156 8.5.1 Inter-Artist Attention Flow Model . . . 156 8.5.2 Fixation Model . . . 158 8.6 Summary . . . 1609 Conclusions and Future Research Directions 161
9.1 Research Goal 1 - Understanding Feature Importance to Popularity Evo-lution in Social Media Objects . . . 161 9.2 Research Goal 2 - Predicting Object Popularity . . . 163 9.3 Research Goal 3 - Mining User Activities . . . 163 9.4 Future Research Direction . . . 164 9.5 List of Publications . . . 165
Bibliography 167
Introduction
As we (humans) shift our content consumption and production practices to an online space (the Internet) [83,105,108], massive amounts of data on human behavior and cultural production is now readily available to aid researchers in understanding our information consumption habits. For example, social media and user generated con-tent (UGC)1, that is, media content which can (at least in theory) be created and/or curated by any user, is one of the driving forces of today’s Internet. In other words, social media has become the de-facto form of publishing on some of the most popular Internet applications [31]. Focusing on video content, websites such as YouTube2 re-ceive over 1 billion unique users and attracts over 1 million different advertisers each month [151]. Even niche applications, such as Vimeo3, whose target producers are independent filmmakers, manage to attract over 70 million unique users monthly [134]. Changing our perspective to other kinds of media, Flickr4, a popular photo sharing application, announced in 2011 that over 6 billion photos were available in the appli-cation [48].
Focusing on how users consume online content nowadays, popular news websites rely not only on traditional advertising and subscriptions to drive traffic. There is also a heavy use of social media and viral marketing [18] campaigns that lead users to this professional content online. That is, user traffic, even to professional content nowadays is currently highly dependent on how information is propagated through users on social media applications as well on online and offline social networks. Another interesting
1
We consider social media as a more general concept than UGC. It encompasses the technology that allows users to create, share, discuss, and curate online information. User generated content (UGC) the actual media content (e.g., videos) created by users and published/propagated through social media tools (see Table 1.1).
2
http://youtube.com
3
http://vimeo.com
4
http://flickr.com
example is online music streaming services (OMSS) such as Spotify5 and Last.FM6, whose revenues depends on the online consumption habits of users, or simply, online user activities. Such websites usually rely on social networking and group geared features to attract and maintain their target audiences.
Given the success of some of the aforementioned applications – as well as the current large volume of online user activities in creating, curating, and consuming dif-ferent types of content on a daily basis – understanding how users find such content and how content popularity evolves over time provides valuable insights for content generators, online advertisers and Internet service providers (ISPs), amongst others. For instance, from a system perspective, understanding these properties may drive the design of better analytic tools, a major market segment nowadays [83]. Online advertisers may also benefit from this information to better place contextual adver-tisements, while ISPs could exploit it to develop more cost-effective content delivery platforms and caching systems. From a social perspective, understanding the proper-ties of content popularity could be used to better comprehend the human dynamics of consumption processes [34]. Also, content producers could benefit from insights on how user collaboration and collaborative social activities on Web 2.0 applications may impact content popularity, providing information on aspects related to their own fame on Internet applications.
The motivating theme of this dissertation is on understanding and modeling the popularity of online content on social media applications (e.g., UGC, as well as news websites or mainstream songs from musical artists), while at the same time providing valuable information to real world applications.
1.1
Motivation
In Figure1.1 we show an example of a YouTube video, as well as the different features – such as the textual title and content’s number of likes – as well as different user actions (e.g., web links through which users perform some action such as sharing the video) that surrounds the video. We define the content provided by the social media application, a YouTube video in this case, as a social media object. There exists a wide range of means to access an object such as the one shown in Figure1.1. For example, search engines typically index such objects taking into account the different features available in the object (mostly the textual features [12]). Also, social sharing options provide users with means to propagate objects to their online friends or followers (e.g.,
5
http://spotify.com
6
Figure 1.1: Example of a Video’s Page on YouTube.
online social network (OSN) sharing or e-mail sharing). 7. Moreover, different websites such as blogs or news websites can also embed online objects on their pages8. Finally, internal browsing inside the application will also direct users to different content (as shown in the related videos links in the figure).
The aforementioned means of accessing objects will reflect on the different tem-poral patterns of evolution of popularity that social media content typically exhibit. Figures 1.2(a-c) shows some example time series of the daily popularity (number of hits/views) received by different YouTube videos. Also, Figures (d-f) shows some ex-amples of popularity of Twitter hashtags. From the figures we can see different patterns of temporal evolution of popularity of objects. Take for instance, Figure 1.2(a). This example shows a YouTube music video that appears to have reached a steady state in the number of daily visits after an initial burst in growth (from zero to roughly 10,000 views daily). In contrast, Figure 1.2(b) shows a video that undergoes a popularity evolution consistent with a viral growth like pattern (exponential growth before the peak and exponential decay after). The last video example, Figure 1.2(c), appears to be composed of various viral patterns that relate to different real world events or incoming sources/links (referrers). In this specific case, the video is a song about New
7
Offline sharing is also possible, but very difficult to account for.
8
0 200 400 600 800 1000120014001600 100 101 102 103 104 105 N u m b er of V is it s
(a) Steady State
Flashdance
0 100 200 300 400 500 600
Days after upload
105 106 107 108
(b) Viral Cascade
Gangnam Stye
0 200 400 600 80010001200140016001800 100
101 102 103 104
(c) Multi Cascade
New York I Love You
0 20 40 60 80 100 120 140 101 102 103 N u m b er of T w eet s (d) Period Haiti
0 20 40 60 80 100 120 140 Days after upload
101
102
103 (e) Two Peaks (possible cascades)
IranElection
0 20 40 60 80 100 120 140 100
101
102
103
104 (f) Single Cascade
googlewave
Figure 1.2: Example of Popularity Time Series for YouTube (top row) and Twitter (bottom).
York city. Looking into the different peaks in popularity, or spikes, they occur close to dates such as holidays and to the real world events related to the song (e.g., album re-lease). Figures1.2(d-f) shows examples of the popularity evolution of Twitter hashtags focused on the 128 hours around the peak hour (most popular hour). The first exam-ple, Figure1.2(d), shows a hashtag whose popularity curve follows a periodic behavior. The other two Twitter examples show that before the peak, a exponential like growth is achieved by the hashtags. After the peak, either exponential or long-tailed decays can be seen depending on the example. In some cases, such as in Figure 1.2(e), a smaller cascade seems to follow up on the larger one. As shown by previous work, such cascade patterns (exponential growth followed by an exponential or long tail decay) are usually caused by viral like propagation [64,91].
on the popularity evolution.
Empirical Hypothesis In sum, the guiding hypothesis we evaluate throughout this dissertation is: Given the different features which may sur-round social media objects online – particularly the referrers (e.g., incoming links to objects) and features related to real world events (e.g., album re-leases) – will such features have an impact on the popularity evolution of the social media objects?
Nevertheless, such a hypothesis is still very broad, and we now narrow it down as a problem statement and specific research goals in the next section.
1.2
Problem Statement
In general terms, the problem we intend to address is defined as follows. Given a collection O of social media objects, say YouTube videos, we define for each object
o 2 O a set of popularity, content, social, referrer and real world features related to
o. Popularity features account for measures of popularity, say views or comments over time. Content features can be textual information associated with the object, such as tags and object descriptions, or even how users perceive the quality of the content with ratings and likes. Social features are related to the user who posted the content and her online social network. For example, a followers or friends network in the application. Referrer features contain information about the incoming links exploited by users to reach object o from other websites. Finally, some features are related to external real world events such as the dates of album releases by music artists. We call these features real world features.
Table 1.1: Definitions of Social Media, User Generated Content, Online Information and User Activities
Definition Examples
Social Media Technology that enables
on-line social behavior
Blogs, Video Blogs, Music Sharing, Ratings, Crowd-sourcing
User Generated Content Content generated by users YouTube Videos, Blog posts, Microposts. Specific case of social media objects.
Social Media Objects Memes and pieces of infor-mation propagated through social media
UGC, online news, online music, as well as more specific information such as text quotations, video frames
User Activities User behavior (e.g., posting, liking, viewing, sharing etc.) that cause the online popu-larity of objects
Posting, sharing, comment-ing etc.
of the features up to a reference timetr. In the case of popularity prediction, we aim at exploiting features to determine the popularity of objects at a target time tt=tr+ .
This general objective is narrowed down into three specific research goals we aim to achieve in this dissertation. Before introducing them in the next section, we present our definitions of social media, user generated content, user activities, and
1.3
Research Goals
RG1 - Understanding Feature Importance: Our first research goal focuses on: (1) characterizing how object popularity evolves over time; (2) characterizing how object popularity evolution correlates with the referrers that most often lead users to objects (as well as with other content, social and popularity features); and, (3) modeling the evolution of popularity of objects. We note that, unlike previous work, that correlated different features of objects with final popularity [13,139], here we are concerned with measuring the impact of referrers on how the popu-larity of each object evolves over time [91,139]. At the same time we exploit this information in order to model the popularity evolution of individual objects. As a basis for comparison, we also study: (1) popularity features, that are related to temporal data about the evolution of popularity of individual objects; and (2) content features, such as the category of a video. In particular, we study how users perceive the content of social media objects and how such perception correlates with popularity.
RG2 - Predicting Object Popularity: After data characterization and modeling, we intend to exploit the available data to answer the following question: Is it possible to predict how the popularity of individual objects evolves over time? In other words, we want to know if it is possible to predict the popularity curve (or trend) of each object. We also investigate whether more effective methods to predict the popularity measures (e.g., views) of an object at a target date can be devised. This is done by exploiting the developed popularity trend prediction models (e.g., by building specialized models to pre-defined popularity trends). Our results showed that we can indeed improve popularity prediction models using trend prediction models. More importantly, unlike previous studies [4,81, 110,129,150], we shall focus not only on predicting the popularity of a video at time tt = tr+ , but also on the evolution its popularity it may follow after prediction.
Social Media Time Series
Social Media Features
Extraction of Temporal Patterns of Popularity Trends - RG1 (Chpt. 4)
Understanding Feature Importance - RG1
(Chpt. 4, 5)
Learning Popularity Prediction Models - RG2
(Chpt. 6 and 7) Mining User Activites (Revisits and Flows) -RG3 (Chpt. 8 and 9)
Data Collection
(+) YouTube (+) Last.FM (+) Twitter
Figure 1.3: Pictorial Representation of our Research Goals
impacts popularity. The revisit behavior has important implications on the social media application as it allows us to break popularity down into audience (unique users) and revisits (returning users). For instance, marketing services should care most about the audience of a particular content, as opposed to its total popularity, as each access does not necessarily represent a new exposed individual. After our study on revisits specifically, we broaden our view to the attention flows of users. In contrast to the “stickyness”, which is captured by revisits, attention flows also capture how users change attention from one object to another. One interesting research question we tackle in here is whether objects compete or collaborate for user attention. Understanding object popularity from a competition and collaboration perspective is a novel task [89,118,119,132], and brings important insights on how popularity evolves online.
1.4
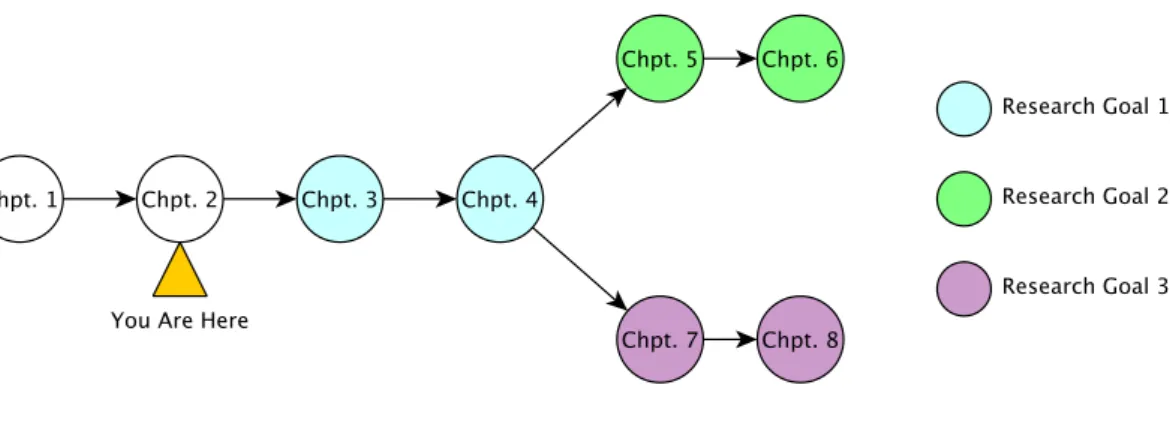
Contributions and Outline of this Dissertation
In Figure1.3 we show how the research goals of this dissertation relate to each other. We also emphasize the chapters in which each research goal is addressed. The rest of this dissertation is organized as follows. Chapter 2 discusses our related work and the background required for understanding the rest of the dissertation. Our main contributions are organized in the following chapters:
of-ten lead users to such videos. Also, using clustering techniques, we extract the most common popularity evolution trends followed by videos. We then correlated different features from the videos with the trends and popularity values of videos. Our results are crucial to understand feature importance. These results provides the base knowledge needed to understand our findings in the next chapters.
Chapter 4 A study on the users’ individual perceptions of YouTube videos and how these perceptions are connected with popularity. That is, we employ crowdsourc-ing tools and user surveys to understandcrowdsourc-ing the relationships between explicit users’ feedback on content and content popularity. In this chapter we tackle two simple but fundamental questions: (1) Can users reach consensus on a video they prefer from a pair of videos? (2) If consensus is reached, is the preferred video by the users the most popular one? Our goal on tackling these two questions is to to shed a light on the importance of users’ perception on the popularity of objects. The first question aims at answering if a group of users will prefer a single piece of content (object). Whereas the second, aims at finding the relationship between the content (preferred by users) and the popularity.
Chapter 5 On Chapter 5 we begin our study on RG2. Specifically on this chapter, we build novel methods of popularity prediction. The case study of this chapter on News content that is shared on social media applications. In the news setting, there is a clear motivation to determine the future popularity (e.g., in two days) of an object, using only the information available shortly after the upload (e.g., a few hours) [18]. To predict popularity, we make use of a combined learning approach to: (1) extract popularity trends from popularity time series; and, (2) predict the popularity values of newly uploaded objects using these trends. The first step makes use of clustering techniques and represents each trend by a time series centroid. Our combined approach is quite effective, as it achieves results better than state-of-the-art baseline approaches. This prediction technique was also the winner on two out of three tasks of the ECML/PKDD 2014 Predictive Analytics Challenge.
Chapter 6 While news pages have a clear popularity prediction target time due to the timely nature of the content [18] (e.g., two days after the first hour), this target time definition is less clear in some social media settings (e.g., UGC). One example of the complexity behind social media popularity is the YouTube video ofHenri, le Chat-Noir9. The first video of Henri was uploaded in 2007 and
9
remained in obscurity for years. However, in 2012 a user of the Tumblr social network found the video and posted it online10. Currently, the video has millions of visits from a wide range of different sources (e.g., OSNs, search engines, word-of-mouth and so forth). Motivated by such examples, and our understanding of UGC popularity from Chapters 3 and 4, we here create theTrendLearner
method. The goal ofTrendLearneris to predict the popularity trends of UGC. Moreover,TrendLearneraims at capturing the tradeoffbetween the remaining interest in objects after prediction and the accuracy of predictions. Remaining interest captures how many views an object will receive after prediction was performed. In the UGC setting, capturing the remaining interest is important since it is unclear when an object will begin to become popular and/or interesting. This is a key contribution of our TrendLearner method.
Chapter 7 Starting from this chapter we begin our study on RG3. In this chapter specifically, we focus on understanding the revisit behavior of users to social media objects. Repeated consumption, or revisits, account for a large fraction of the total popularity online [5]. Understanding how and why users evisit a single object is crucial for accurate popularity evolution models. Based on this characterization, we derive the Phoenix-R model. We show how this model accurately captures the evolution of popularity of objects. An important facet of Phoenix-R is that it also accurately models multiple bursts, or cascades, of visits to a single objects. As we have discussed, such bursts are related to referrers and real world events. Thus, by modelling them we take a step forwad in understanding their impact in popularity. Finally, ourPhoenix-Rmodel is more accurate than state-of-the art competitors and can also be used for popularity prediction.
Chapter 8 Finally, we propose theA-Fluxapproach, a user attention mining method designed to cope with the complex challenges of mining user visits to social me-dia objects. One of the main technical contributions of A-Flux is a proba-bilistic graphical model that captures the latent object-to-object transitions of user attention. We employ A-Fluxon large music streaming datasets, revealing interesting and meaningful user attention flow maps and patterns.
Finally, Chapter 9concludes this dissertation and presents a discussion on direc-tions for future work.
10
Background and Related Work
This
Dis-sertation
User Generated
Content
Static Pop-ularity
Evolution of
Pop-ularity Popularity
Pre-diction Network
Views of UGC
This Thesis Time Series
Data Mining
Statistics
Econo-metrics
Machine Learning
This Thesis Empirical
Popularity
Heavy Tail Power
Law Causes of Pop-ularity
Markets and Pop-ularity
This Thesis User Behavior
Epidemic Models
Competition Models
Social Networks
Figure 2.1: Mind Map of the Themes Related to this Dissertation
In this chapter, we present a summary of background knowledge and related work that is fundamental to the understanding of this dissertation. We discuss previous efforts related to each of the three research goals presented in Chapter 1, which can be grouped in to several topics as shown in Figure 2.1. In Section 2.1, we discuss
empirical studies on popularity in general. Afterwards, in Section 2.2, we shift our focus to studies on user generated content, the type of content that is mostly explored in this thesis. This section is narrowed down as follows:
1. in Section 2.2.1 we discuss previous characterizations of social media objects popularity as a single static measure;
2. previous analyzes of the temporal evolution of social media objects popularity over time are discussed in Section 2.2.2;
3. Section 2.2.3 discusses popularity prediction models for social media;
We discuss some of the more recent approaches in understanding popularity through user activities and social network datasets through the use of competition and collaboration models, as well as epidemics based models, in Section 2.3. Finally, we provide a more in-depth summary of time series statistics and data mining tech-niques that are used by our research, or can be exploited in future developments, in Section2.4. We summarize this chapter in Section 2.5.
2.1
Empirical Studies on Popularity
We begin our discussion with a brief summary of previous studies of general charac-teristics of popularity of different “quantities” of human knowledge (e.g., film revenues, book sales, votes received by political candidates, among others). This brief intro-duction, presented in Section2.1.1, is useful to understand the nature of heavy-tailed distributions, which are used to characterize different properties of popularity of on-line information, such as the distribution of final popularity and decay in popularity over time. This is presented in Section 2.1.1. Afterwards, in Section 2.1.2 we review some efforts that analyzed the effects of different market and social factors that impact popularity.
2.1.1
Probability Distributions of Popularity
contents will have very high popularity (hundreds of millions or even billions of views). Two heavy-tailed probability distributions are often used to quantify the popularity of different quantities are Power-law distributions [103] or the Log-normal distribu-tion [28,126]. In general, a quantity drawn from a Power-law distribution will have the probability density function:
p(x;C,↵) =Cx α
, (2.1)
with any positive ↵, but typically falling the range 2 < ↵ < 5. C is a normalization constant. Clausetet al. and Newman provide substantial studies on the nature of such distributions [28,103]. In almost all of the cases the distribution above will only be observed for values of x > xmin [28]. A Log-normal distribution has the form:
p(x;µ, ) = 1
x p2⇡✏
(logx µ)2/2σ2
, (2.2)
where µ and are respectfully the mean and standard deviation of the distribution.
Popularity (quantity) - x
p
(
x
)
(a) synthetic power law
Log Popularity (quantity) - x
log
p
(
x
)
(b) data in log log
log p(x)
Quantity -q
P
(
X>
q
)
(c) empirical fitting
Data Log-normal Power-law
Figure 2.2: Synthetic Power-law Datasets.
popu-larity instead of Power-law or Log-normal specifically. We now discuss some of these studies.
The work of Sinha and Pan [126] provided an extensive analysis of the distribu-tions of popularity for different quantities related to human knowledge (e.g., books or films revenues) or even ideologies (e.g., votes for political candidates). The study found the heavy-tailed behavior in most of such quantities. Also, the same study found that not only do final values of popularity tend to follow heavy-tailed distributions, but also, in some cases such as film revenues, the decay over time can also be modeled as such. However, in some cases, an exponential decay over time was also observed. This effect heavy-tailed popularity measures, and also the heavy-tailed/exponential popu-larity decay over time, was also verified in user generated content [22,34,78,84,133], as further discussed in Section2.2.1.
There are many explanations for the existence of heavy-tailed distributions of popularity in most quantities of human knowledge. One of the most used explanations is the rich-gets-richer phenomenon. Rich-gets-richer, also known as cumulative advan-tage or preferential attachment, states that quantities with higher popularity will tend attract more attention over time [41]. Other authors, have looked into the stochastic processes based on exponential mixtures of exponential growth models [3,67,97,115]. One example of such a process is the growth of cities, which has been shown is expo-nential in nature for individual cities. At the same time cities grow expoexpo-nentially, new cities are also born with an exponential rate. These processes also cause heavy-tailed distributions. In any case, one important take-away here is that, although the afore-mentioned studies provide some empirical evidence of how to model popularity, little discussion is provided on what exactly causes such distributions of popularity. For instance, although the aforementioned models may explain the heavy-tailed behavior, they do not take the social and market structure surrounding online information into account. Such factors may explain the cause why some relatively unknown artists, like Psy,1, may to rise to fame.
2.1.2
The E
ff
ects of Markets on Popularity
Motivated by the question of which factor has the most impact on popularity, quality or social influence, Salganik et al. [122] created an artificial musical market where users were asked to rate music based on their tastes. One set of users had knowledge of the popularity (based on previous ratings) of songs, while the other set of users had no such knowledge. The authors concluded that social influence leads to more
1
skewed popularity distributions and, surprisingly, less predictability. Even though this study neglects many factors of real world musical markets, it showed that social influence makes market prediction less effective. Thus, it provides evidence that the dynamics of popularity, even in restricted settings are difficult to account for. In a sense, these results related to another work by the same authors that suggested that viral like epidemics of online propagation of information (which are related to popularity [91,126]) are caused by the aggregation of small influences of a large number of unrelated individuals [140], which is a hard to predict phenomenon. Similarly, the hardness of predictability of popularity due to a wide range of social phenomena and different object features that exists in society has also been argued by the work of Lee
et al.[79]. One simple example of these factors is also detailed in the work of Lakkaraju
et al.[78]. Here, the authors showed that just the time of day and the title of a Reddit2 post have significant impact on the popularity of the post.
Another important concept is the effect of exposure on the popularity of products or brands. A number of previous studies [37,42,52,87] showed that purchase intent and awareness of a brand are related to the exposure (e.g., number of views) to an advertisement. This feature is usually known as promotion and is one of the causes of popularity growth (see Chapter 3). Those studies also provide valuable insights on how online markets behave and further motivate our work on music streaming services, discussed in Chapter 8.
2.2
Popularity of Social Media Objects
The focus of our dissertation is on the popularity of social media objects. As de-fined by Kaplan and Haelin [74], user generated content (UGC), online social networks (OSNs [96]) and even massive online games (such as Second Life and World of War-craft [93]) all belong to the broader phenomenon ofsocial media. Figure2.3presents an illustrative example of a typical social application. The picture depicts users connect-ing to one another via an internal OSN, while other users may access public content without being registered in the application. Note that both OSN related factors and external users may impact content popularity, as we shall further discuss in this sec-tion. The remainder of the section is divided as follows. We start by discussing earlier studies of social media popularity, which focused mainly on static views of popularity of UGC (Section 2.2.1). We then discuss some previous efforts to analyze the temporal evolution of popularity (Section 2.2.2) and which develop popularity prediction models
2
(Section 2.2.3).
Figure 2.3: Example of Connections in a Social Media Application
2.2.1
Static Views of Popularity of Social Media Objects
Understanding the popularity of a piece of content (or object) is a subject that has gained attention from researchers since the earliest studies of social media. Most of these studies analyzed the total number of views measured at the time the data was crawled, or the “final” popularity, paying little or no attention at how content popularity evolves over time. Starting with video content, Cha et al. [22] presented an in-depth study of two video sharing systems. The authors analyzed the popularity distribution of objects, some few aspects on the popularity evolution, as well as content characteristics of YouTube and of a popular Korean video sharing service. Moreover, the authors investigated mechanisms to improve video distribution, such as caching and Peer-to-Peer (P2P) content distribution networks (CDNs). In a similar fashion, Chatzopoulou
et al.[26] characterized the largest dataset of YouTube videos at the time, finding that, for older videos, moderate to strong correlations exist between popularity measured in number of views and other metrics such as number of comments and favorites. They also found that in the case of younger videos, such correlations are weaker, indicating that their long term popularity dynamics are not yet stable.
higher impact on the views a user receives through her videos. This study is in agree-ment with the one by Susarla et al. [128] which showed that subscriber links play an important role in the early popularity of videos. Another study was done by Borgholet al.[13] which also analyzed the correlations between popularity of YouTube videos and content factors, determined by groups of duplicate videos (or clones, as the authors call them), finding positive correlations the clone features and popularity. In details, the authors correlated final popularity with current popularity and clone groups. In order to achieve this, the authors make use of a linear regression model between the loga-rithm of past popularity plus the clone groups, the regressors or explanatory variables, and the logarithm of current popularity, the regressand or response, that is:
log(ycurrent) = 0⇤log(ypast) + X
c2C
c ⇤ v2c+↵ (2.3)
where ycurrent is the current popularity, ypast is the past popularity, c is a clone group andCis the set of clone groups. Moreover,v is a video and v2c is an indicator function that takes value of 1 if v 2c, that is, if v is part of the clone group c and 0 otherwise. i are the regression coefficients. With the model above, the authors showed that the addition of new binary explanatory variables, captured by P
c2C c⇤ v2c, to the linear model, improved the regression quality captured by the coefficient of determination
R2 [69]. The authors argued that this result implies that popularity is related to
content, since clone groups have the same content.
Flickr images were also the focus of attention of many early studies of UGC popularity. Zwol [133] measured the popularity of images, finding that heavy-tailed distributions explain both the total popularity and decay in popularity over time. It is interesting to note that many of the early studies on Flickr focused on folksonomies and tags [57,82,88], which are also examples of UGC. For instance, Marlow et al. [88] found heavy-tailed popularity distributions for tag popularity, where the popularity of a tag was measured either by number of images it annotates or number of user’s that used the tag in their libraries. This result has also been observed when tags are used to annotate other kinds of media, such as videos and text data [45]. On the subject of diverse kinds of media, the work of Recuero [36] and of Leskovec et al. [84] also found heavy-tailed patterns in the distribution of the number of blogs a given sentence appears in.
on either a single snapshot of the popularity of objects or on a few snapshots only [22, 54,133]. In this sense, these studies did not analyze the long-term temporal evolution of popularity as we do.
2.2.2
Popularity Evolution Over Time on Social Media
Applications
The popularity evolution of online content has been the target of more recent studies. Focusing on YouTube videos, Borgholet al.[14] showed how weekly based views can be used to model video popularity. Also, the authors developed a model to determine the number of videos that may exceed a given popularity threshold, although such model does not indicate which specific videos these will be [14]. More recently the work of Islamet al. [68] showed that the weekly based modeling of video popularity in videos is still valid even years after upload. However, the synthetic model for predicting and generating the distribution of popularity of a group of videos, as proposed by the au-thors [14], does not. Zhouet al.[155], showed the importance of related videos links to popularity. Still on the subject, the importance of incoming links and content features to the final popularity of YouTube videos has been further analyzed recently [13]. It is important to note that some of these studies were done in parallel to ours on RG1 (which will be discussed on Chapter3). Moreover, these studies are not focused on the prediction of popularity of individualvideos (as is one our goals).
Broxton et al.[16] analyzed the popularity patterns of viral videos. According to the authors, a viral video is one that receives a large fraction of views from OSN appli-cations. The authors developed a method to rank different sources of traffic to videos according to their potential in attracting more views. Brodersenet al. [15] made use of the same model to determine, amongst other things, if viral videos receive most views from the same geographic region. The authors showed that, surprisingly, most viral videos will have an initial burst in propagation in a diverse set of geographical regions, later falling back to the region of upload. Diversity was measured by entropy [32], which is defined as:
H(x) = 1⇤X x2X
p(x)log(p(x)) (2.4)
of the entropy). For instance, notice that with few observations, the values of p(x) will be close to a uniform distribution because of the low initial popularity. Uniform distributions are the ones with maximum entropy [32]. Previous work also focused on geographical propagation of Twitter data [43,71]. Among other things, authors find that some cities are trend-setters (sources of popular memes), while others are trend-consumers (sinks).
Focusing on image content, Cha et al. [24] analyzed the propagation of pictures through Flickr’s internal OSN. The authors found that popularity (measured in number of favorite markings) of the most popular Flickr pictures exhibit close to linear growth. The authors discussed the importance of social links in the increase in popularity of images, showing that about 50% of favorite markings come from social cascades. That is, user A marks a picture as favorite after her friend user B marked the same picture. Another interesting work was done by Ratkiewiczet al.[114]. The authors investigated how external events, captured by search volume on Google Trends3 and local browsing (i.e., university/community traffic), affect the popularity of Wikipedia articles. More recently, Khoslaet al. [76] compared the use of image and social features for predicting the final popularity values of images. Their results are complementary to ours, as they focus on understanding a different social media application than the ones we study (Flickr). More importantly, the authors do not focus the long-term popularity trends, as we do.
Time
P
op
.
Time
P
op
.
Time
P
op
.
Time
P
op
.
Time
P
op
.
Time
P
op
.
Figure 2.4: Examples of Popularity Evolution Trends on Twitter [146]
There have also been some efforts towards clustering social media objects in terms of their popularity temporal patterns. Crane and Sornette proposed Hawkes based models to explain how a burst in video popularity in terms of endogenous user interactions and external events [34]. Yang and Leskovec [146] proposed a time series clustering algorithm to identify trends on temporal patterns of popularity evolution. The model proposed by Matsubara et al. [91] provides a unifying analytical frame-work of the temporal patterns extracted by Crane and Sornette [34] and Yang and
3
Leskovec [146]. An example of such trends are depicted in Figure 2.4 for a toy dataset of 1000 Twitter hashtags. In the y-axis each figure shows the popularity shape of the trend, while on the x-axis is the time. The algorithm which extracts such trends [146] will be discussed in more details in Section 2.4, here we simply note that it is focused on the overall shape of popularity evolution and not popularity values, the reason why we omit numbers from both axes. We employ this algorithm as a component of our approach in dealing with popularity prediction (see Chapters 5and 6).
Although the aforementioned efforts provide some insights into the evolution of content popularity, there is still little knowledge about which object features (e.g., video, link and popularity features) and system mechanisms (e.g., search) contribute the most to popularity growth. Thus, our analyses and findings greatly build on previous efforts, shedding more light into the complex task of social media objects popularity prediction. Moreover, unlike previous prediction efforts that focused on estimating future popularity measures, one of our focus in this dissertation. More specifically Chapter6, is to tackle the challenge of predicting popularity trends while at the same time maximizing remaining interest after prediction, a task which, to the best of our knowledge, has not been studied yet.
2.2.3
Prediction of Popularity of Social Media Objects
We now focus on previous research that aimed at developing models to predict the popularity of a piece of content at a given future date. Our goal for the moment is to summarize the main previous efforts of the popularity prediction task. For simplicity, we leave the mathematical treatment of the data mining and time series techniques exploited by these efforts to be discussed in Section 2.4.
As stated by Leeet al.[79], popularity is related, in a complex way, to the social and psychological perspective of users regarding online content. Thus, deriving effective prediction models is not only difficult but also depends on characteristics of the target application. The same authors made use of a survival analysis approach [33] to predict the lifespan of online comments, that is, the probability that comments will still arrive at a comment thread after a given time t. They also developed models to predict the popularity of the thread at timet.
method to predict the popularity of YouTube and Digg content from early measures of user accesses [129]. This method has been later extended and improved with the use of multiple features [110].
In a different direction, Saez-Trumperet al. focused on the problem of identifying trendsetters - a twitter user who adopts, spreads and influences others with new trends before they become popular [121]. Regarding the rankings of an item (based on likes and dislikes), Yinet al.[150] proposed a model that took into account user personalities when casting votes, and developed a Bayesian model for ranking prediction. They tested their model in a popular IPhone application, JokeBox. Moreover, popularity prediction has also gained the attention in other contexts. In the particular context of search engines, the work by Radinsky et al. [112] proposed a model to predict future popularity, seasonality and the bursty behavior of queries.
We note that none of these prior efforts focused on the problem of predicting popularity trends. In particular, those focused on social media popularity prediction assume a fixed monitoring period, and do not explore the trade-off between prediction accuracy and remaining views after prediction. Even though some authors show the effectiveness of their methods for different monitoring periods [79,110,129], they did not discuss on methods how to determine such monitoring periods for each individual object, as we discuss in Chapter 6.
The previous efforts that are most related to ours are those reported in [107] and [4]. The former presents a model to predict whether a tweet will become a trend-ing topic by applytrend-ing a binary classification model (trendtrend-ing versus non-trendtrend-ing), learned from a set of objects from each class [107]. The objects are previously la-beled by Twitter’s internal mechanisms. Our work builds upon [107] by proposing a more general approach to detect multipletrends (classes), where trends are first auto-matically extracted and learned from a training set. Our approach also exploits the concept of shapelets [148] to reduce the classification time complexity, as we discuss in Chapter 6.
separation between training and test sets). Adapting this method to tackle the early trend prediction problem is not straightforward, and is left for future work.
We also mention some other efforts to detect trending topics in various domains. Vakaliet al. proposed a cloud-based framework for detecting trending topics on Twit-ter and blogging systems [131], focusing particularly on the implementation of the framework on the cloud, which is complementary to our goal. Golbandi et al. [56] fo-cused on detecting trending topics for search engines. Despite the similar general goal, their solution applies to a very different domain, and thus focuses on different elements (query terms) and exploits different techniques (language models) for prediction. Fi-nally the work of Jiang et al. [70], exploits content and social features to predict the day a video is going to peak. However, the authors do not provide a detailed analysis of the importance of each feature to popularity, as we do.
In sum, to our knowledge, we are the first to tackle the inherent challenges of producing predictions of popularity (trends and measures) as early and accurately as possible, on a per-object basis, recognizing that different objects may require different monitoring periods for accurate predictions. We build upon existing methods, extend-ing them and combinextend-ing them, to design novel solution to this problem.
As a summary of this whole section, we note that all of the studies that we have discussed up to here provided us with valuable understanding of popularity of social media objects. Nevertheless, important aspects, such as understanding the importance of various factors on popularity, specially the referrer features, as well as how to provide
useful predictions of popularity while maintaining a reasonable amount of remaining interest, have been neglected or have not been thoroughly investigated in depth by these previous efforts.
2.3
Popularity Through the Lens of User Activities
In this section, we shift our focus to previous efforts on understanding popularity through user activities or online social networks. More specifically, we discuss efforts that emphasized studies on popularity using epidemics based models, repeated con-sumption, as well as studies that focused on competition and collaboration models. These papers are crucial for understanding ourPhoenix-R and our A-Fluxmodels, that are described in Chapters7 and 8 respectively.
indi-viduals. The simplest epidemic model is the Susceptible-Infected (SI) model. The SI model considers a fixed population divided intoS susceptible individuals andIinfected individuals. Starting with S(0) susceptible individuals and I(0) infected individuals, at each time step S(t 1)I(t 1) individuals get infected, and transition from the
S state to the I state. The product S(t 1)I(t 1) accounts for all the possible connections between individuals. The parameter is the strength of the infectivity, or virus. The equations of the SI model are as follows:
dS
dT = SI (2.5)
dI
dT = SI (2.6)
Cha et al. used an SI model to study how information (i.e., the “disease”) dis-seminates through social links on Flickr [23], whereas Matsubara et al. [91] proposed an alternative model called SpikeM. SpikeM builds on an SI model by adding, among other things, a decaying power law infectivity per newly infected individual, which produces a behavior that is similar to the model proposed in [34]. The SpikeM model was used to capture the time series popularity for a single cascade. One of the reasons why the SI model is useful to represent online cascades of information propagation is that individuals usually do not delete their posts, tweets or favorite markings [23,91]. Thus, once an individual is infected he/she remains infected forever (as captured by the SI model).
Repeated Consumption Models - Weng et al. [141] proposed an Yule-Simon [19] agent-based model to investigate the role of user activities (in special the limited at-tention of users) in the dissemination of information on Twitter. Similarly, Anderson
et al. [5] investigated the repeated consumption of users by proposing a model (which is also a Yule-Simon based approach) that combines recency and content quality effects to predict the chance of a user re-consuming a given object.
Competition and Colaboration Models - Latent Dirichlet Allocation (LDA) [10] is currently one of the most powerful and used tools for latent analysis in large datasets. In the context of user attention, Limited Attention LDA (LA-LDA) and Limited At-tention Collaborative Topic Regression (LA-CTR) have extended the original LDA approach to incorporate the limited attention of users, being effective to support the recommendation of new content [72,73]. Myers and Leskovec [100] proposed the Clash model to mine the competition and collaboration among online memes. However, the Clash model has two main constraints, namely: (1) it captures competitive and collab-orative behavior of memes by exploiting the follower links, and thus are more suited to domains where such links are a primary means of information dissemination such as online social networks (OSNs); and (2) the approach is based on maximum likelihood estimates, which have limitations due to long tail effects [116].
Our work on the A-Flux model also focused on providing a latent factors ap-proach to mining competition and collaboration. Different from the aforementioned approaches, we do not rely on OSN link data. This is specially interesting in the music streaming industry, our case study withA-Flux. Here, it is very difficult to pin-point a who-exposed-whom to a piece of information, since music propagates online and of-fline [108]. We also point out that our A-Flux model is also based on LDA. Also, the model is similar, in terms of the probabilistic graphical structure, as other models proposed in different settings such as text mining [61,90,137,144,149].
On a complementary effort, Ribeiro et al. modeled user activity as a commodity on membership based websites [118,119], showing that it can be used to predict if such sites will remain attractive over time. Finally, Matsubara et al. [89] made use of the Voltera-Lotka equations to model co-evolving, and possibly competing, time series of user attention to web products and services. Both of these efforts are time series based, whereas our work is focused on user activities. It thus provides a more fine grained view of the competition and collaboration issue.
2.4
Time Series Statistics and Data Mining
related to the context of social media and popularity prediction. For a more detailed and comprehensive presentation, we refer to the following books [25,125], Chapter 11 of [86] and the survey [50].
The rest of this section is divided as follows. We first discuss common represen-tation of time series in Section 2.4.1, since this is the basis for any data mining task with this kind of data. Afterwards, we discuss the regression models commonly used to predict popularity of social media objects in Sections 2.4.2 and 2.4.3. We discuss time series distance measures and machine learning approaches in Section 2.4.4.
2.4.1
Time Series Representation
In research areas such as Statistics [25,125] and Econometrics [142]4 it is common to represent time series using definitions from thestochastic processesliterature. Since this is a more general representation, we begin by briefly describing stochastic processes. We then narrow this definition down to the vector representation of time series commonly used in data mining (as well as this dissertation).
A stochastic process is denoted as:
{xti} 1
i=1 =xt1, xt2, xt3,· · · , (2.7)
where xti are values in R. Each such observation defines the quantity which the time series captures. The valuestirepresent the points in time (or indexes) for each quantity
xti. A necessary condition is that t1 < t2 < t3· · ·tn, that captures the nature of a series. It is common for quantities to be observed at uniform lengths from one another, thus making the use of the index variable ti unnecessary in most applications. Thus, a simpler notation is {xt}1t=1. Such processes can also be written as a cumulative
probability density function of each ti:
F(c1, c2,· · ·) =P(xi c1, x2 c2,· · ·), (2.8)
with ci 2 R. We note that this definition is more commonly used in descriptive statistics. Such a notation is useful for understanding the statistical properties of time series. Notice that in both notations the time series are represented up to infinity, thus
4
the notion of a never ending process. For example, a simple stochastic process is the one bellow:
M A(q)!xt= q
X
i=0
i✏t i, (2.9)
which is an example of a moving average (MA) model of level q. Here, i are the parameters and✏t i is white noise (e.g, Gaussian error) [25].
While the stochastic process based definition is more general, in practice we observe a subsequence of the time series. That is, a vectorxof observations is observed. In this sense, a time series can be summarized simply as a sequence of data points measured at different times steps [50]. Thus, we define a time series vector as:
x=< xt1, xt2, xt3,· · · , xtn >, (2.10)
wherexis an observation vector, again composed of valuesxti 2R. The same comment for uniform indexes apply in this case, thus turning the definition above in the one below:
x=< x1, x2, x3,· · ·, xn > . (2.11) When appropriate, we take the liberty to define a process as a time series stream, which is:
ˆ
x=< xt1, xt2, xt3· · · (2.12)
This notation captures the intuition of a never ending process, but using the vector like notation that is exploited throughout the dissertation.
We take some time to discuss how different studies on social media instantiate
![Figure 2.4: Examples of Popularity Evolution Trends on Twitter [146]](https://thumb-eu.123doks.com/thumbv2/123dok_br/15811800.135140/43.892.145.772.699.861/figure-examples-popularity-evolution-trends-twitter.webp)