MICRO-REVISÕES GERADAS POR USUÁRIOS:
CARACTERIZAÇÃO E PREDIÇÃO DE
MARISA AFFONSO VASCONCELOS
MICRO-REVISÕES GERADAS POR USUÁRIOS:
CARACTERIZAÇÃO E PREDIÇÃO DE
POPULARIDADE
Tese apresentada ao Programa de Pós--Graduação em Ciência da Computação do Instituto de Ciências Exatas da Universi-dade Federal de Minas Gerais como req-uisito parcial para a obtenção do grau de Doutor em Ciência da Computação.
Orientador: Jussara Marques de Almeida Gonçalves
Belo Horizonte
MARISA AFFONSO VASCONCELOS
USER GENERATED MICRO REVIEWS:
CHARACTERIZATION AND POPULARITY
PREDICTION
Thesis presented to the Graduate Program in Computer Science of the Universidade Federal de Minas Gerais in partial fulfill-ment of the requirefulfill-ments for the degree of Doctor in Computer Science.
Advisor: Jussara Marques de Almeida Gonçalves
Belo Horizonte
Vasconcelos, Marisa Affonso
V331u User generated micro reviews: characterization and popularity prediction / Marisa Affonso Vasconcelos. — Belo Horizonte, 2015
xxv, 166 f. : il. ; 29cm
Tese (doutorado) — Universidade Federal de Minas Gerais — Departamento de Ciência da Computação
Orientadora: Jussara Marques de Almeida Gonçalves
1. Computação Teses. 2. Redes sociais online -Teses. 3. Predição (Lógica) - -Teses. 4. Comportamento do consumidor - Teses. I. Orientadora. II. Título.
Aos meus pais, Maria Aparecida e Antônio, aos meus irmãos, Mariana e Daniel, a minha avó Hercília, a amiga Vanessa Vidal e a todos aqueles que acreditaram nesse trabalho.
“Reconhece a queda. E não desanima.
Levanta, sacode a poeira. E dá a volta por cima.”
Paulo Vanzolini, “Volta por Cima”
Acknowledgments
À Prof. Jussara Almeida, orientadora da tese, agradeço o seu apoio, disponibilidade, paciência e dedicação. Obrigada pelos seus ensinamentos, pela confiança e amizade ao longo deste período. Ter sido sua orientada foi uma experiência extremamente rica. Ao Prof. Marcos Gonçalves pela colaboração, dedicação e incentivo.
Eu gostaria de agradecer a todos os professores do PPGCC, em particular aos professores Fabrício Benevenuto, Virgílio Almeida e Wagner Meira Jr. por estar sempre dispostos a me ouvir e ajudar. Eu gostaria de agradecer aos vários funcionários e alunos do PPGCC que sempre estiveram disponíveis para me auxiliar. Tenho muito orgulho de ter feito parte de um programa de pós-graduação de tamanha excelência e qualidade. Aos amigos do laboratório CAMPS que sempre estiveram disponíveis para me auxiliar no que eu precisasse e em tornar essa caminhada mais divertida. Obrigada Giovanni Comarela, Gabriel Magno, Tiago Rodrigues, Geraldo Franciscani, João Pesce, Rafael Ottoni, Matheus Santos, Evandro Cunha, Diego Las Casas, Gustavo Rauber, Emanuel Vianna, Diego Saez-Trumper e Felipe Moraes. À amiga Tatiana Pontes pela colaboração e por estar sempre ao meu lado compartilhando as dificuldades e conquistas dessa caminhada. Ao amigo Saulo Ricci por ser imprencidível para a realização desse trabalho e pela amizade. Ao amigo Daniel Hasan pelas discussões que contribuíram para o sucesso desse trabalho.
À amiga Vanessa Vidal que insistiu que eu seguisse as minhas intuições e meus talentos no desenvolvimento desse trabalho.
Aos meus pais, irmãos e minha avó que torceram pelo meu sucesso. Obrigada pelo amor, carinho e incentivo dado durante todo o processo.
À FAPEMIG e ao CNPq pelo apoio financeiro.
A todos aqueles que de alguma forma colaboraram para a realização deste tra-balho.
“Life can only be understood backwards; but it must be lived forwards.” (Søren Kierkegaard)
Resumo
Desde a popularização da Web 2.0, as pessoas se tornaram cada vez mais engajadas ao expressar suas opiniões através de revisões sobre produtos e serviços. Como outros tipos de conteúdo gerado pelo usuário, revisões on-line vêm em várias formas, tamanhos e qualidades. Tal variabilidade na qualidade é particularmente notória em revisões textuais produzidas em aplicativos móveis, geralmente chamadas de micro-revisões ou tips, devido à sua concisão inerente. Em um ambiente abundante de conteúdo, ser capaz de estimar a utilidade de uma (micro-) revisão on-line, e finalmente, prever a sua popularidade futura entre os usuários, com precisão e o mais cedo possível, pode ser muito benéfico para os métodos de filtragem e recomendação de conteúdo, auxiliando os usuários a encontrar revisões valiosas e fornecendo umfeedback rápido a empresários e futuros clientes.
Nesse contexto, investigamos como os usuários exploram micro-revisões, focando, particularmente, nas tips do Foursquare, um tipo cada vez mais popular de revisão cujo elevado grau de informalidade e concisão oferece dificuldades extras na concepção de métodos de predição efetivos. Usando dados coletados do Foursquare, investigamos também como a popularidade da tip, estimada pelo número de vezes que a tip recebeu um like de um usuário, evolui ao longo do tempo e quais os fatores que podem ser combinados para desenvolver um modelo para prever a popularidade da tip em um dado instante no futuro. Finalmente, desenvolvemos soluções para duas diferentes tarefas de predição: predição do ranking de popularidade de um conjunto de tips e a predição do nível de popularidade que uma tip em particular irá alcançar. Resultados experimentais mostram que um conjunto multidimensional de variáveis previsoras, que considera atributos do usuário que postou a tip e dovenue onde ela foi postada, leva a resultados mais precisos do que a utilização de cada um desses conjuntos isoladamente. Além disso, os modelos, quando aplicados às tips do Foursquare, são também mais robustos que os modelos do estado da arte para predição de popularidade, já que nossos modelos podem ser aplicados em qualquer tip, no momento da postagem ou após dela.
Abstract
Since the popularization of the Web 2.0, people are becoming increasingly engaged expressing their opinions with reviews about products and services. As any other type of user-generated content, online reviews come in various forms, sizes and qual-ities. Such quality variability is particularly prominent in textual reviews produced on mobile apps, often called micro-reviews or tips, due to their inherent conciseness. In such content abundant environment, being able to estimate the helpfulness of an online (micro-)review, and ultimately predict its future popularity among users as ac-curately and early as possible, can greatly benefit content filtering and recommendation methods, helping users find valuable reviews and providing quick feedback to business owners and future customers.
In this context, we investigate how users exploit micro-reviews, focusing partic-ularly on Foursquare tips, an increasingly popular type of review whose high degree of informality and briefness offers extra difficulties to the design of effective prediction methods. Using collected data from Foursquare, we also investigate how tip popularity, given by the number of times the tip received a “like” from a user, evolves over time and which factors impact this popularity evolution. Then, we explore how these factors can be combined to develop models to predict tip popularity at a given point in time in the future. We develop solutions to two different prediction tasks: predicting the popularity ranking of a set of tips and predicting the popularity level a particular tip will achieve. Our experimental results show that a multidimensional set of predictor variables, which considers features of both the user who posted the tip and the venue where it was posted, leads to more accurate results than using each set of features in isolation. Our models, when applied to Foursquare tips, are also more robust than state-of-the-art popularity prediction methods, as they can be applied to any tip, at or after posting time.
Keywords: micro-reviews, popularity, prediction, social networks, user behavior.
List of Figures
3.1 Screenshot of a Foursquare Venue Page. . . 35
4.1 User Tipping Activity on Foursquare. . . 42
4.2 Number of Friends and Followers and Number of Mayorships per User. . . 44
4.3 Fraction of Likes Received from the User’s Social Network (Friends and Followers). . . 45
4.4 Visiting and Tipping Activities per Venue. . . 46
4.5 Distributions per Venue Category. . . 47
4.6 Content Features of Foursquare Tips and Yelp Reviews. . . 48
4.7 Correlation between User Attributes (top 3% users with largest percentages of tips with links). . . 51
4.8 User Profiles: Attribute Distributions. . . 53
4.9 Venue Category Distributions. . . 54
4.10 Words Commonly Used in Users’ Tips. . . 56
4.11 Correlation between User Attributes (only users with at least 10 tips). . . 57
4.12 Degree Distribution of the User Network (log scale). . . 60
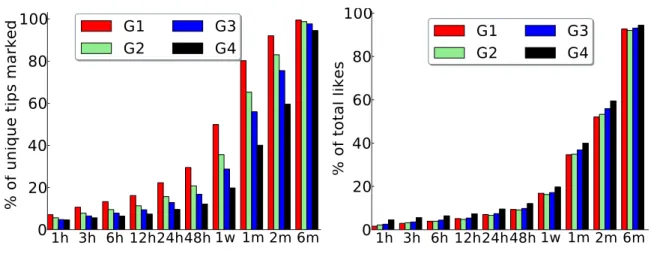
4.13 Distribution of Tip Popularity over Time. . . 68
4.14 Distribution of Percentage of Likes Received During the First Month after Posting Time. . . 70
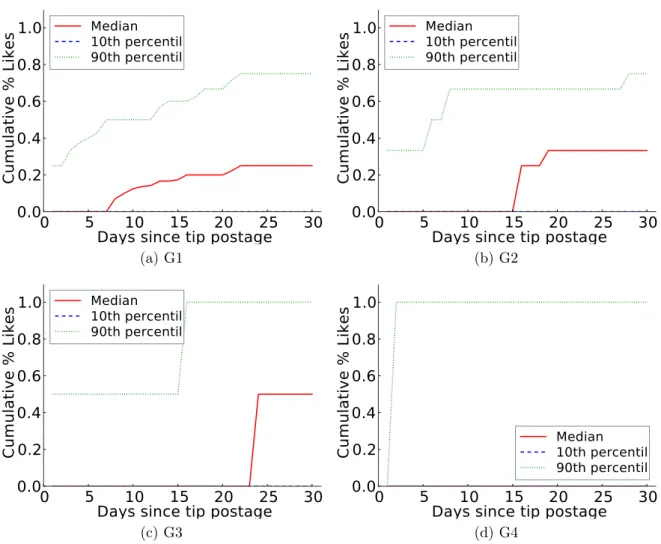
4.15 Distribution of Time Until x% of Total Likes are Received for the Most Popular Tips (G1) . . . 71
4.16 Social vs. Non Social Likes: Distribution of Percentage of Likes Received over Time. . . 72
4.17 Cumulative Distributions of Popularity Peak for Most Popular Tips (G1). . 74
5.1 Monitoring Time Scheme. . . 80
5.2 Temporal Data Split into Train and Test Sets. . . 89
5.4 Effectiveness of Ranking for Varying Target Timetr+δ: NY Scenario (Avg
and 95% Confidence Intervals). . . 93
5.5 Tips Ranking Example. . . 94
5.6 Effectiveness of Ranking for Varying Target Timetr+δ: NY Food Scenario (Avg and 95% Confidence Intervals) . . . 95
5.7 Effectiveness of Ranking when Removing One Feature at a Time: NY Sce-nario (Avg and 95% Confidence Intervals for All Considered Days) . . . 97
5.8 Effectiveness of Ranking When Using Only 4 Features forδ= 1 month (Avg and 95% Confidence Intervals) . . . 98
6.1 Monitoring Time Scheme. . . 104
6.2 Chronological Split of Training and Test Sets: Sliding Windows Over Time. 112 6.3 Macro-Average Results for Two Popularity Levels. . . 115
6.4 Macro-Average Results for Three Popularity Levels. . . 116
6.5 Results for Tips in the Low Popularity Category. . . 118
6.6 Results for Tips in the High Popularity Category. . . 119
6.7 Distribution of Most Important User Feature for Predicting a Tip’s Popu-larity Level. . . 122
6.8 Distributions of the Most Important Venue Features for Predicting a Tip’s Popularity Level. . . 123
6.9 Distribution of the Most Important Content Feature for Predicting a Tip’s Popularity Level. . . 123
6.10 Macro-Average Precision and Recall for OLS using one feature at time . . 124
6.11 Macro-Average Results for OLS After Removing Each Collinear Feature. . 126
6.12 Recall for OLS When Removing One Feature at a Time. . . 127
6.13 Macro-Average Results for Various Monitoring Timesε (δ = 1 month). . . 129
6.14 Macro-Average Results for Various Target Times δ (ε=0). . . 132
6.15 Model Accuracy in the Training Set (Each point is a Sector in the 10-Dimensional Space Defined by the Top-10 Features). . . 140
6.16 Model Accuracy in the Testing Set (Each Point is a Sector in the 10-Dimensional Space Defined by the Top-10 Features). . . 141
List of Tables
3.1 Summary of Our Venue Dataset. . . 38
3.2 Summary of Our User Dataset . . . 38
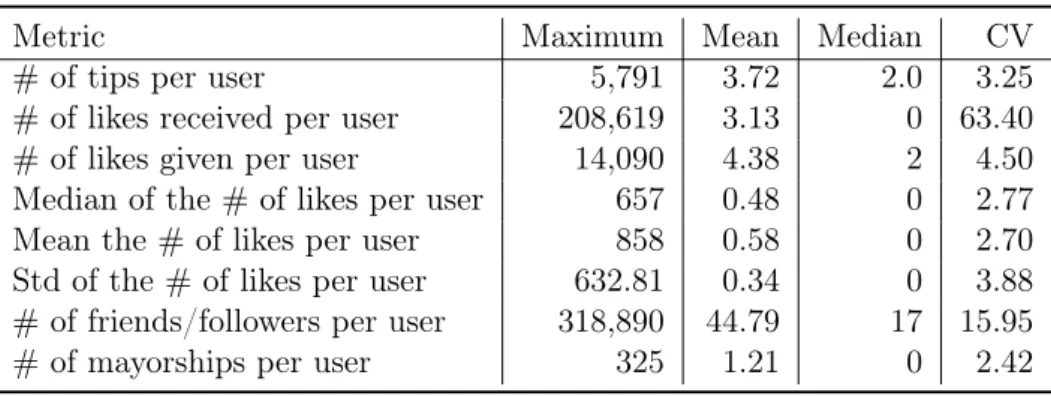
4.1 Summary of Users Tipping Activities. . . 43
4.2 Summary of Visiting and Tipping Activities at Venues. . . 45
4.3 Summary of Tip Textual Characteristics. . . 48
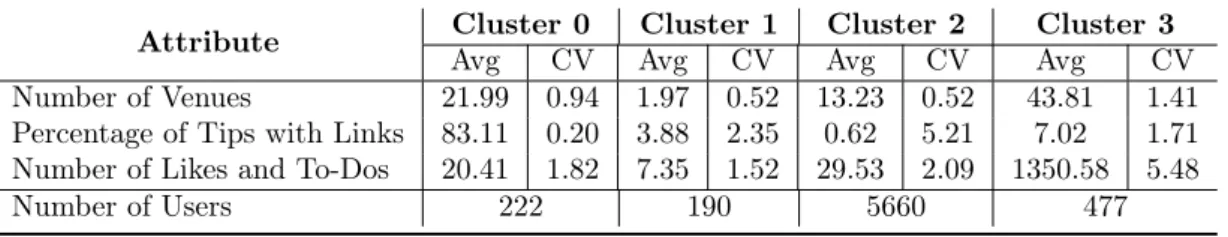
4.4 Summary of User Attributes Across Clusters. . . 52
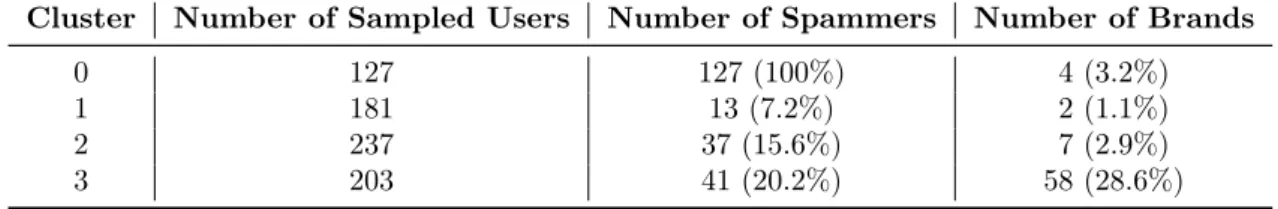
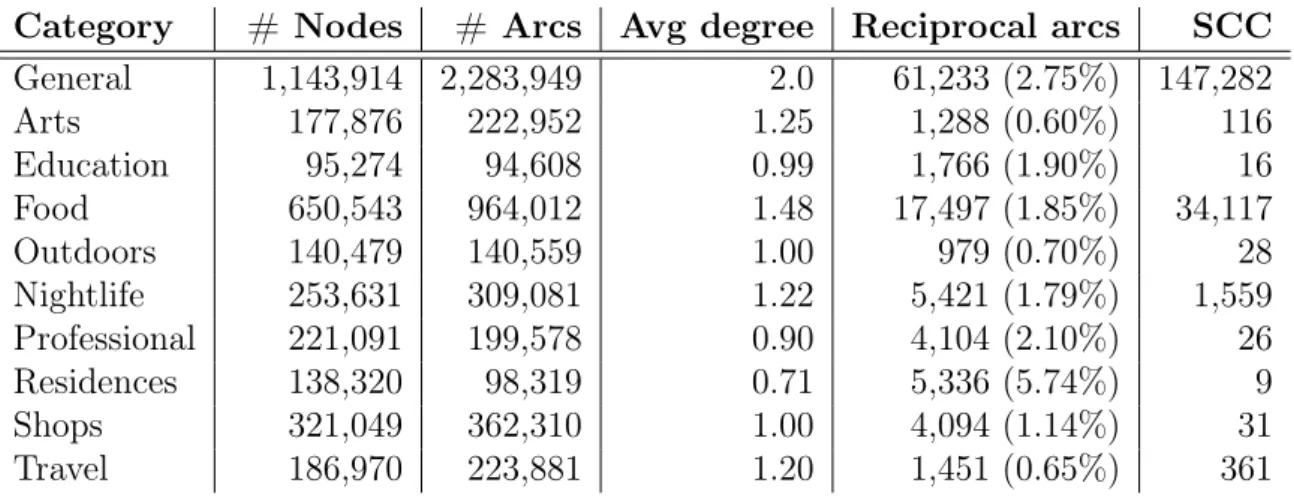
4.5 Results of the Manual Inspection of a Sample of Users from Each Cluster. 56 4.6 Summary Statistics for User Influence Networks per Venue Category as well as for All Categories (General). . . 59
4.7 Kendall τ Correlation Values Between Rankings Lists. . . 64
4.8 Top-5 Most Influential Users Overall and per Venue Category According to Each Method. . . 65
4.9 Distribution of Likes for Groups of Tips . . . 68
4.10 Rich-get-Richer Analysis: Coefficients α (and 95% Confidence Intervals) andR2 of Linear Regressions from (log) Popularity int r to (log) Popularity tr+δ. . . 75
5.1 Tip’s Syntactic Content Features. . . 86
5.2 Complete Set of Features for Tip Popularity Prediction . . . 88
5.3 Overview of Datasets and Scenarios of Evaluation . . . 89
5.4 Features Ranked by Information Gain . . . 96
6.1 Distribution of Candidates for Prediction Across Different Popularity Levels 103 6.2 Complete Set of Features for Tip Popularity Level Prediction . . . 111
6.3 Confusion Matrix for a Three-Class Classification Task . . . 113
6.4 Examples of Confusion Matrices for a Two-Class Classification Task . . . . 117
6.5 Features Ranked by Information Gain. . . 121
6.6 Features with High Collinearity with at Least One Other Feature. . . 125
6.8 Geographical Model Specialization: Macro-Average Results . . . 134 6.9 Categorical Model Specialization: Macro-Average Results. . . 136
Contents
Acknowledgments xi
Resumo xv
Abstract xvii
List of Figures xix
List of Tables xxi
1 Introduction 1
1.1 Basic Concepts . . . 4 1.2 Dissertation Goals and Contributions . . . 4 1.3 Challenges . . . 8 1.4 Organization of this Dissertation . . . 9
2 Literature Review 11
2.1 Information Credibility . . . 12 2.2 Predicting the Quality of User Generated Content . . . 13 2.2.1 Helpfulness of Online Reviews . . . 14 2.2.2 Opinion Mining . . . 18 2.2.3 Spam Detection . . . 19 2.3 Analysis of Online Content Popularity . . . 20 2.3.1 Popularity Prediction Models . . . 21 2.3.2 Information Propagation and Social Influence Models . . . 24 2.4 Analyses of Location-Based Social Networks . . . 27 2.5 Summary . . . 30
3 Foursquare: Case Study 33
3.1 Foursquare: Key Elements and Features . . . 33
3.2.2 Venue Dataset (Dataset 1) . . . 37 3.2.3 User Dataset (Dataset 2) . . . 38 3.3 Summary . . . 40
4 Tipping Activity on Foursquare: Characterization and User Influence 41 4.1 Characterization of Tipping Activity . . . 41 4.1.1 User Analysis . . . 42 4.1.2 Venue Analysis . . . 45 4.1.3 Tip Analysis . . . 47 4.2 User Profiles . . . 49 4.2.1 Suspicious Behavior . . . 49 4.2.2 Uncovering User Profiles . . . 51 4.3 User Influence . . . 57 4.3.1 User Behavioral Patterns . . . 57 4.3.2 User Influence Network . . . 58 4.3.3 Measuring User Influence . . . 60 4.4 Dynamics of Tip Popularity Evolution . . . 67 4.4.1 Popularity Evolution . . . 69 4.4.2 The Role of the Social Network . . . 71 4.4.3 Popularity Peak . . . 72 4.4.4 The Rich-Get-Richer Phenomenon . . . 73 4.5 Summary . . . 76
5 Predicting the Popularity Ranking of a Set of Tips 79
5.1 Popularity Prediction Task . . . 80 5.2 Ranking Strategies . . . 81 5.3 Tip Features . . . 82 5.3.1 User Features . . . 83 5.3.2 Venue Features . . . 84 5.3.3 Tip’s Content Features . . . 86 5.4 Experimental Setup . . . 87 5.5 Experimental Results . . . 91 5.5.1 Ranking Stability . . . 91 5.5.2 Prediction Results . . . 92 5.5.3 Experiments Removing Features . . . 94
5.6 Summary . . . 98
6 Predicting the Popularity Level of a Tip 101
6.1 Popularity Levels . . . 102 6.2 Tip Popularity Prediction: Formal Definition . . . 103 6.3 Prediction Methods . . . 104 6.3.1 Support Vector Machines (SVM) . . . 105 6.3.2 Ordinary Least Square Regression (OLS) . . . 106 6.3.3 Support Vector Regression (SVR) . . . 106 6.4 Tip Features . . . 106 6.5 Methodology Evaluation . . . 110 6.5.1 Experimental Setup . . . 110 6.5.2 Evaluation Metrics . . . 113 6.6 Experimental Results: Predictions at Posting Time . . . 114 6.6.1 Analysis of the Groups of Features . . . 114 6.6.2 Feature Importance . . . 120 6.7 Experimental Results: Other Prediction Scenarios . . . 127 6.7.1 Prediction Results Varying the Monitoring Period ε . . . 128 6.7.2 Prediction Results Varying Target Prediction Window δ . . . . 131 6.8 Model Specialization . . . 133 6.8.1 City-Based Model Specialization . . . 134 6.8.2 Category-Based Model Specialization . . . 135 6.9 Summary . . . 138
7 Conclusions and Future Work 143
7.1 Main Conclusions . . . 144 7.2 Directions for Future Work . . . 145 7.3 Publications . . . 148
Bibliography 149
Chapter 1
Introduction
In the last years, we have seen an increasing amount of data, especially on personal interests and activities, shared on the Web. This was possible thanks to the success of online social networks (OSNs) which not only have enhanced the connectivity among people but also have allowed the dissemination and visibility of user-generated content (UGC), previously restricted to some niches. Particularly, users are no longer only the target of information on products and services published in advertising campaigns but also often act as media and content producers, commenting on and evaluating previous experiences. Usually, these recommendations are posted as online reviews of products, services, and businesses. Previously, people used to share their opinions by word-of-mouth, orally to each other or through anonymous comments deposited in suggestion boxes. Nowadays, the social Web allows people to interact and freely share opinions on products, services or companies in real-time and in large scale.
In fact, the number of product and service reviews available online has been increasing at many retailer websites such as Amazon1
, and Walmart2
, as well as on specialized review websites such as Epinions3
, TripAdvisor4
and Yelp5
. More and more people base their buying decisions on online reviews written by others [Chen et al., 2004]. Indeed, several studies and surveys have found evidence that online reviews affect product sales [Chevalier and Mayzlin, 2006; Ante, 2009; Li and Hitt, 2008]. Moreover, these user generated reviews nourish the relationship between customers and real businesses, offering constructive criticism and possibly a competitive advantage to business owners. Reviews also work as a benchmark of their offered products and
1
http://www.amazon.com
2
http://www.walmart.com
3
http://www.epinions.com
4
http://www.tripadvisor.com/
5
http://www.yelp.com
services, and may be used to drive more effective marketing strategies [Chen and Xie, 2008].
The number of reviews on a single product or service available may be large, varying greatly in quality. Some reviews may contain spam or misleading and fake information [Lappas, 2012; Lin et al., 2014], which may make it hard for users to find helpful reviews. To support that task, many websites allow users to evaluate reviews, by voting in their helpfulness. Unfortunately, this feedback is usually very sparse [O’Mahony and Smyth, 2009]. Moreover, ranking reviews based solely on the helpfulness votes received may not be useful for promoting recently posted reviews, with few or no votes, which, regardless of their potential helpfulness, are doomed to be outranked by older reviews that have already received more votes. Thus, those reviews may never gain visibility.
This problem has already inspired a series of studies attempting to automatically predict the quality and helpfulness of a review [Kim et al., 2006; Liu et al., 2007; T.Ngo-Ye and Sinha, 2014], estimated by the number of people who found the review useful. The same metric can be also used as a measure of the review’s popularity as it provides a lower bound on the number of people who actually read the review. In order to compare with the state-of-the-art models, we here use the terms quality, utility, helpfulness and popularity interchangeably.
Both user and business owners can benefit from such predictions of review popu-larity, as they can drive the design of automatic review filtering and recommendation schemes as well as review ranking methods, which in turn can help users find poten-tially more valuable reviews (or reviews that are likely to draw more attention in the future). Predicting the potential popularity of a review can also stimulate reviewers to post higher quality reviews as a rapid feedback can be provided to review authors. Similarly, such predictions can also offer valuable feedback to business owners who are able to more quickly identify (and fix) aspects of their services or products that may affect revenues most, since potentially more popular reviews may contain information about how a product is seen by a larger fraction of the customers.
3
screen. This limitation may have also influenced the creation of new review services (Foursquare1
, Google+ Local2
), and the expansion of traditional desktop services to the mobile environment (e.g., Yelp, Trip Advisor). In these services, users write micro-reviews or tips, which are typically much more concise (e.g., up to 200 characters), often written while the information is still fresh in the user’s mind, and may contain much more subjective and informal content, varying from a narrow recommendation (“You must try the apple pie.”) to a general warning (“Stay away from this place”). In this dissertation, we focus on this special type of review, the micro-review (or tip)3
, popularized by Foursquare.
Unlike several traditional reviews systems, where users are allowed to assign un-helpfulness signals to a review, tips are rated by other users by simply clicking on a “like” mark. The number of “likes” received by a tip can then be seen as an estimate of its helpfulness or popularity. However, the lack of a “like” does not imply that a tip was not helpful or interesting, as it may not have been seen by any user. Moreover, utility is an abstract concept that can be more comprehensive than the fact that a user has given a “like”. This further contributes to make the automatic prediction of tip popularity much harder than in systems that offer a rating scale (e.g., 1 to 5), such as Yelp and Epinions. Moreover, tips are also different from product reviews since they may be active for much longer periods (e.g., a restaurant or an airport tip) and some product reviews may become inactive when a new version of a the same product is released.
Finally, the problem of predicting tip popularity is also inherently different from other efforts to forecast the attention to other user-generated content, such as tweets [Suh et al., 2010; Hong et al., 2011], news posts [Bandari et al., 2012], videos [Borghol et al., 2012; Brodersen et al., 2012; Figueiredo et al., 2014b] or ques-tions in a forum [Anderson et al., 2012; Li et al., 2012] which exploited mainly aspects related to the user who posted the information or the content itself (e.g., category). Unlike tweets, news, videos and questions, tips are associated with specific venues, and tend to be less ephemeral (particularly compared to news and tweets), as they remain associated with the venue (and thus visible to users) for a longer time.
1
https://foursquare.com/
2
http://www.google.com/+/learnmore/local/
3
1.1
Basic Concepts
This research focus on the Foursquare micro-reviews, known as tips. Foursquare is the most popular location-based social network (LBSN) where users can share their current location with friends and followers through check-ins. Check-ins are performed by users via devices with GPS (Global Positioning System) when they are close to a specific (physical) location, namedvenue, which has an associated page in the system. Thus, venues are virtual places that are grouped into a large variety of categories such as airports, monuments or squares that represent real locations like John Kennedy International Airport (New York, United States), Taj Mahal (Agra, India) or Eiffel Tower (Paris, France).
In addition to check-ins, users can post tips about a given location on the corre-sponding venue’s page. Foursquare tips are limited to 200 characters and may contain more informal or subjective content. than longer reviews. They can be informative (“This place opened in 2002”), contain some recommendation (“Try the Fettuccine”) or even a report of users’ experiences (“Best place for tacos” or “Avoid lunch time”). Unlike Yelp reviews, for example, which are much more extensive and often written “after the fact”, Foursquare tips are usually written “during the moment” using a mobile device, and thus tend to be more brief and direct, avoiding many details about specific characteristics of the venue.
When visiting a venue’s page, users may assign a “like” mark to a previously posted tip in sign of agreement with the tip’s content and/or intention to visit the (physical) location with which the tip is associated. The aggregate number of likes is an estimation of the tip popularity and the same metric is used by Foursquare for ranking the tips in the venue’s page.
1.2
Dissertation Goals and Contributions
In this dissertation, we investigate how users exploit micro-reviews focusing particularly on how the popularity of such pieces of content evolves over time and which factors impact this evolution. Then, we explore how these factors can be combined to develop popularity prediction models.
1.2. Dissertation Goals and Contributions 5
as they can provide useful insights into which features should be exploited in the design of the prediction models as well as a better comprehension about the prediction results. We then develop regression and classification methods that exploit the most important factors to predict the future popularity of a tip as soon as it is posted, or at most, a short period afterwards. We develop solutions to two different prediction tasks: (1) predicting the popularity ranking of a set of tips, and (2) predicting the popularity level of a tip, whereas the former focuses on the relative (future) popularity of a group of tips, the latter tackles whether a particular tip will achieve a certain popularity level in the future.
A ranking of the most popular tips can be used to summarize a large set of tips focusing on the most popular ones for a scenario of interest. For example, a list of tips with a greater potential to become popular posted at any venue in the user home city. Moreover, to estimate the popularity of a single tip can benefit both users and venue owners. For instance, the system can offer different filtering strategies to the users based on the prediction, while venue owners can quickly react to opinions that may have a greater impact on decision making.
Specifically, our investigation tackles the following three questions:
1. What are the most common user behavior and interaction patterns while using micro-reviews? How does the popularity of a tip evolve over time? How is it affected by the social network of the tip’s author? To which extent does the rich-get-richer phenomenon impact the popularity evolution of tips? (Chapter 4)
First, we present a characterization of user behavior on Foursquare. Our analyses were performed over a collected Foursquare dataset consisting of more than 1,5 million users, more than 6 million tips, and 5 million likes. This study consisted of two main phases. First, we characterized venues and users with respect to number of tips, number of likes and to-dos1 as well as percentage of tips containing links
(i.e., URLs or email addresses). We have also identified four groups of users with different tipping behavior, including one that is consistent with spamming.
Using a larger Foursquare dataset, containing over 10 million tips and 9 million likes posted by over 13,5 million users, we modeled the user interactions through tips and likes using a graph to identify the most influential users. To that end, we proposed a variation of the PageRank algorithm in which each arc of the graph is weighted by the number of tips posted by each node (user). Using the modified PageRank, we were able to identify users that were influential by consistently
1
receiving feedback in their tips. Moreover, we found users that were influential in a given venue category, which suggests that the category of the venue must be taken into account in the tip popularity prediction task.
Furthermore, we characterized how the popularity of different sets of tips evolves over time, and how it is affected by the social network of the user who posted the tip (its author). We observed that tips experience a very slow popularity evolution, compared to other types of user-generated content (UCG), such as news articles and photos. Moreover, the social network of the tip’s author has an important influence on the tip popularity throughout its lifetime, but espe-cially in earlier periods after posting. Compared to other types of UCG, such as YouTube videos, we observe a weaker presence of the rich-get-richer phenomenon in the popularity evolution of tips, suggesting that other factors, but the current popularity, may significantly impact the tip’s future popularity.
2. Which are the most important factors for predicting the popularity of Foursquare tips? How can we tackle the problem of predicting the future popularity of tips? (Chapter 6.4 and 6)
We identified three important entities related to the Foursquare system that may impact a tip’s popularity: the user who posted the tip, the venue where it was posted, and its content. We investigated the potential benefits from exploiting these aspects to predict the popularity of a tip (or a group of tips) will achieve at a future time.
To that end, we considered two different tasks. The first prediction task aimed at ranking a group of tips based on their predicted popularity at a given future time. We exploited a regression model using the aspects from the three most important entities as predictors. Moreover, we evaluated the stability of the tip popularity ranking over time, assessing to which extent the current popularity ranking of a set of tips can be used to predict their popularity ranking at a future time. We then found that the set of features used in our model can improve the prediction accuracy, given that enough training data is available.
The second prediction task is more challenging since it tackles the problem of predicting the popularity level of a single tip1
. We addressed this problem by formalizing it as a classification task. Since over 80% of the tips received no like at all, great part of this dissertation is focused on predicting the popularity
1
1.2. Dissertation Goals and Contributions 7
of a tip at posting time or when there is no information about the tip current popularity. For that goal, we employed classification and regression methods along with an extended set of features related to the tip author, venue and content as predictors. We investigated the relative importance of each predictor variable, finding that features extracted from both the user and the venue are among the most important ones on Foursquare.
3. To which extent can we improve prediction by monitoring the tip for a short period after posting? How do the prediction models behave as we predict further into the future? Can we improve prediction accuracy by building specialized models? (Chapter 6)
The slow popularity evolution of a Foursquare tip also raises a question as to how robust our solutions are to long-term predictions. By monitoring the tips for a certain time after their creation, we expect to add to our models information about how its popularity is evolving, which may contribute to improve predic-tions. We also investigated how far into the future we can predict tip popularity with reasonable accuracy, that is, we analyzed how robust our prediction mod-els are when we perform long-term predictions. Our intent is to analyze when our models become less accurate since we expect that the accuracy drops as the prediction are performed further into the future. We found significant improve-ments in prediction accuracy as we extend the initial monitoring time, although prediction accuracy may drop as we predict for more than 2 months ahead in the future.
We also investigated whether factors related to a specific geographic region (e.g., city) or category of venue impact how the popularity of a tip evolves over time. To that end, we built specialized prediction models using only tips posted in a specific city or in a specific venue category, and compared to which extent such models improve over the single general model. We found that model specialization does bring some (limited) improvements if performed at the city-level, whereas category-based specialization does not bring clear and consistent gains.
of malicious behavior (e.g., spammers or detractors that can harm a user or business reputation). For marketers or advertisers the popularity prediction is valuable since a popular review may be tied directly to a product or service revenue which can be estimated ahead in time and negotiated by all parties involved. Furthermore, the sys-tem can provide incentives to users whose contributions increase the overall value of content on the site. More broadly, the knowledge uncovered in our study may help un-derstanding how the dynamics of the user community in the target application works.
1.3
Challenges
The prediction of the popularity of micro-reviews poses several challenges.
• New content type: tips have inherent characteristics that distinguish them from other types of content and that might impact their popularity evolution. For example, tips are associated with specific venues, and thus are visible to all users that visit the venue, including those that are drawn to it by other reasons (e.g., other tips). Also, tips usually contain opinions that might interest others for much longer periods of time than other types of content such as news and tweets. Thus, tips may remain live in the system, attracting attention (and likes), for longer periods.
• Content analysis: most of the previous proposed models to automatically esti-mate the popularity or helpfulness of a review formulate the problem as clas-sification or regression problem using observed features, i.e. textual or social features. Textual features are usually related to the structure, syntactic, read-ability and sentiment of the review’s content. However, most of tips do not follow any formal structure (e.g., capitalizing the first letter, punctuations, truncated sentences, etc.) and they may present an informal vocabulary (word abbrevia-tions, emoticons, slangs, etc.) [Thurlow and Brown, 2003; Grinter and Eldridge, 2003; Thelwall et al., 2010]. These variations cause problems since most content features rely on readability metrics that requires a good text structure. More-over, typical sentiment analysis algorithms assume that the text is written on standard spelling and grammar, so the current algorithms are unlikely to work well on that scenario.
1.4. Organization of this Dissertation 9
effect. Thus, one of our main challenges is to formalize these factors and assess the impact that they have on tip popularity.
• Data sparsity: both tip and user interactions are extremely sparse, as will be shown in Chapter 4. Our analyses of the features related to the main entities – user, venue and tip’s content – revealed that most of them exhibit very large variability, with great concentration on few users, venues and tips. For instance, according to our analyses, 49% of the tips were posted by only 10% of the users. Such very skewed distribution of number of likes per tip brings technical chal-lenges to the prediction task modeling [He and Garcia, 2009; Liu et al., 2009] (e.g., severe class imbalance when predicting the popularity level of tips). Moreover, over 80% of the tips used in our experiments received no like at all, which means that these tips have no information about their popularity. Thus, this limits the effectiveness of the state-of-the-art methods that uses early measurements, since they cannot be applied to these tips and shows the robustness of our model since we are able to perform predictions at posting time.
• Model evaluation: to evaluate our prediction models, our dataset has been chrono-logically split into training and test sets. However, this splitting schema has more restrictions than the cross-validation schema which may also cause the class im-balance problem.
1.4
Organization of this Dissertation
Chapter 2
Literature Review
In this dissertation, we study the popularity of micro-reviews. We use the number of likes received as our measure of the tip’s popularity. Moreover, the same measure can be seen as an estimation of the tip helpfulness or quality since it reflects the number of people who found a tip useful and indirectly assessed its quality. Thus, there are two groups of studies related to our problem: one aims at assessing the helpfulness or quality of reviews, whereas the other tackles the prediction of the popularity of online content.
Most previous work on assessing the helpfulness of reviews has typically focused on automatically determining the quality, helpfulness or utility of reviews using tex-tual features. However, such features are more appropriate for longer and formally structured reviews. Micro-reviews are shorter than traditional reviews, usually having length constrained to around 200 characters in order to be published and read on a variety of platforms. This size constraint has led users to write reviews using non-standard textual artifacts (e.g., emoticons) and informal language [Bermingham and Smeaton, 2010].
Moreover, in some micro-reviews systems, such as Foursquare, the micro-reviews, known as tips, are rated by other users only by simply marking them as “liked”, as op-posed to in other review systems where reviews are rated through rating or helpfulness votes. Likes are not as informative as ratings, since the lack of these marks cannot be seen as an unhelpfulness signal. These aforementioned factors make the prediction of the helpfulness or popularity of micro-reviews a challenging task. To the best of our knowledge, no previous study has tackled the popularity of micro-reviews, but there are several threads of related research which we will review in this chapter that have guided us during our model design.
We start by briefly discussing studies on information credibility in Section 2.1.
We conjecture that the helpfulness or popularity of a micro-review can be influenced by the perceived credibility of the reviewer. Based on this conjecture, some of our proposed features (see Chapter 6) are inspired by some of these credibility directives. Next, in Section 2.2, we discuss previous analyzes of the quality of various types of user generated content with particular focus on the assessment of the quality of online reviews. In this section we also briefly review other related efforts towards automati-cally detecting the polarity (positive, neutral, negative) of online reviews and detecting spam of fake reviews. Such studies can be considered complementary to this disserta-tion. For example, we use sentiment scores as content features exploited as input to our popularity prediction models (Chapter 6). Moreover, as a result of our characterization of user tipping activity, we were the first to uncover evidence of spamming activity on Foursquare (Chapter 4).
From the perspective of predicting the popularity of online content, we also survey recent work on popularity prediction models and on information propagation and social influence in Section 2.3. These proposed models are highly influenced by the target application and by the type of data (e.g., number of video views, number of retweets, number of digg votes) which makes unfeasible the creation of a generic prediction model [Tatar et al., 2011]. However, some of our analyses and proposed features are inspired and/or adapted from these previous work. Finally, we present previous analyses of location-based social networks (LBSNs) in Section 2.4.
2.1
Information Credibility
The Web 2.0 has empowered users to express their opinions by interacting with others through social networks and by publishing a wide variety of user-generated content such as blogs, online forums, product or service reviews, among others. However, not all information available on the Web is credible or comes from reputable sources. Credibility affects how customers perceive the quality of online services and influences their decision-making processes.
2.2. Predicting the Quality of User Generated Content 13
factors have the greatest impact on user’s perceptions of credibility. They found that the evaluated web site attributes fall into seven dimensions: five of them increase perceptions of credibility (real-world feel, ease of use, expertise, trustworthiness, and tailoring) while the other two contribute with negative perceptions of credibility (the commercial implications of the site, and amateurism). This study was performed for websites, but we use these dimensions to guide our choice of some features used in our popularity prediction model.
Credibility has also been analyzed in the social media domain. For the task of exploring trending topics on Twitter, Castillo et al. [2011] studied the information credibility of topics defined by a set of tweets. They used Amazon Mechanical Turk to gather user judgments about the credibility of a tweet, and extracted the most relevant features from each topic. They defined a complex set of features over messages, users, topics and propagations which were used to build a classifier to automatically assess the level of credibility of the topic. Based on a credibility framework for blog post retrieval proposed by Rubin and Liddy [2006], Weerkamp and de Rijke [2012] defined two groups of credibility indicators, namely post-level (e.g., spelling, timeless, post length) and blog-level (e.g. regularity, expertise, comments) indicators. Concerning online reviews, several studies were developed to automatically assess their helpfulness considering various credibility indicators. Those studies are discussed in the next Section.
2.2
Predicting the Quality of User Generated
Content
We start by discussing quality in different contexts, and then focus on online reviews, our target domain. Our research is inspired by several previous studies that focused on analyzing the quality of socially generated content, including the quality of Wikipedia articles [Dalip et al., 2011, 2014], video or news comments [Siersdorfer et al., 2010; Hsu et al., 2009; Chen et al., 2011], and user-contributed answers on community question answering (CQA) forums [Anderson et al., 2012; Li et al., 2012].
Yahoo! News. The proposed model uses a term-based representation of comments (TF-IDF or term frequency – inverse document frequency) to automatically classify them as likely to obtain a high overall rating or not. With a similar goal, Hsu et al. [2009] proposed an SVR-based model to rank comments posted by users on Digg based on their quality. They exploited features such as the comment posting time, the number of articles submitted, and comment length. Chen et al. [2011] focused on user reputation in comment rating environments (Yahoo! News and Yahoo! Buzz). They showed that the quality of a comment judged editorially is almost uncorrelated with the ratings that it receives, but can be predicted using standard text features (e.g., length, spelling, and readability scores). Closely related to our target problem of estimating the popularity of a (micro-)review is the problem of predicting if a question will have long lasting value. With that particular goal, Anderson et al. [2012] demonstrated that features that mapped the user activity related to a question (e.g., pageviews) within a short interval after it was posted can help predict the number of page views that a question will receive. Li et al. [2012] investigated the quality of questions in CQA services, defined by a combination of the following features: the number of tags-of-interest (reflecting the attractiveness of a question), the number of answers, and the amount of time for getting the best answer. They also proposed a mutual reinforcement-based label propagation algorithm to predict the quality of a question using features of the question’s text and of the askers profile. Finally, Momeni et al. [2013] developed a classifier for predicting useful comments on YouTube and Flickr exploiting, for that task, not only textual features, but also features that describe the author’s posting and social behavior, such as the number of links posted and the size of the author’s social network.
In this dissertation, we also apply regression methods used in some of those studies, particularly the SVR method. However, we applied these techniques in a novel context, using other sets of features, to automatically predict the popularity of micro-reviews.
2.2.1
Helpfulness of Online Reviews
We now turn to previous efforts to predict the quality (helpfulness or utility) of online reviews, which are more closely related to our work.
2.2. Predicting the Quality of User Generated Content 15
the reviews available in some websites motivate the use of filtering, reputation and personalized recommendation mechanisms to help users to find useful reviews [Kim et al., 2006; Hsu et al., 2009; O’Mahony and Smyth, 2009]. Indeed, some websites, such as Amazon, allow users to indicate whether he/she finds a review helpful. These meta ratings help users filter relevant reviews more efficiently [Siersdorfer et al., 2010], and summarize a general opinion about a product or service. However, such type of feedback is still sparse, with many reviews, especially the most recent ones, failing to attract any feedback. This problem has inspired several research studies about automatic prediction of the quality of reviews. The task of assessing the quality [Liu et al., 2007; Lu et al., 2010; Yu et al., 2010], utility [Zhang and Varadarajan, 2006; Liu, 2010] or helpfulness [Kim et al., 2006; Zhang and Tran, 2008; O’Mahony and Smyth, 2009; Tsur and Rappoport, 2009; Korfiatis et al., 2012; Ngo-Ye and Sinha, 2012] of a review, is typically addressed by employing classification or regression-based solutions using a set of observed features, often textual features, as predictors, and the users’ votes as ground-truth.
Liu et al. [2007] identified three types of biases in the Amazon review ranking system. The first type was observed through an imbalance voting pattern, where users tend to value others’ opinions positively more often rather than negatively. The second one, the rich-get-richer effect, named as winner circle bias by the authors, was characterized by a larger amount of votes accumulated by the top reviews, while the third type (early bird bias) observed a clear trend that the earlier a review is posted, the more votes it will get. Moreover, the authors proposed an SVM-based approach to detect low-quality reviews, based on a manually determined ground-truth in accordance with proposed set of specifications for judging the quality of a review. However, the proposed model is based only on features suitable for longer (e.g., more verbose) and structured reviews (e.g., number of positive sentences, number of product features or brand names in the review).
Similarly, Danescu-Niculescu-Mizil et al. [2009] found that the perceived helpful-ness of a review depends not only on its content, but also on the relation of its score to other scores. The authors investigated the dependency between helpfulness of product reviews from Amazon users, and concluded that users tend to consider reviews that agree with the average item rating as helpful. We attempt to capture similar trend in our models by using features related to the specific venue where the tip was posted, including characteristics of previously posted tips.
extension of that work, the same authors considered structural features (e.g. ratio of uppercase characters, number of words, etc.) and readability features (e.g. scores indicating the difficult in reading the text) to develop a classification technique to au-tomatically identify the most helpful reviews [O’Mahony and Smyth, 2010]. Korfiatis et al. [2012] observed that review readability has a greater effect on the helpfulness ratio of a review than its length. We make use of some of the features defined by these three studies in our model, but we extend them by using social network information and features capturing the sentiment (or polarity) of the micro-reviews.
Other studies have considered estimating the helpfulness of a review using regres-sion models. Basically, these studies aim at ranking the reviews by their helpfulness score (defined by the fraction between positive and negative votes) or at estimating their average rating, which is usually a real value between zero and five. Ghose and Ipeirotis [2007] studied the economic impact of online reviews using product reviews from Amazon. They proposed two mechanisms for ranking product reviews: a con-sumer oriented ranking mechanism which ranks the reviews according to their expected helpfulness, and a manufacturer-oriented ranking mechanism which ranks the reviews according to their expected effect on sales. Their experimental results showed that subjectivity analysis can give useful clues about the helpfulness of a review and about its impact on sales.
Zhang and Varadarajan [2006] found that syntactic features, such as number of proper nouns, comparatives and modal verbs extracted from the text reviews, are the most effective predictors for SVR and linear regression to predict utility of a product review. They observed that the perceived utility of a product review highly depends on its linguistic style. Kim et al. [2006] also used SVR to rank reviews according to their helpfulness, exploiting textual features such as length and the unigrams1
, and the rating score given by the reviewers. They concluded that the review length and the number of stars in product rating were the most useful features for the regression model. Liu et al. [2008] proposed a non-linear regression model that incorporated the reviewers’ expertise, the review timeliness, and its writing style for predicting the helpfulness of movie reviews. They found that timeliness was a good predictor as the general helpfulness of a movie review declines for older reviews. Reviewer expertise was also found to be a useful feature, motivating the exploration of features that effectively describe user preference. The authors also used their proposed regression model as a classifier to retrieve only reviews having a predicted helpfulness higher than a certain threshold. In this dissertation, we also use regression methods to classify a tip into
1
2.2. Predicting the Quality of User Generated Content 17
multiple levels of popularity based on their predicted popularity. However, the textual features proposed in [Liu et al., 2008] are once again more suitable for longer reviews and the timeliness factor is not observed in our Foursquare dataset.
T.Ngo-Ye and Sinha [2014] compared several text regression models for predicting the number of people who would find a review helpful, using datasets from Amazon and Yelp. Their proposed models exploit the words extracted from reviews and the re-viewer engagement characteristics such as reputation, commitment and current activity as input features. The authors found that incorporating features capturing reviewer’s engagement and using a subset of unique review words selected by a dimension reduc-tion method (Correlareduc-tion-based Feature Selecreduc-tion) help predict review helpfulness. We used some of these reviewer’s engagement features such as frequency (number of reviews written before the current review) and monetary value (average number of helpfulness votes received for all her previous posted reviews) as predictors in our model. We also exploit the words micro-review’s content by taking their sentiment as predictors.
Tsur and Rappoport [2009] proposed an unsupervised method to rank book re-views according to their helpfulness. Their method works in stages: first, the algorithm identifies the terms that are less frequent, but contributes more information that is rel-evant to a specific product (dominant terms). These terms will constitute the core of a virtual optimal review. The reviews are then converted to a feature vector representa-tion defined by the terms in the virtual core, and ranked according to their distances from the core. Martin and Pu [2014] developed a method to predict the helpfulness of a review using emotion features extract from the review text. The authors based their study on three product review datasets (Yelp, TripAdvisor, and Amazon) and used a general lexicon of emotion words (GALC [Scherer, 2005]) to extract words that con-vey emotions to the readers. They applied supervised classification algorithms (SVM, Naïve Bayes, and Random Forest) to estimate if a given review is helpful or not. The authors’ framework showed an improvement up tp 9% when compared to models that use only text statistics or readability features.
user preferences. Such features capture if a review has attributes that the user prefers to know, whether the user who wrote the reviews was a buyer of the product, and the divergence of the polarity of the review from the mainstream opinion. Moghad-dam et al. [2012] proposed a series of probabilistic factorization models to address the problem of personalized review quality prediction. Their models are based on the as-sumption that the observed review ratings depend on latent features of the reviews, reviewers, raters, and products. Lee and Choeh [2014] used neural networks to predict helpfulness of Amazon reviews. They found that characteristics of the product such as its list price, its sales rank, and textual characteristics of reviews such as the average number of words in a sentence, the number of words, and the number of one-letter words in the review are important for estimating helpfulness. Tang et al. [2013] an-alyzed various types of social context (i.e. author, rater, connection and preference contexts) to predict unknown helpfulness ratings of reviews using matrix factorization based methods. As in Moghaddam et al. [2012], the authors claim that the helpfulness of a review is not necessarily the same for all users. Moreover, the dual role of a user (i.e. author and rater) must be considered as separated contexts. We adapted some of these features to our domain.
In sum, those prior studies are based mostly on content features, which are suit-able for more verbose and objective reviews, and thus may not be adequate for predict-ing the popularity of tips, which tend to be more concise and subjective. Moreover, previous studies did not address how helpfulness as perceived by users (or popularity) of reviews evolve over time, as we do in this dissertation.
2.2.2
Opinion Mining
ex-2.2. Predicting the Quality of User Generated Content 19
perimental results showed that the unsupervised approach produced results that were statistically tied to those of the best supervised method (Naïve Bayes) without the cost of labeling. We use the same steps of the unsupervised approach to generate the scores used in our sentiment features. Gonçalves et al. [2013] compared eight popular sentiment analysis tools for social networks in terms of coverage (i.e., the fraction of messages whose sentiment is identified) and agreement (i.e., the fraction of identified sentiments that are in tune with ground truth). The authors found that the methods have varying degrees of coverage and agreement and that no single method is always best across different text sources. Moreover, the problem setting in these studies differs from ours as we use the sentiment of the review as a feature to predict its popularity rather than trying to predict the sentiment itself.
Nguyen et al. [2013] proposed a heuristic to select a small set of reviews that cover as many tips as possible with as few sentences as possible. By covering the tips, the authors expected to identify the review content that is more important to provide a summary of the content of the tips. They claimed that tips are good for quick zooming in on what is interesting about a item. However, when there is a large collection of tips, they may be repetitive and fragmented. Thus, the authors claimed that by selecting the reviews that cover the tips, they would obtain a readable, flowing text that would summarize and expand upon the tip content. The problem tackled by Nguyen et al. [2013] differs from our target problem as we are not aiming at selecting tip for summarization purposes.
2.2.3
Spam Detection
training examples while the first spam type was detected by verifying whether reviews involved many opinions opposing to the majority of the other reviews. Lappas [2012] presented a study of fake reviews from the perspective of the attacker, formalizing the factors that determine the success of an attacker and exploring different attack strategies. Akoglu et al. [2013] proposed an unsupervised network-based framework to detect fraudulent users and fake reviews in online review networks using textual features and the reviewers’ social networks as input features. Lin et al. [2014] proposed six features to find the spam based on the review content and reviewer behaviors. They applied supervised and unsupervised methods to identify the review spam as early as possible.
In this dissertation, our characterization study (Chapter 4) revealed the presence of spamming activity in Foursquare tips. Specifically, we revealed the existence of users who post tips whose contents are unrelated to the nature or domain of the venue where the tips were left [Vasconcelos et al., 2012b]. We discuss this further in Chapter 4. Indeed more recent studies analyzed this problem using machine learning techniques to detect user behavior related to tip spamming in LBSNs [Costa et al., 2013; Aggarwal et al., 2013].
2.3
Analysis of Online Content Popularity
Broadly related to our prediction task of popularity of micro-reviews is the work of assessing the popularity of online content. We review prior efforts in this direction by first describing, in Section 2.3.1, studies about popularity prediction models in several systems such as Twitter, YouTube, Digg, Boards.ie (community forums), and Facebook. Next, in Section 2.3.2, we discuss prior studies on information diffusion models using both explicit (created from users’ contacts) [Leskovec et al., 2007; Bakshy et al., 2009] and implicit (created by the users’ interactions) network links [Gruhl et al., 2004] as well as studies on the identification of influential or experts users [Zhang et al., 2007; Adamic et al., 2008; Agarwal et al., 2008; Cha et al., 2010; Bakshy et al., 2011].
2.3. Analysis of Online Content Popularity 21
2.3.1
Popularity Prediction Models
Several studies have addressed the problem of predicting the popularity of newly up-loaded content. Most studies exploited textual features extracted from the messages (e.g., hashtags and URLs) or the topic of the message, as well as user related fea-tures, such as the number of followers and the source of the message (celebrities or organization) to predict content popularity in several systems.
For example, in the context of Twitter, Hong et al. [2011] tackled the problem of predicting the popularity of tweets as a classification task based on several types of features, including textual content, structural properties of the user graph, meta-data of users and messages (e.g., number of previous retweets), as well as temporal information. Suh et al. [2010] built a predictive retweet model using a generalized linear model with content and contextual features. They also identified that amongst content features, URLs and hashtags are strongly correlated with retweetability, while the number of followers and followees as well as the age of the user account are among the most important contextual features. Bandari et al. [2012] used regression and classification algorithms to predict the number of times a news URL was posted and shared on Twitter. They exploited features extracted from the news article, such as the source of the article, the category, subjectivity of the language, and the named entities mentioned in the article. Similarly to our work, Hong et al. [2011] and Bandari et al. [2012] also defined classes or levels of popularity, and developed solutions to predict which class a given tweet or article will belong to at a certain future time.
Borghol et al. [2012] developed and applied a methodology to assess the impact of various content-agnostic factors on the popularity of YouTube videos. They focused on analyzing differences among videos that have essentially the same content (clones) using a multi-linear regression model to determine which factors most influence video popularity. In that study, popularity was defined by the number of views during a given week. Our methodology has some similarities with the one adopted in [Borghol et al., 2012]. For example, we model several other factors such as the influence and activity of the user social network as well as specific Foursquare characteristics related to the venues which have no counterpart on YouTube.
not affect the content exposure, which contrast to our findings (Chapter 4). Pinto et al. [2013] extended the simple log-linear model proposed by Szabo and Huberman [2010] by building multiple linear regression models to predict the video popularity. Unlike the base model [Szabo and Huberman, 2010] which used the total number of views up to a reference date as single predictor, the proposed multivariable model uses daily views during the same period1. The authors also proposed a second model variant
that includes, in addition to daily views, Radio Basis Functions (RBF) to capture the similarity between training and test data. The authors found that their RBF model leads to an accuracy gain of 71% over the model proposed by Szabo and Huberman [2010]. In Chapter 6, we used these two models, the log-linear model Szabo and Huberman [2010] and RBF models [Pinto et al., 2013] to compare with your proposed models.
Lerman and Hogg [2010] proposed a stochastic model to predict the popularity (number of votes) of user’s post generated on Digg based also on early user reactions to this new content. Their model considers the complex interactions among content quality, the layout of the website, and the influence among users.
Yin et al. [2012] proposed a model to rank potentially popular items based on their early votes. The authors evaluated their model using a joke sharing application, where users can post jokes, and other users can vote if they like or dislike them. Their model assumes users tend to be conforming to the opinions of the majority in the user community (conformers) while some others exhibit contrary voting behavior (mavericks). Each person has different distributions of these two patterns, which can be learned according to the observed voting history. The authors pointed out that their model is more suitable for application in which people patterns’ distributions tend to be stable for items without complex genres (e.g., jokes) as opposed to items with multiple genres (such as movies). This method may not work in our scenario since the users are not allowed to mark a tip as disliked on Foursquare. Moreover, the approach proposed by Yin et al. [2012] is based on ranks of new items while our goal is not only to rank but also to predict the potential popularity level that an individual item can achieve. Our proposed models explore other types of features and scenarios, in which the monitoring time is variable. In particular, we analyze the tip popularity at posting time, while the above studies require early votes to perform predictions.
Wagner et al. [2012] studied the patterns of user attention towards content shared within online communities, where attention was measured by the number of replies to a given post. One of their findings was that the purpose of a community may influence
1
2.3. Analysis of Online Content Popularity 23
how individual factors affect the attention pattern of that community. For example, posts from advice-seeking communities which contain many links in their contents are less likely to get replies, while posts from content sharing oriented communities which typically have a high number of links may have a positive impact and make posts more likely to attract the attention of such a community. They also concluded that the factors that impact whether a discussion starts tend to differ from factors that impact the length of the discussion.
Yu et al. [2011] analyzed the popularity of social marketing messages on Face-book. Using the number of likes to measure the popularity of a message, the authors evaluated the effectiveness of marketing strategies used by a number of messages from restaurants, analyzing only their textual content. The messages were grouped into “more popular” (number of likes above average) or “less popular”, and modeled using a bag-of-words representation. Two classification methods (SVM and Naïve Bayes) were used to separate messages into the two popularity classes, and rank the most discriminative features. There are some major differences between this work and our proposal. First, their method is limited only to textual content while we also make use of several features related to the user who posted the tip and the venue where the tip was posted. Second, their approach using bag-of-words may be not effective for short and informal messages such as Foursquare tips. Finally, the authors suggest to overcome the lack of dislike votes using the comments left by the users to disclose both positive and negative sentiment about the posted marketing message. In our work, we take an alternative approach and make use of the SentiWordNet scores of each tip term to capture the polarity of its content.
for tail-part forecasts while Yang and Leskovec [2011] developed a clustering algorithm to uncover the temporal dynamics of Twitter hashtags. As future work, we intent to explore time series techniques in our popularity prediction problem.
All these previous efforts towards predicting the popularity of a online content have a similar goal compared to ours. However, our type of data, micro-reviews, does not fit completely in these models. As mentioned before, some of them have assumptions that hold only for contents with shorter life cycles (e.g., tweets or news) or features that do not have a counterpart on Foursquare, such as dislike votes.
2.3.2
Information Propagation and Social Influence Models
An important aspect that may affect the popularity of a content is the social influence or the fact that a individual may not make decisions independently, but rather are influenced by the behavior of other individuals. There are some contrasting theories or views about how an idea, a trend or an innovation can be spread or assimilated by people.
One of the views on social influence is based on a theory called “the two-step flow of communication”, in which ideas often flow from the mass media to a group of individuals (opinion leaders), who are very persuasive or well-connected, and from those to the social groups they belong to [Katz, 1957]. Since this seminal work, the opinion leaders have been the subject of several studies [Gladwell, 2002; Walther et al., 2010; Wu et al., 2011a]. Moreover, technology changes with the emergence of new forms of media such as blogs, online communities and social networks have caused the fragmentation of the mass audience into many smaller audiences. Nowadays, people can select the information which they want to be exposed to and in some cases people can generate new information themselves [Wu et al., 2011a]. The media fragmentation made the traditional adverting strategies less effective. Consequently, marketers have turned their attention to other marketing strategies (e.g., word-of-month, viral and buzz marketing) that focus on opinion leaders.
2.3. Analysis of Online Content Popularity 25
which viral marketing is effective. Bakshy et al. [2009] studied diffusion of “gestures” between friends in the social network of the Second Life virtual game. By examining the cascading trees, they found that roughly 48% of data transfers occur along the so-cial graph. We observed similar results in the high percentage of liking activity coming from the tip author’s friends or followers, as discussed in Chapter 4.
Other studies explored algorithms using network structure to identify experts or influential users. For example, Zhang et al. [2007] discussed several approaches to identify and rank experts in a Java forum, using network-based algorithms, such as PageRank [Page et al., 1998] and HITS [Kleinberg, 1999]. Adamic et al. [2008] investigated Yahoo! Answer forums using network and textual analysis finding that user interactions vary depending on the forum topic. They also found that some categories of Yahoo! Answer forums are characterized by the presence of experts while others have a different dynamics. We employed some of the network analyses performed in that work in our characterization of tipping activity in Foursquare (Chapter 4) aiming at identifying influential users.
Agarwal et al. [2008] proposed a graph-based algorithm to identify influential bloggers based on their blog posts. The authors defined four features: recognition, activity, novelty, and eloquence which they expected to be present in an influential post. They weigh these four features to produce a combined score for each blogger. Cha et al. [2009] studied the spread of photo bookmarks on Flickr and found that social links are a dominant method for information propagation. Moreover, their results show that even popular photos do not spread neither widely nor rapidly through the Flickr network, contrary to viral marketing intuition.